“SPY has yet to post a new daily low (below SPY, 394.49). If or when it does, that’s just one more addition to the bearish scenario.”
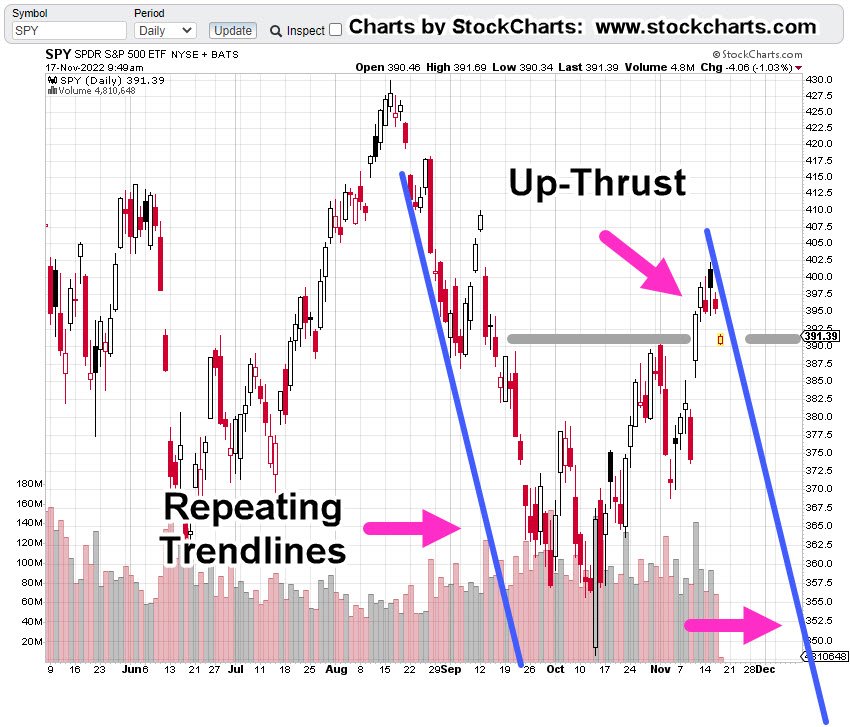
This morning’s open, puts the SPY below that 394.49, level and potentially confirms an up-thrust reversal as well as downtrend contact (shown below).
However, let’s not get ahead of ourselves as the first order of business, especially with the S&P (SPY), is an attempt to close this morning’s gap.
While that’s happening, let’s look at the charts.
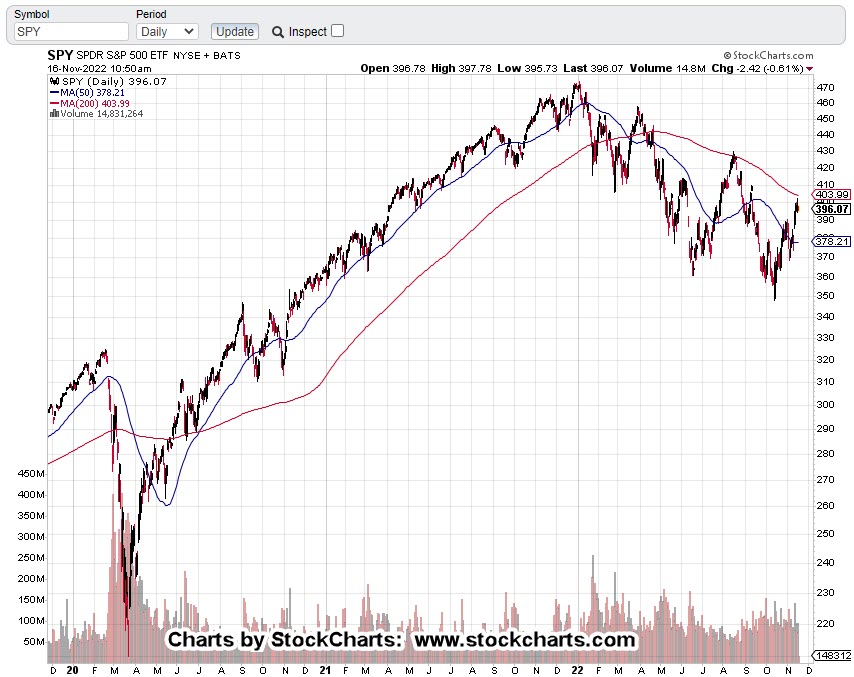
S&P 500, SPY, Daily
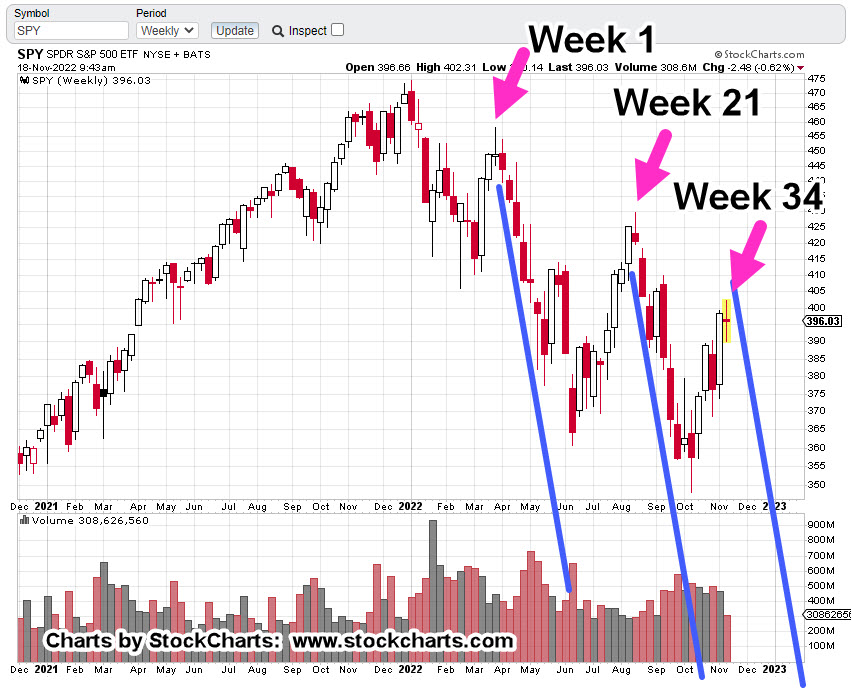
Looking at the wider timeframe, first.
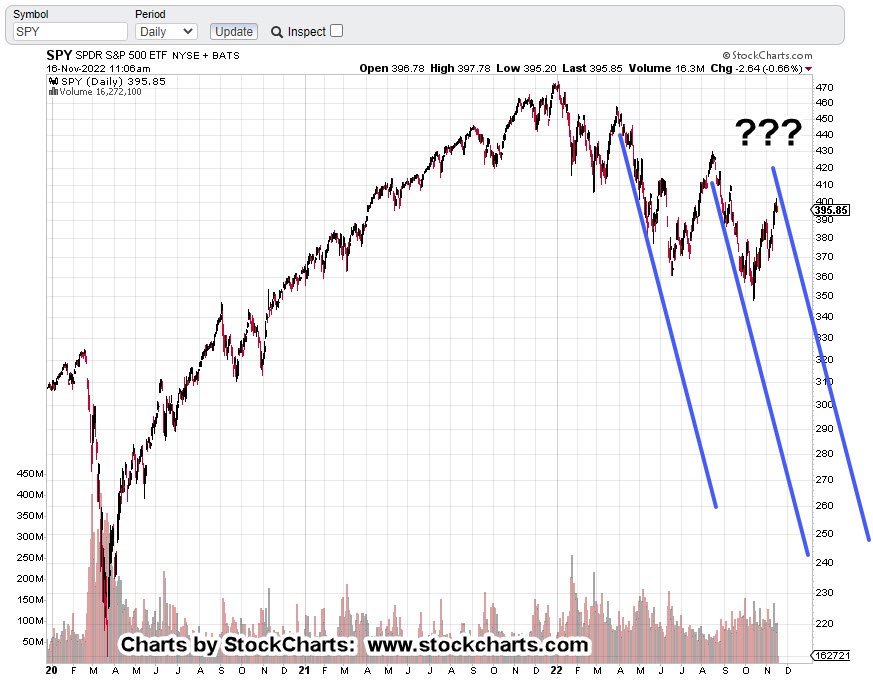
Now, let’s get closer-in.
As this post is being created, SPY is attempting to close the opening gap as expected.
Confusion Rules
As posted earlier, events are accelerating to the downside.
Supporting that assessment, we have this just out on the Crypto carnage; then on the flipside, we have this report, pointing to more upside.
Meanwhile, biotech pivots lower.
Part of the objective of these posts is to document the procedure (Wyckoff analysis) being used to select the market(s) most susceptible for a significant decline.
With that, it’s been on again off again with biotech for most of this year.
However, it looks like we’re now, at another (possibly, final?) pivot point lower.
Positions: (courtesy only, not advice).
The biotech short is being built in real time (not advice, not a recommendation).
Note: Posts on this site are for education purposes only. They provide one firm’s insight on the markets. Not investment advice. See additional disclaimer here.
Lastly, using the way-back machine, here’s an article from the Seattle Times, written in December 1999. It compares the situation (then) to a century earlier.
On Track For Another?
Obviously, that can’t be known until if/when, it happens.
However, we can look at the most watched market, the S&P, and see what it says.
S&P 500, SPY, Daily
We’re leaving in the moving averages to show, at least from the 200-Day perspective, the downtrend is still intact.
Other items to note:
The market is still sub-dividing lower, lower highs, lower lows. Price action’s retraced to a Fibonacci 38% (shown below), and is also in Wyckoff up-thrust (reversal) position.
We’ll get closer-in with the details.
Moving averages have been removed for clarity.
The blue line is the resistance and up-thrust area. Price action clearly above and apparently, hesitating.
Dashed grey line is the Fibonacci 38% retrace from all-time highs (1/4/22), to the most recent lows set on 10/13/22.
Zooming back out, is the scariest part of this chart.
There’s no doubt; we’ve had at least two repeating trendlines. A third could make it a trading channel.
Summary
As of this post (11:28 a.m., EST), SPY has yet to post a new daily low (below SPY, 394.49). If or when it does, that’s just one more addition to the bearish scenario.
Positions: (courtesy only, not advice).
The focus is on biotech; uniquely positioned as the weakest of all the major indices (not advice, not a recommendation).
Note: Posts on this site are for education purposes only. They provide one firm’s insight on the markets. Not investment advice. See additional disclaimer here.
There’re a lot of moving parts to biotech and it’s like a game of chicken.
Is there going to be another ‘planned’ event pulled out of the bag that requires ‘protection’ or will this side (and this one) win-out before that happens?
Price action’s always the final arbiter and right now, it’s positing lower.
Gold:
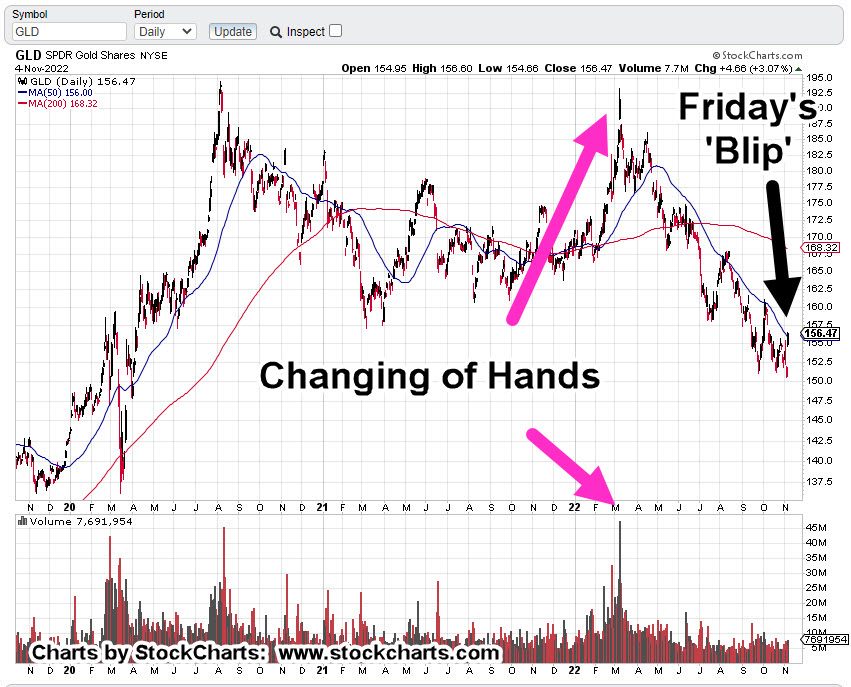
Gold (GLD) ‘blipped’ higher on Friday and the usual suspects are out touting the hyperinflation narrative.
Owning (some) precious metals seems to be a good thing.
However, the public constantly knee-jerks into this sector and is absolutely rabid in their behavior (i.e., silver stockpiles are running out!!!).
It suggests at least, there’s something else afoot.
Prechter published in the early 2000’s, Central Banks, are followers, not leaders. The fact they are buying gold at this point, may be a contrary indicator.
Talk about going against the herd. 🙂
Over and again, it’s the boring (does not generate ‘clicks’) food supply first, then gold and silver (not advice, not a recommendation).
Real Estate:
What can be said?
It’s the largest manufactured bubble in world history and it has already popped.
Thinking it’s all going to sort itself out in a year or two is delusional. We’ve probably got decades of bear market.
Tesla:
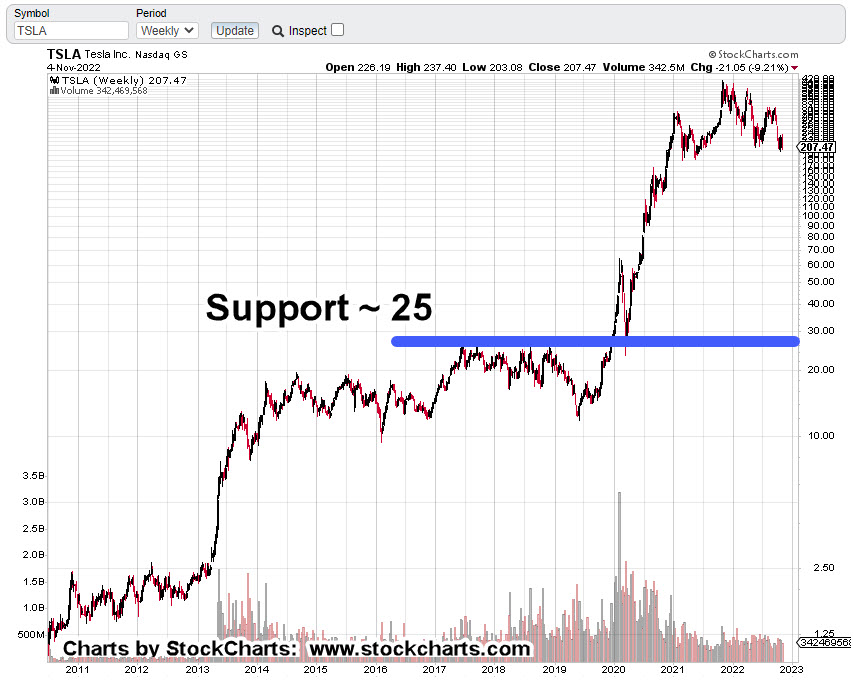
Anyone with an anode of research capability, knows the whole EV premise, is based on a falsehood.
However, that fact is probably not what’s going to bring Tesla (and the rest of the market) down.
Let’s stop for a moment and consider the above link which has been available for nearly four-years.
How many views? Just 9,824 (as of this post)
That equates to only 0.003% of the U.S. population.
As the global supply chains implode, getting parts and having stable infrastructure (i.e., electricity) will probably be the defining factor.
Now, on to the charts.
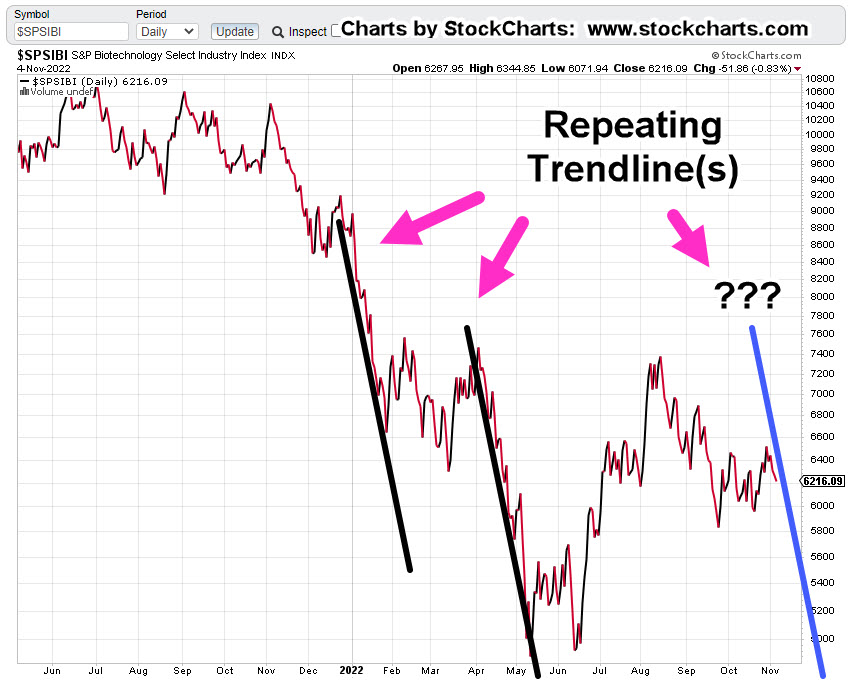
Biotech SPBIO, Daily Close
The following sessions will let us know if we’re at the right edge of the downtrend line.
We’ve already had an up-thrust reversal and a test of that reversal. last Friday was lower … probabilities point down.
Gold GLD, Daily
Looking at the chart on the strategic, longer term, Friday’s blip is hardly noticeable. We’ve already presented how this could be a minor up-thrust (reversal) in itself.
To keep the upside intact, price action must remain and continue above current levels.
Real Estate IYR, Daily
Real estate may be working its way into an up-thrust condition. As shown, Fibonacci Day 21 from the October 13th, low is this coming Thursday, the 10th.
According to the Economic Calendar there are several potential catalysts that may push the price above resistance (temporarily).
Note: Posts on this site are for education purposes only. They provide one firm’s insight on the markets. Not investment advice. See additional disclaimer here.
Of course, the already hammered bond market (TLT), got hammed some more.
It’s what happened next, and what’s happening today, that’s important.
That is, the sell-off was quickly reversed (to the upside) with that upside continuing this session.
The bond supply is being absorbed.
So, what does that mean?
It’s possible, the bounce, melt-up, squeeze or whatever one wants to call it could be over. There may already be a ‘flight to safety’ if there’s such a thing these days.
But let’s not hypothesize on what could be happening. The market itself (price action), tells us.
Bonds TLT, Daily
At about mid-session, this is where we are.
We’re right at the downtrend line.
The attempt to mover lower (yesterday), has been rejected.
As a result of today’s new daily high, the stop on position TMF-22-01, has been moved up (not advice, not a recommendation).
So, we’re now between the downtrend and the ‘rejection’; something’s likely to break.
Summary
The S&P (SPY) just posted an up-thrust reversal early this session and is still moving lower as of this post.
Keep in mind, all of this is happening before any Fed announcement … as if the market has already decided.
A quick note on biotech, SPBIO.
Position size has been increased in SPBIO, leveraged inverse LABD, as shown below (not advice, not a recommendation).
This sector remains at The Danger Point®
If the bounce really is over, biotech is likely to get hit the hardest.
Positions, Market Stance (courtesy only, not advice).
TMF-22-01:
Entry @ 7.166, Stop @ 6.77***
***, Indicates change
LABD-22-09***
Entry @ 19.88, 19.71***, Stop @ 18.69***
Note: Positions may be increased, decreased, entered, or exited at any time.
Note: Posts on this site are for education purposes only. They provide one firm’s insight on the markets. Not investment advice. See additional disclaimer here.
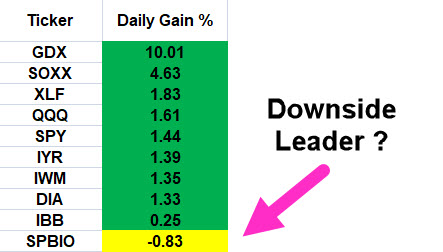
The last update, posted late in the session, said with the upward bias provided by the sizable Op-Ex event, we can look for the weakest (or one of the weakest) sectors.
The chart below summarizes yesterday’s action:
Friday 10/21/22, Single Day Gains
Gold miners GDX, is the outlier at the top and real estate IYR, the outlier at the bottom.
Before anybody gets excited about ‘hyperinflation’, just a reminder; silver SLV’s, action has retraced to a weak 38.2% (chart not shown), as it was forecasted to do from last week’s update:
“Silver (SLV) is currently at support levels; therefore, some upward action (staying below SLV: 18.5) is normal behavior.”
Price action is the final arbiter; we’ll see what happens next.
Back to real estate.
Professional Wisdom: ‘The Crash’
We’re going to use the experience and insight provided by Scott Walters concerning the potential for real estate; that is, we’re in a world-wide event the scale of which, no one alive (and possibly, ever) has seen before.
The Economic Ninja has just seconded that opinion (time stamp 3:45) with his quote:
“Right now, we are in the greatest collapse since The Great Depression; and I believe it will be as severe, if not worse, sharper, faster, than what people experienced in 1929”.
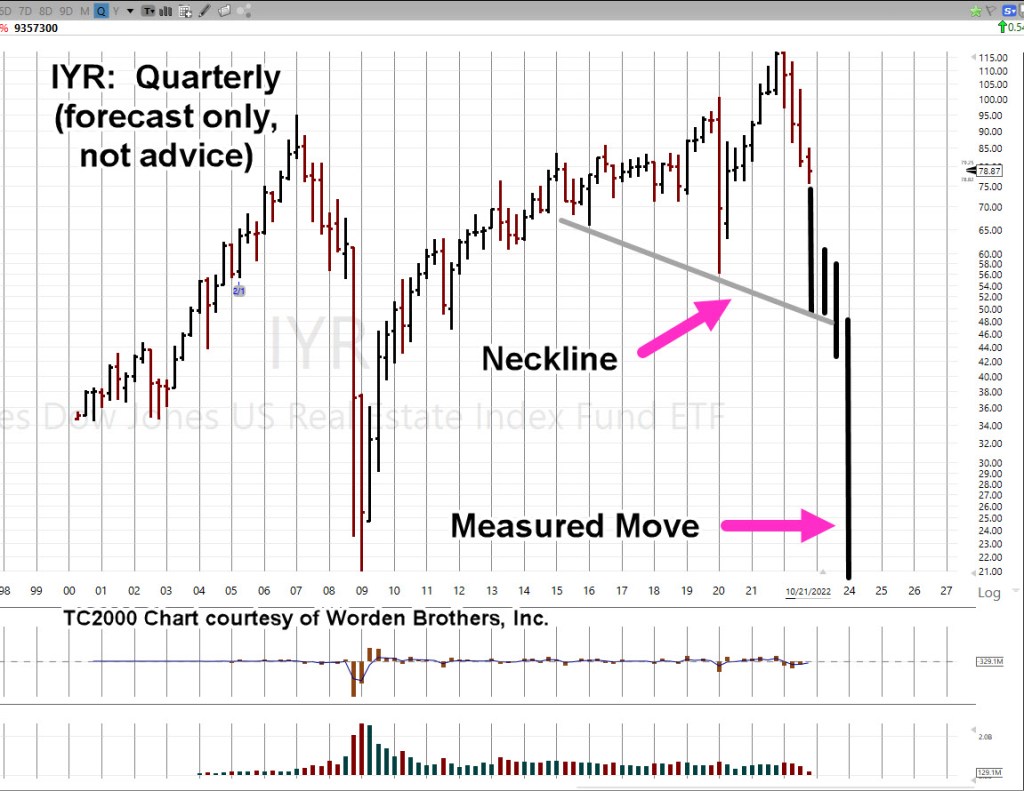
So, what would that ‘collapse’ look like on a chart of real estate, IYR?
Ah, yes. That’s the hard part.
To take useful wisdom like that above, and somehow map it into potential market behavior.
For that, we’re going to use the Quarterly chart of IYR.
Real Estate IYR, Quarterly
There are still two months and one week left to go in the 4th, Quarter.
We’re at a confluence of price action as we’ll cover in the Hourly chart farther down; first, what’s the potential?
Here is one artist’s rendition (not advice, not a recommendation).
That puts it into perspective.
We may know at the very next open, if we’re pivoting higher or continuing the decline.
Butterfly In The Amazon
Of course, the market’s not going to tell anyone its next move. We have to decipher that (read the tape) ourselves.
Sometimes, as Wyckoff said a century ago … ‘It’s as if the weight of a feather is all that’s needed, to push the market further or to reverse.’
So, let’s look at that feather (the butterfly) on the hourly chart.
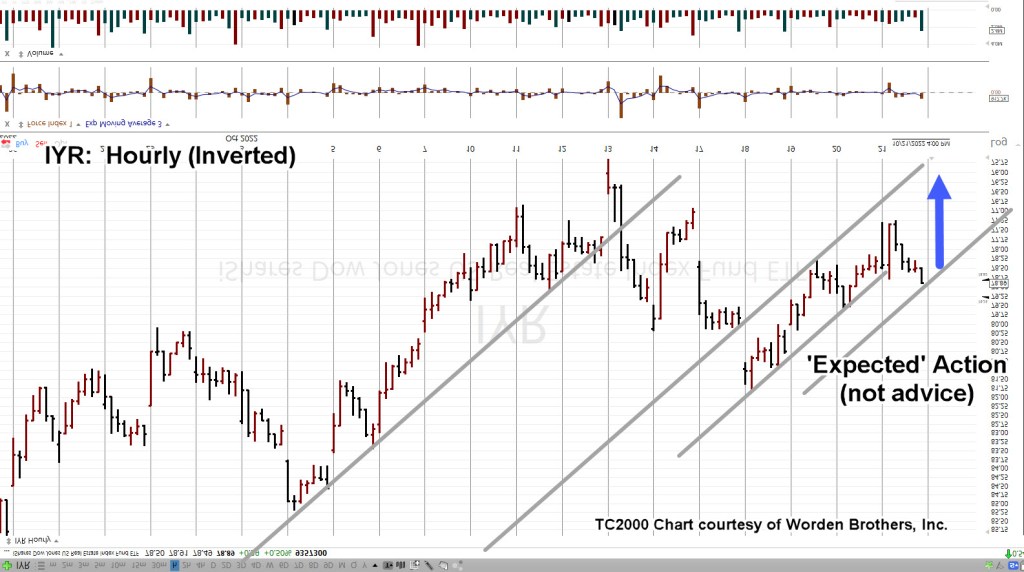
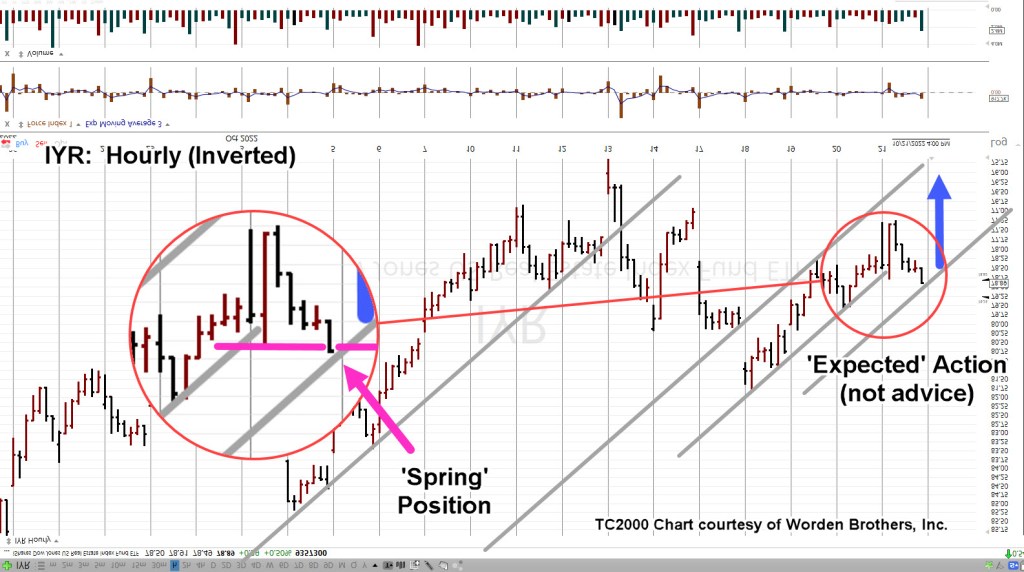
Since we’re positioned short (DRV-22-05), the chart’s inverted to mimic leveraged inverse fund DRV.
Real Estate IYR, Hourly (Inverted)
The important part is we see a repeating pattern of trendlines.
Moving in closer, we have this. The blue arrow is ‘expected’ action based on the analysis up to this point (not advice, not a recommendation).
Moving even closer, the zoom shows IYR, finished the day in Wyckoff spring position; having pushed past minor support (resistance on non-inverted).
Summary
If IYR opens lower or gap-lower, we’ll have to wait and see if it posts a new daily low (below IYR ,77.24).
If that happens, we have some confirmation lower prices are ahead and can then set a definitive stop for DRV-22-05.
Obviously, a higher open (pushing past IYR 78.91), negates the trade.
Note: Posts on this site are for education purposes only. They provide one firm’s insight on the markets. Not investment advice. See additional disclaimer here.
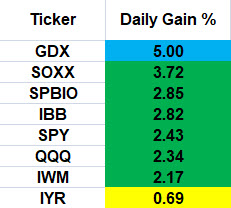
The $2-Trillion Op-Ex today, provided upward bias for the overall markets.
Not expected, was biotech SPBIO, to be part of that move.
After today and possibly because of this announcement, we’re out of the sector until price action demands attention.
While the Dow, S&P, NASDAQ were up significantly for the day, obviously absent, was real estate (IYR).
Days like today help narrow the focus. Who is not participating in the up move?
While the other indices are up multiple percentage points, IYR, finished the day up only +0.69%.
Real Estate (IYR) Weekly
The prior linked YouTube post from Scott Waltersis not the premise for going short (not advice, not a recommendation).
It is, however, a reminder that what’s going on, is at a level no one has seen before.
Unless IYR, somehow gets out of the channel, it’s declining at -84%, annualized.
The set-up for this short trade (DRV-22-05) is based on a weak retrace (to 38.2%) on the daily with the anticipation, today’s reversal bar will ‘fail’ at the next session.
Real Estate, (IYR) Daily
The expectation for the next session is straightforward; lower open or gap-lower open and posting a new daily low.
The chart of IYR below, shows what we’re looking for (not advice, not a recommendation).
Obviously, a new daily high at the next session negates the set-up and warrants a trade exit.
A new daily low and we’ve got a ‘failure’ of the reversal bar; DRV-22-05, is liklely to be increased (not advice, not a recommendation).
Note: Posts on this site are for education purposes only. They provide one firm’s insight on the markets. Not investment advice. See additional disclaimer here.
It’s best to let the reader sort out what it all means, arriving at one’s own conclusions.
Of course, the obvious problem, the ‘elephant’ is not addressed directly.
However, VAERS is quoted in The Epoch Times article, thus giving it legitimacy.
Leading The Downside
For some time, this site’s highlighted, biotech (SPBIO), as unique to all other indices save GDX, and GDXJ.
That is, it’s down the most since the bear market started.
As of today’s close, it’s down over – 54%, from all-time highs while the S&P is down only – 23.7%.
As documented over several years, the sector’s unique; it’s at risk (more than other indices) to implosion.
With today’s close, it looks like we’re at a critical juncture.
Biotech SPBIO, Weekly
The unmarked weekly chart
Compressed, with added trendlines.
It’s an obvious trading channel of immense size … but so is nearly everything else concerning these markets. We’re operating at unprecedented scale in unprecedented times.
But wait, there’s more.
The trading channel has Fibonacci time correlation(s).
We’ll expand the weekly chart for more clarity.
From channel entry, week ending 9/3/21, to the right-most contact point (week ending 9/16/22), is Fibonacci 55-Weeks.
Channel width measured from week ending 1/28/22, to the same contact-point, week ending 9/16/22, is a Fibonacci 34-Weeks.
We’re at The Danger Point®
Positions & Current Stance (courtesy only, not advice).
The following is the positioning of my firm’s main (largest) account.
DRV-22-04:
Entry @ 66.463, Stop @ 63.98
Discretionary exit (today) @ 75.96***
Trade Closed
LABD-22-08:
Entry @ 25.1278, 24.735, 26.025***, 22.99***, Stop is Open (to be set at next session)
***, Indicates change
Note: Positions may be increased, decreased, entered, or exited at any time.
Note: Posts on this site are for education purposes only. They provide one firm’s insight on the markets. Not investment advice. See additional disclaimer here.
Well, another financial media lie has come and gone.
As Jerrimiah Babe says, time stamp 6:05, at this link:
“The good times are over.”
The Dow Jones was down over 1,000 points on the day and finished (along with the S&P, NASDAQ) right at the session lows.
Typical action for the markets under such conditions, is a follow-through at the next trading session, Monday.
Recall, it’s been presented many times on this site (Holiday Turns), major reversals tend to occur just before, during, or just after, a holiday week.
The 2008, countertrend reversal took place on the Monday (5/19/08), leading into Memorial Day Weekend. The big one in 1929, was the Tuesday (9/3/29) following the Labor Day Weekend.
The current reversal (discussed below), if it holds, has come a couple weeks early in the ‘holiday’ window.
It’s possible because of the massive size of this monster, that a week or two does not make a difference.
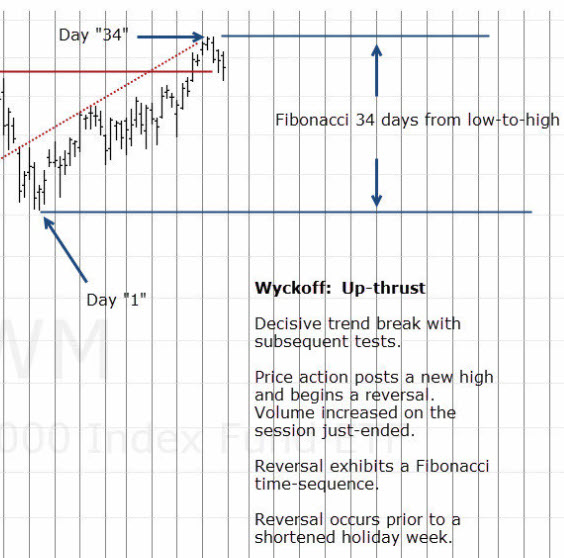
Let’s look at the Dow 30 and its perfect Wyckoff Up-Thrust, Reversal, and Test.
Dow 30, DIA Daily Close
Daily Close with Fibonacci retrace levels identified.
A close-in look on the reversal area.
Looking at the zoom-chart above, we had a Wyckoff Up-Thrust that touched 61.8%, then declined sharply before coming back to test at 50%.
After the test was another sharp decline. One can make the case, the up-thrust has been tested.
Continued (overall) downside is the higher probability with a ‘no Fed pivot’ providing the tailwind.
Note: Posts on this site are for education purposes only. They provide one firm’s insight on the markets. Not investment advice. See additional disclaimer here.
It looks like having a real (positive) P/E, may be about to be important.
The prior biotech update said that so far, no P/E, negative P/E, and ‘no money down’ was not affecting the sector.
That is, until now.
Well, ok. I made up the ‘no money down’, part. 🙂
That little jest does not take away from the fact, biotech SPBIO, and its top three weightings, BEAM, TWST and FATE, have all reversed, decisively to the downside.
For the week just ended, BEAM is down – 22.86%, TWST down – 19.18%, and FATE down – 14.16%.
Back at the ranch in the IBB index, Moderna (MRNA) is also down – 14.65% for the week.
So, we have confirmation the entire industry is now continuing its downward course.
Contrast the reversal of index SPBIO, at – 7.04%, with S&P (SPY) at – 1.16%, and the market itself is telling us where to go for opportunity (not advice, not a recommendation).
At this point, all three amigos (BEAM, TWST, FATE) are in downward trading channels.
Trading channel for BEAM is the most aggressive. The weekly chart is below.
Beam Therapeutics (BEAM) Weekly
If BEAM maintains its channel for the rest of this year, the chart below shows the target area(s) for price action.
The coming week may let us know if this channel will be confirmed or negated.
Recall, the S&P is topping out and appears to be reversing.
Goldman says the squeeze is over but that ‘downside is limited’.
Note: Posts on this site are for education purposes only. They provide one firm’s insight on the markets. Not investment advice. See additional disclaimer here.
Evidently, according to this out on ZeroHedge, stocks will be a good buy when the Fed pivots; apparently getting back to 2%, inflation.
So many lies, half-truths and pre-suppositions, all in one sentence. Let us count the ways.
Actually, let’s not.
At this point in time, one does not want to draw any undue attention.
A better idea is to see what the market’s saying about itself. This is the crux of Wycoff analysis.
Wyckoff stated a century ago (1902, to be exact), stock prices moved based on an energy of their own; at times, completely disconnected from fundamentals.
Looking at those markets and from my own tracking spreadsheet, 106, indices or equities are currently monitored.
That list will change over time but it’s typically around 100 or more ticker-symbols.
Of that number, the following are those currently in a downward sloping trading channel.
Note: Posts on this site are for education purposes only. They provide one firm’s insight on the markets. Not investment advice. See additional disclaimer here.