Note: Posts on this site are for education purposes only. They provide one firm’s insight on the markets. Not investment advice. See additional disclaimer here.
Who knows what type of ‘weather’ we’ll have this time.
So, nat-gas can’t go any lower than where it is now, right?
Wrong
That type of thinking’s called a ‘Mind Trap’, link here.
David Weis would typically start mentoring sessions with a question (after presenting a chart):
“What do you see?”
Forgetting all the factors that ‘should’ drive the price of nat-gas higher, we have the chart.
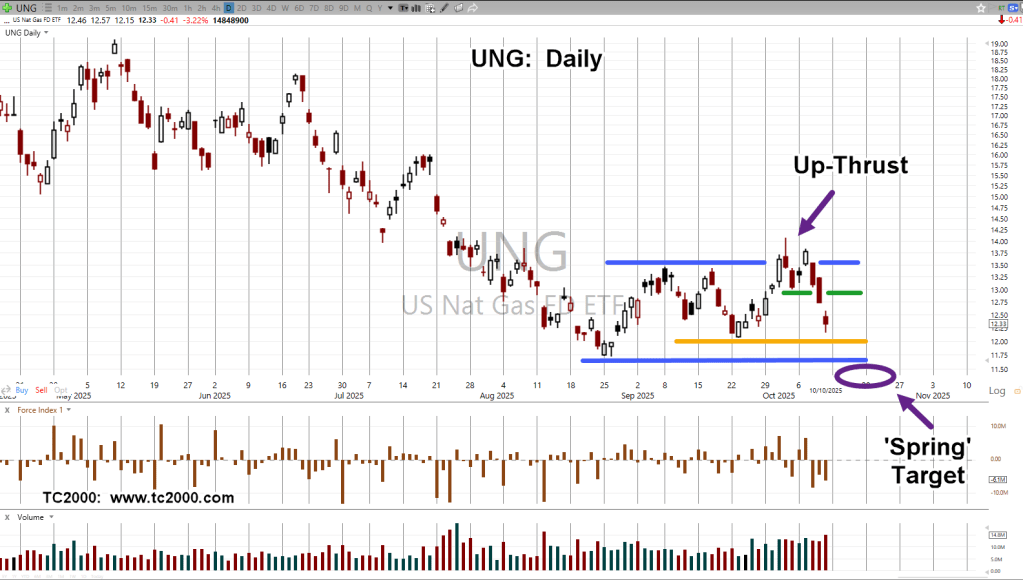
Natural Gas ETF, UNG: Daily
The upper blue line is resistance which price action ‘up-thrusted’ (reversed).
The green line is a minor support area.
This is where a long position was initiated (UNG-25-01). The expectation for the next day (last Friday), was for an immediate increase it price.
That didn’t happen. The long position, the only ‘long’ for this year, was exited (not advice, not a recommendation).
The orange line is another support area but the lower blue line, if UNG gets there, is the ‘spring’ set-up target.
U.S & China Nat-Gas
Last Friday’s chaos with China and tariffs, begs the question if Chinese nat-gas shipments would be used as a tit-for-tat pawn; meaning, China halts all purchases.
The short answer is no.
For all of 2025, there’ve been no shipments, link here.
With that said, if nat-gas is going to move lower to the target area shown, then something else would be the driving mechanism.
Note: Posts on this site are for education purposes only. They provide one firm’s insight on the markets. Not investment advice. See additional disclaimer here.
The ‘risk’ on a short position in the Dow (DIA), is yesterday’s high (not advice, not a recommendation).
It’s very early in the pre-market (7:48 a.m., EST), DIA is trading slightly higher (at 464.34), but anything can happen between now and the open.
Massive Margin Call
The Trillion Dollar margin call has to come from somewhere; maybe yesterday’s action in the metals and miners is going to force everyone’s hand.
Silver spiked, outside-down, on heavy volume.
With that said, on to the chart.
Dow 30 DIA, Daily
From a Wyckoff analysis standpoint, it’s all there; a push through resistance to all-time highs, a struggle, then new daily low and now today, a possible upside test.
The chart also shows an apparent volume climax, a typical ‘last gasp’ market action.
Note: Posts on this site are for education purposes only. They provide one firm’s insight on the markets. Not investment advice. See additional disclaimer here.
Both biotech funds, IBB, and XBI, are now in an up-thrust (potential reversal) condition.
In each case, the ETFs have pushed through a long-established trading range, straight into resistance.
The last update focused on less liquid IBB, because it was not known if heavily traded XBI, would push through its trading range (being the weaker of the two).
Since that initial update, both indices are now above their trading range.
Of course, what happens next is the question.
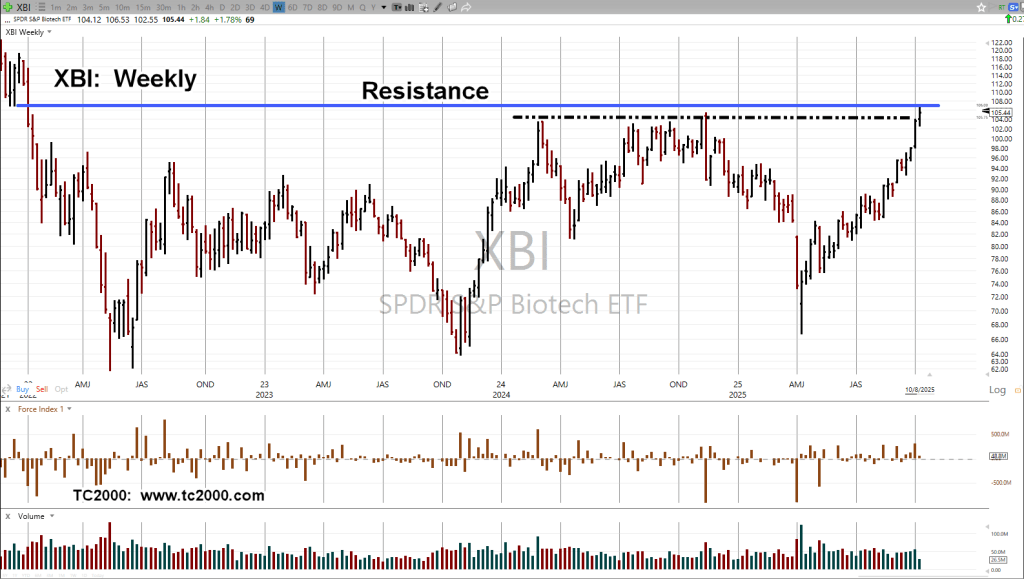
Biotech XBI, Weekly
The blue line is long established resistance.
The black dashed line is the top of the trading range and the up-thrust condition.
At this point anything can happen.
XBI, could reverse immediately or grind its way along, dissipate momentum, or even move higher.
We’re at the point where the risk of being wrong on a short position is least (not advice, not a recommendation).
Note: Posts on this site are for education purposes only. They provide one firm’s insight on the markets. Not investment advice. See additional disclaimer here.
Note: Posts on this site are for education purposes only. They provide one firm’s insight on the markets. Not investment advice. See additional disclaimer here.
Note: Posts on this site are for education purposes only. They provide one firm’s insight on the markets. Not investment advice. See additional disclaimer here.
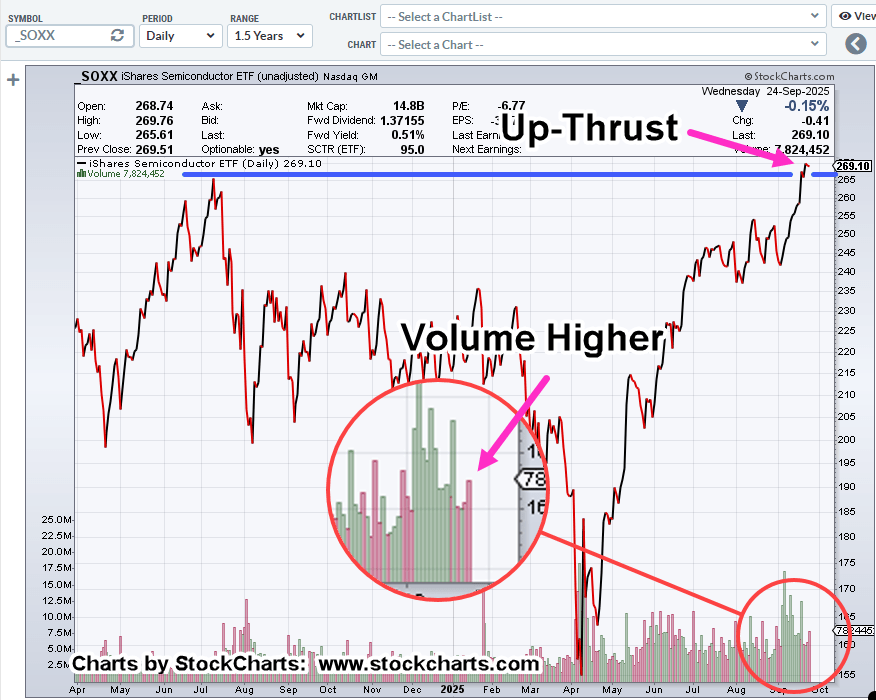
The last update, presented a case for the SOXX top, a proxy for A.I.
Note: If the SOXX, has made its final high, it’s still very early in the reversal:
Wyckoff said a century ago, ‘It’s as if the weight of a feather can move the market in either direction’.
That’s where we are now.
For biotech (IBB, XBI), different forces are at work.
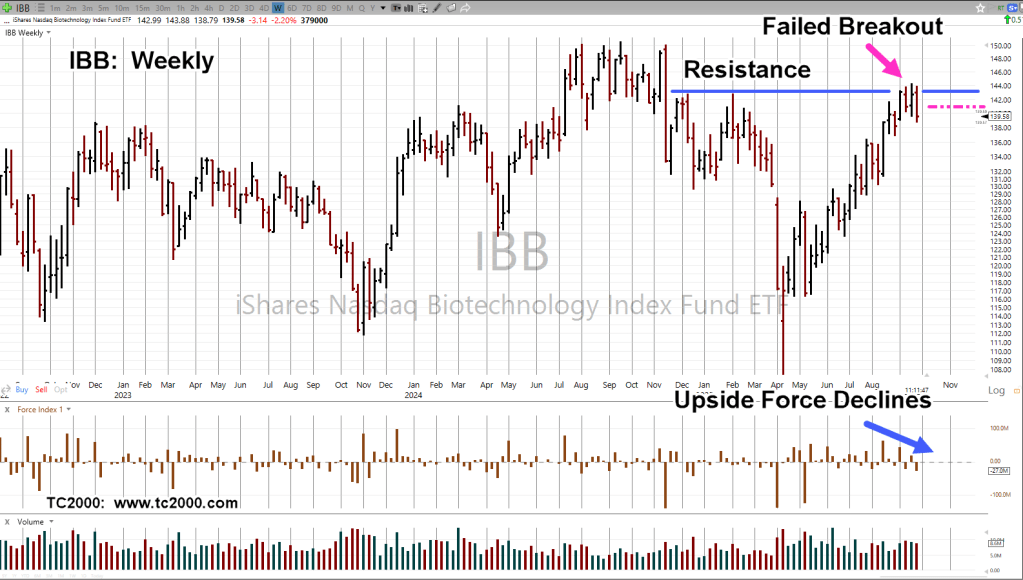
Biotech IBB, Weekly
The 38.2%, retrace from 9/19 high, to 9/25 low, is in the vicinity of 140.90 (magenta dashed line).
Fridays are typically biased to the upside.
There’s a possibility IBB, may test (upward) throughout the session, heading to (at or near) 38%, by the end of the day (not advice, not a recommendation).
Note: Posts on this site are for education purposes only. They provide one firm’s insight on the markets. Not investment advice. See additional disclaimer here.
Note: Posts on this site are for education purposes only. They provide one firm’s insight on the markets. Not investment advice. See additional disclaimer here.
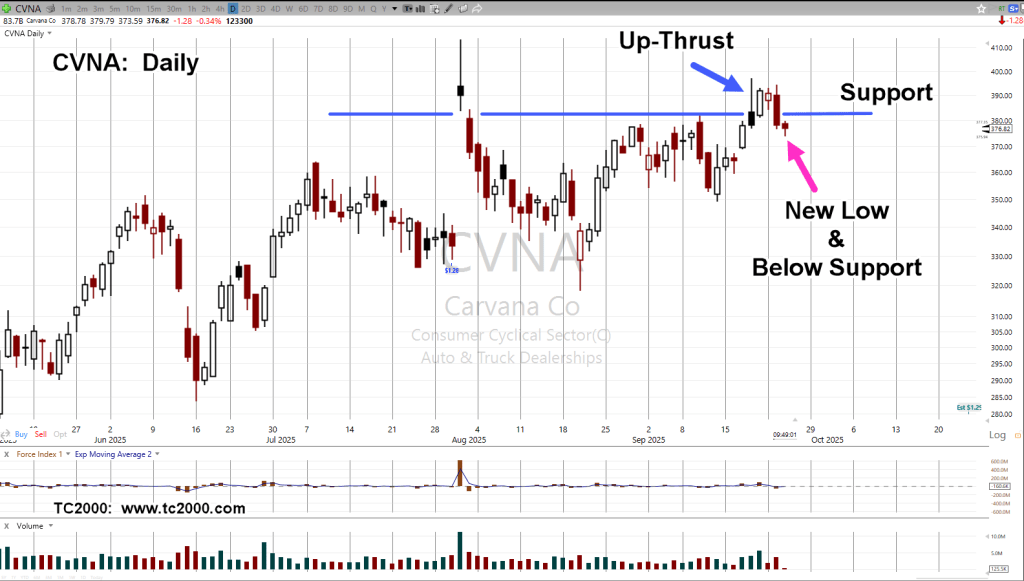
Yesterday, trading started above support, then, ended below.
Adding to that, price action was down on double volume from the prior session.
Volume study is part of Wyckoff analysis. It typically does not get attention as it’s boring, generating no ‘clicks’.
The increase in volume suggested pressure’s building to the downside.
Based on that, a (small) short was opened yesterday (not advice, not a recommendation).
Carvana CVNA, Daily
Short position is being maintained; stop to be moved at the end of this session to the day’s high (not advice, not a recommendation).
Other Markets
From the ‘notes’ discussion on yesterday’s post, the WMT position was stopped out (at essentially break-even) early this session (not advice, not a recommendation).
Price action looks like a secondary test of the reversal.
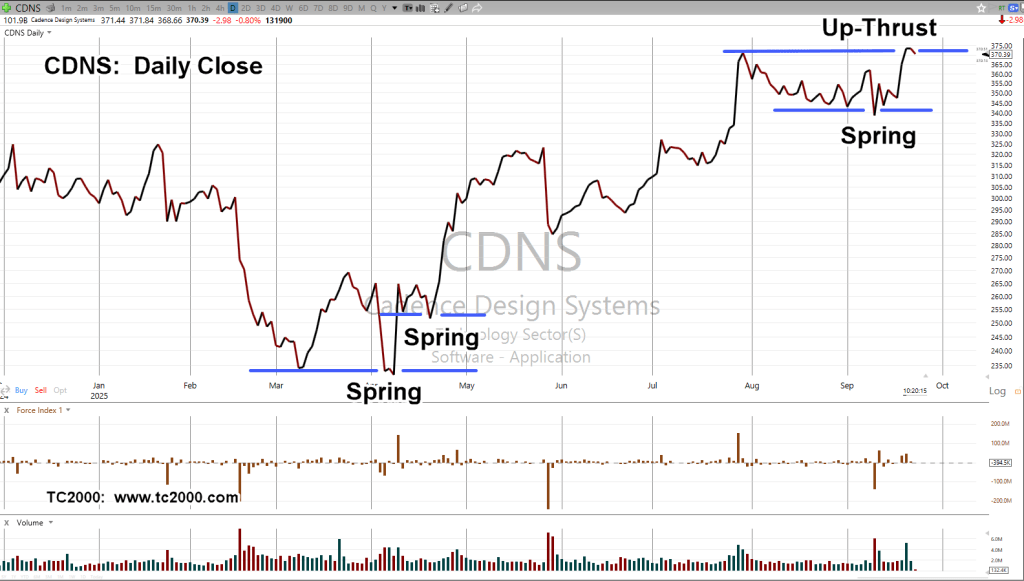
However, from a preference standpoint, the focus is on CVNA … and the SOXX.
Note: Posts on this site are for education purposes only. They provide one firm’s insight on the markets. Not investment advice. See additional disclaimer here.
Note: Posts on this site are for education purposes only. They provide one firm’s insight on the markets. Not investment advice. See additional disclaimer here.