Elliott Wave: American Tower

Paul Harrell likes to start his videos with:

‘The next twenty minutes are going be long and boring. You might want to skip to the end to see the conclusion.

His rabid and loyal fans then proceed to hang on every word of his self professed ‘boring anecdote’ until the very end.

Not saying this site’s in the same league as Harrell’s.

Just saying, the following is going to be a tedious discussion of American Tower (AMT) and how it just might be ready to start an Elliott Wave III, down.

Market Extremes:

Its been no secret. The markets are at price levels and valuations never before seen.

In this site’s opinion, going long anything, is insane.

There could be a break, upset, world event, container ship run aground (oh, wait…), cyber attack, volcanic eruption (oh, wait …), major earthquake, nationwide weather freeze (oh, wait…) food supply disruption (oh, wait…) bond bear raid (oh, wait…) currency devaluation, or any myriad of disconnects that would instantly change the dynamic.

Change the dynamic in such a way as to make low-risk long exit, or short positioning impossible.

This site has documented several times where major brokers have already gone off-line as a result of markets fluctuating to the upside.

What happens when it turns down? Good luck getting out.

Looking for the (short) entry:

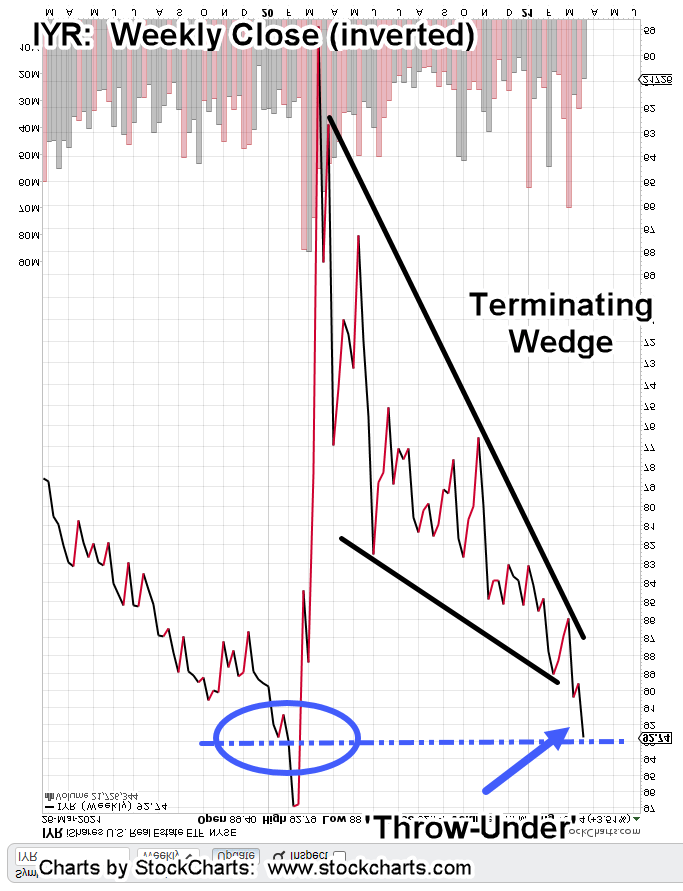
Its been an on again, off again, and back on again affair with shorting real estate, IYR. Anecdotal evidence such as Jerimiah Babe’s updates from his area, show the market’s been vaporized and is not coming back.

We’ve shown from a Point & Figure chart perspective, IYR has built significant price action congestion.

In Wyckoff terms, congestion equals potential.

The IYR index has built enough congestion that if/when the reversal comes, price action has potential to decline below the 2009, lows.

American Tower (AMT) Symmetry:

Now, for the analysis of AMT.

We’re going to start with the daily chart which has an interesting pattern of equal distance moves (or waves):

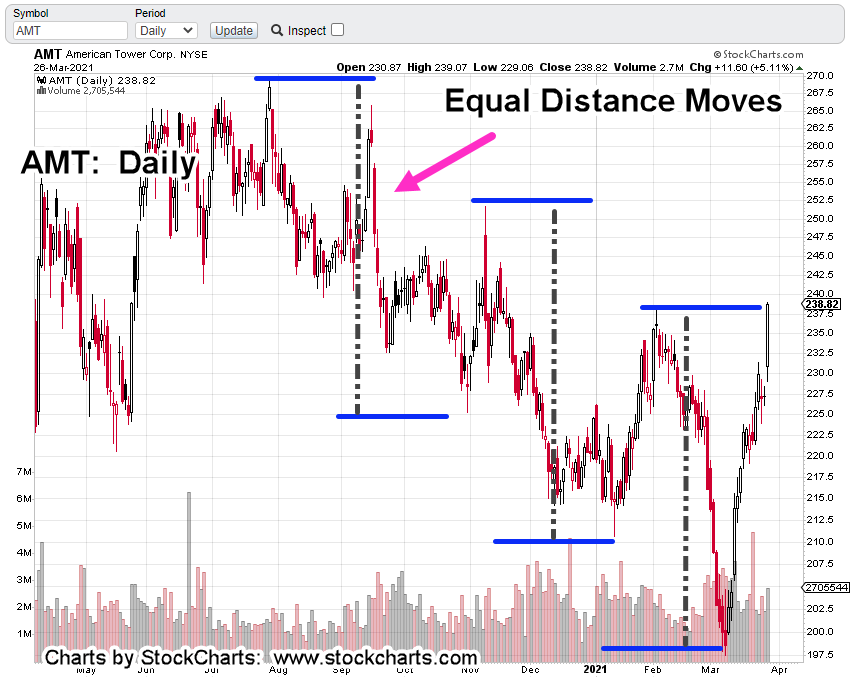
This equal move structure gives a hint that something’s up. The market’s moving in an orderly fashion. But what order?

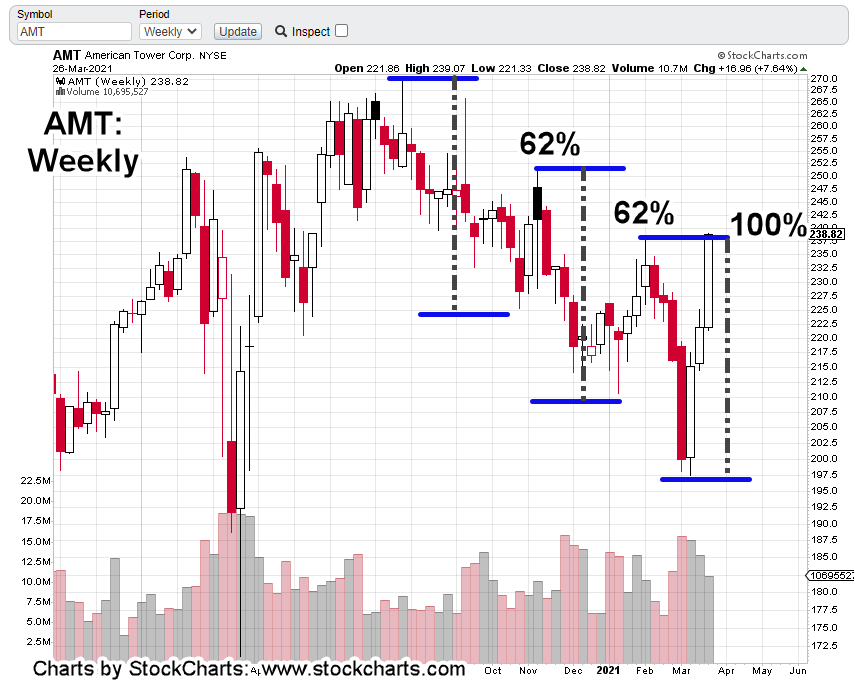
To add more intrigue, we’ll go to the weekly chart. We see each retrace of the two initial waves, was Fibonacci 62%.

The last retrace (up to Friday’s close) is essentially 100%.

Looking up Elliott Wave “equal waves” turns up this presentation. It helps some but does not cover the current situation. The take away from the video is that equal waves do occur.

Looking at the daily close chart of AMT gives us this:

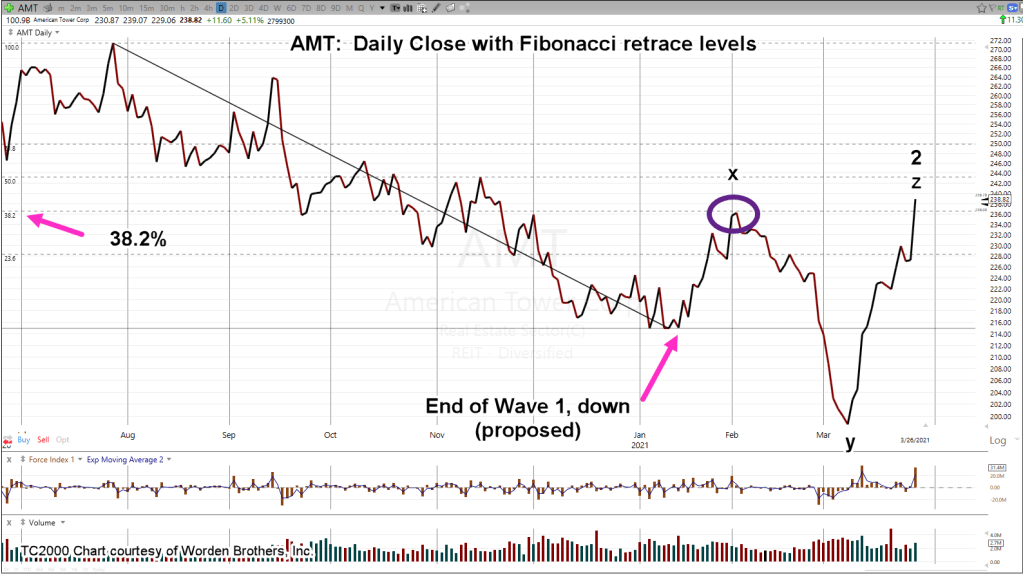
The Wave 1, down is placed at the low extreme. Price action then corrects to pivot (magenta oval) at the Fibonacci 38.2% retrace level.

It’s a near perfect retrace.

The reason to think AMT just finished a complex correction that terminated at “z” which is also “2”, is the structure of the fifteen-minute chart below.

The first chart is unmarked except where price action changes character:

Then we put in the Fib projection tool at that location; the inflection point, to get the following:

Incredibly, the top of Friday’s price action is also a Fibonacci target (423.6%) projection.

Getting back to the daily chart and labeling it using the above information gives us this:

Removing all but the labels is more clear:

There could be other ways to label the structure. It may become (very) apparent at the next open whether this interpretation is correct.

However, coupled with yesterday’s analysis of IYR, and its technical condition (at the extreme), we get the sense we’re close to some type of price action hesitation or outright reversal.

Summary:

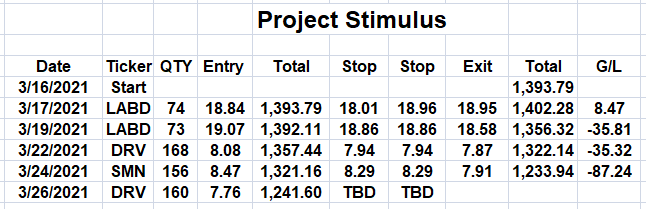
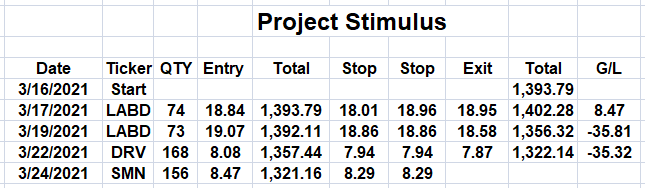
We’re short this sector via DRV (not advice not a recommendation).

Price action appears to be at extremes and is meeting Fibonacci and support-resistance levels simultaneously.

Not related but an interesting coincidence (maybe): Van Metre’s update on Friday night:

“Is This a Sign Real Estate Prices Have Peaked?”

The futures markets just opened … S&P down 7-points. Let’s see what happens next.

Stay Tuned

Charts by StockCharts

Note:  Posts on this site are for education purposes only.  They provide one firm’s insight on the markets.  Not investment advice.  See additional disclaimer here.

Early or Late?

It may have been Robert Prechter Jr. that said years ago;

‘You’re either going to be early, or late’

He then went on to say his trading method usually puts him in a little early on the move.

That means there are times when the anticipated direction does not materialize.

So, your either suffering through the pain of anticipated reversal (for seconds, minutes, or days), or you’re chasing the market.

You make the call.

There really is no other choice.

Both methods involve psychological pain.

Referring back to Prechter, he also said some of the best traders he knew were former Marines. By definition, they are well trained to deal with pain.

My former mentor, the late David Weis would say after hit on a set-up, if conditions warranted, he would enter again; as he told me, he would ‘stick his chin out’ and effectively tell the market to ‘prove him wrong’.

It was an interesting choice of words for him as one can see from his training video …. he had a distinctive chin.

Trading Style:

The trading style presented on this site is a combination of Wyckoff tape reading coupled with anticipating price action.

As inferred above, that means there may (and will ) be times of draw-down while working to enter a market reversal.

That’s where we are now.

Trade Actions:

Yesterday’s upward action in basic materials forced the ‘project’ out of its short (SMN) position. That sector may attempt to make a new 52-week recovery high before it’s ready for reversal.

Analysis: Real Estate, IYR

One market that did make a new 52-week high, setting up technically for a short, is real estate:

The weekly close of IYR has been inverted (turned upside down) to show the unique technical condition.

IYR has created a large terminating wedge that’s in the process of a ‘throw-under’. At times a market will attempt to breakout of a wedge in the opposite direction of eventual reversal.

This type of breakout tends to fail. Based on the dashed line contacting a prior congestion, there’s’ potential to at least hesitate in this area.

The daily chart below provides additional nuance:

It’s clear price action has contacted two prior areas of support – resistance during ‘throw-under’.

Anything can happen but it seems that IYR’s at maximum extension.

On Friday, IYR price action closed just 0.05-points off its high for the day. That high was also a 52-week high.

We’re now in a support-resistance zone.

If IYR is to move significantly higher, it might need additional fuel (a retrace lower) to break through.

Positioning:

The action then (not advice, not a recommendation) was to short the market via DRV.

Once again, the market itself is telling us where to go for opportunity.

Charts by StockCharts

Note:  Posts on this site are for education purposes only.  They provide one firm’s insight on the markets.  Not investment advice.  See additional disclaimer here.

Basic Materials

Nobody’s paying attention to this index. It may be one of the cleanest (technical) short opportunities.

Basic Materials. Sounds boring.

Sounds like fertilizer … and it is … right along with industrial chemicals.

Three largest cap in the sector are below:

Industrial gasses, Linde AG

Industrial gasses and chemicals, Air Products & Chemicals

Water purification, Ecolab

DuPont is next and then Newmont mining. So, this is a potential deflation play (Newmont) as well.

A post just out yesterday, Uneducated Economist does an excellent job destroying the inflation narrative.

Steven Van Metre has also repeated many times, we’re likely to get a deflation impulse first before inflation.

One of the most important things he’s said, the Fed is not going to correct the public’s (false narrative) perception that inflation’s the danger.

If everyone’s pointed in the wrong direction, and it serves their interests, why correct it?

Which brings us back to Basic Materials. ‘Nobody’s watching’ this index. How do we know?

Look at the inverse fund, SMN.

Russell 2000 inverse, TZA, averages 6 – 10 million shares per day. Compare that to SMN’s 2,500 shares on a good day.

Volume does pick up as price action becomes active. Some days will be 100,000 – 200,000 shares.

Looking at the technical condition, there are bearish divergences on both daily and weekly time-frames. The chart at the top shows a Wyckoff up-thrust (reversal) condition just tested yesterday.

The response is to go short via SMN (not advice, not a recommendation).

Since we’re actively managing accounts throughout the day, it’s not a problem to monitor SMN and the bid/ask of the fund when trading is light.

The ‘project’ table has been updated:

Pre-market has SPY trading down about -1.5 points or -0.40%. The expectation is for Basic Materials to follow suit.

Stay Tuned

Charts by StockCharts

Note:  Posts on this site are for education purposes only.  They provide one firm’s insight on the markets.  Not investment advice.  See additional disclaimer here.

Closer to The Break

With the kids at the card-table, freaking about ‘plunge protection team‘, rigged markets and Bitcoin, grownups the next table over, are planning their moves.

Friday’s late session rebound higher was not uncommon for a typical short squeeze.

These gyrations are intended to make sure only a select few are aboard when we get the break.

This idea is not new. You’ll find statements to that effect over and over in most any trading book.

The big difference now, is the amazing level of complacency and learned helplessness of the overall population.

Just one example of such before we move on to the charts.

Texas has opened up. Schools are about to go without diapers. Perish the thought.

Yet, there’s still a contingent that’s near hysteria about ‘safety’.

With all the information available, yes one actually has to do real research to find out what’s going on, huge segments of the population adamantly remain (intentionally) ignorant.

Unfortunately, that segment has voluntarily (at least in the U.S.) lined themselves up to be taken out; financially as well as physically.

Just a few of the most recent links, here, here, and here.

At some point, those links are going to become common knowledge.

Hopefully, there will be long lasting and certain retribution for the perpetrators. However, for those who ‘volunteered’, it’s already too late.

Now, on to the markets.

Friday’s real estate rebound (IYR) looked like short-squeeze action.

In response to that and late in the session, short position DRV (3X inverse IYR) was increased at price 9.37 (not advice, not a recommendation).

Volatility is still low in IYR. Short positions can be increased with less risk.

The Big Break

When and if the break comes, it’s likely to be fast; no time to plan.

Whatever plans one has should’ve been laid out well ahead of time.

Two markets being watching closely are Peabody Energy (BTU) and Seabridge Gold (SA).

By now everyone’s aware that a certain far east country is going about its business and building their infrastructure … as if nothing had ever happened. Funny that.

Conversely, the coal market has bottomed out and so has Peabody.

On top of that, the Texas Freeze laid bare the farce that is climate change, global warming and green energy.

Quietly, without fanfare, coal is seeing increased demand.

The blue arrow is a gap in trading that could be filled.

To do that, there might have to be a massive market collapse, pushing BTU back to that level … if only temporarily.

Huge volume in the past six months shows that somebody’s buying.

The next market is Seabridge Gold (SA) which is being watched for essentially the same reasons. If Van Metre is right and we’re in a deflationary impulse, the entire public’s on the wrong side of the trade.

If SA can get itself below 13 – 14, it then enters free-fall territory.

If that happens, as with BTU, it too might be a short lived event.

Positioning:

Currently, the firm’s position (not advice, not a recommendation) is short biotech and real estate via LABD and DRV, respectively.

If BTU and SA get to extreme lows, both of them have potential for a ‘ten-bagger’, the possibility to gain over 1,000%.

Getting to such gains would necessitate a change in the current strategy of trading, to buy and hold.

Summary:

Pressure seems to be building for some unexpected event that would cause a market break; Possibly the devaluation of the Yuan as discussed by Steven Van Metre.

If that’s going to happen it’s likely to be soon.

Stay Tuned

Charts by StockCharts

Note:  Posts on this site are for education purposes only.  They provide one firm’s insight on the markets.  Not investment advice.  See additional disclaimer here.

Changing Hands: Bonds

The financial press is rolling out the usual suspects; bonds yields are going stratospheric and hyperinflation’s just around the corner.

A more likely view, one that’s actually based on reality, the price action itself, bonds just changed hands; from weak to strong.

Those selling or going short bonds (weak hands) at this juncture are potentially left holding the bag in a big way.

Taking a trip back in time to Livermore’s day (Reminiscences), he stated time and again, the large speculators could not enter or exit their positions at will.

They needed to have some kind of ‘event’ with heavy volume so that it would mask their moves.

It looks like we just had such an event.

The weekly chart of TLT, shows two major volume spikes. One where bonds reversed lower and now … a potential reversal to the upside.

We’re dealing with probabilities and over two-hundred years of market activity (since the Buttonwood tree).

Huge volume spikes have significance. They typically signal a pivot or the start of one.

Using that reasoning, we may have seen confirmation of rotation not only in bonds but the markets themselves; The S&P, Dow, Nasdaq are pivoting lower, with bonds and the dollar reversing higher.

Summary:

The futures market opens in a few hours. It’s typically a light-volume affair for bonds.

At times, Steven Van Meter presents in his updates how bonds have been typically slammed lower in the overnight.

That type of action has been going on for months. We’ll be looking to see if there’s a change of character.

Stay Tuned

Charts by StockCharts

Note:  Posts on this site are for education purposes only.  They provide one firm’s insight on the markets.  Not investment advice.  See additional disclaimer here.

Real Estate: Downside Targets

IYR has reversed with a decisive ‘outside-down’ week.

This sector has likely seen its highs for the year and probably its all-time (recovery) highs.

The latest news from Steven Van Metre does not paint a good picture for the economy or the markets (bonds excepted).

Jerimiah Babe (J.B.) has also posted an update on Los Angeles. It’s a human and economic tragedy. Unfortunately, this is where the Cadillac has gone off the cliff.

We’ve continually held to the stance, there’s no recovery.

The “recovery”, is a mainstream narrative intended to keep the herd focused in the wrong direction and on the wrong things.

Judging by the hysteria with small cap short squeezes, physical silver and bitcoin (kind of hard to access when the power goes out), the promulgator to the proletariat, the mainstream media, has done an excellent job.

In fact, that is their job.

Interest rates might only need to stay elevated for a short while (a few weeks) to completely choke off any semblance of economic activity.

After that, collapse is likely to feed on itself. Even if rates eventually go back lower, it’ll be too late. The juggernaut has been set in motion.

This week had IYR posting outside-down. That in turn, added a print to the P&F chart which helped to complete a downside forecast.

Reaching the target levels puts IYR below all recent support. That support would then become resistance for any upside counter-trend action.

Ultimately, we’re looking for IYR to go below 2009, lows.

If that happens, it could take months or years. P&F charts are independent of time. They only show potential.

As provided in earlier updates, my firm is positioned heavily short IYR via DRV (not advice, not a recommendation).

From here and depending on market action, the plan is to increase that short until volatility prevents further, low risk entries.

As always, anything can happen and next week could be a miracle reversal. If so, we’ll assess price action at that time.

Stay Tuned

Charts by StockCharts

Note:  Posts on this site are for education purposes only.  They provide one firm’s insight on the markets.  Not investment advice.  See additional disclaimer here.

Bonds On An Island

If bonds (TLT) finishes the day essentially where it started, it will have printed an island bar on the weekly chart.

Bonds (TLT) are currently trading in the pre-market around 144.15 – 144.65.

If trading stays in that tight range, with the technical conditions shown below, TLT may set up for a Monday gap-up reversal.

The potential island gap is shown on the weekly chart:

The part that’s not so noticeable on the bar chart (above) is better displayed on the weekly close chart:

TLT is right at established support.

To borrow Steven Van Metre’s assessment, with all the selling and the extremes in short positions taking place over the past six months, bonds have only been able to retrace to well known support levels.

Trigger events have a nasty habit of happening over the weekends.

That’s when the largest number of participants can be trapped with no escape. It’s how the game is played.

The island-gap weekly bar may not happen. Bonds could reverse (or collapse) during the up-coming session.

However, successful participation in the markets requires awareness of what could, or what’s likely to happen … before it does.

Stay Tuned

Charts by StockCharts

Note:  Posts on this site are for education purposes only.  They provide one firm’s insight on the markets.  Not investment advice.  See additional disclaimer here.

Evidence of a Top: IYR

Losing power with each attempt to move higher.

The daily charts show it’s clear there’s no more energy left to lift prices significantly higher.

Zooming in on the daily (below), momentum dissipation is evident:

Yesterday’s update said unless IYR posts a new daily high, it’s in reversal.

Price action came back late in that session to close the opening gap … but there was no new high.

The sector’s a juggernaut. When it reverses for good, downside action is likely to be as persistent as the upside.

In other but related markets, the dollar continues its upside reversal while gold and silver continue the downside.

The island gap-trap in silver, has now entered the disillusionment stage.

Retail ‘traders’ disillusioned about getting some tip in a widely followed ‘chat room’ that’s somehow going to make them rich by making only one decision (go long) and having little, or no experience.

Prechter said it well years ago: ‘Be sure to lose your fortune(s) early in life, so you have time to recover.

Even Van Metre’s getting heat and losing subscribers; the bond market’s not providing the necessary ‘good feelings’ for the inexperienced crowd to maintain a position longer than a few blips on the screen.

No matter the market, whether it’s bonds, gold, dollar, or real estate, the big money’s in the big move.

The most frequent condition of the market professional is one of ‘discomfort’.

If you need it, here’s a good source for help on mastering the emotions necessary to be consistently successful in the markets.

Stay Tuned

Charts by StockCharts

Note:  Posts on this site are for education purposes only.  They provide one firm’s insight on the markets.  Not investment advice.  See additional disclaimer here.

CORN: Breakout Ready

Price action in futures tracking fund CORN, is congesting in a tight range; ready for breakout to the upside.

This is not about inflation.

Frequent visitors to this site already know the entire food supply chain, from field to market, is being systematically destroyed.

Probably the best source of documentation is at ice age farmer.

For years, ‘ice age’ has been reporting step by step plans and events in place to choke-off food production and distribution.

Digressing for just a bit: The firm managing this site, presenting its analysis of markets and corollary events, is constantly searching for additional information or new data sources.

If a new market analysis (or other news) source is located, then that ‘source’ says there’s food price inflation because of dollar devaluation, it’s eliminated as being reliable or aware of actual events: DONE.

At this point, everyone should know exactly why food prices are rising.

Whenever we get the next ‘Black Swan’ event, there’ll be no time to vet out information sources. That should’ve been done long before there’s another market or world upset.

The recent Game Stop (GME) event may just be a blip; a side detour in the overall plan.

Van Metre calls the whole short squeeze “brilliant”. So it was.

We can rest assured, that hole in the dike (a proletariat uprising) will be plugged ‘tout de suite’.

Food is the key. It’s the choke point. End of digression.

Getting back to CORN. Price action may congest more before a sustained breakout. There may even be a head-fake to the downside to flush out any weak longs.

From an investment or trading standpoint, price is at the point where political events could cause action to become unreliable … think Jimmy Carter and the grain embargo after the Russians (Soviets at that time) invaded Afghanistan.

It’s the trader’s discretion whether or not to position long.

My firm’s action is to be aware of price and use it as a proxy for up-coming events.

Stay Tuned

Charts by StockCharts

Note:  Posts on this site are for education purposes only.  They provide one firm’s insight on the markets.  Not investment advice.  See additional disclaimer here.