Note: Posts on this site are for education purposes only. They provide one firm’s insight on the markets. Not investment advice. See additional disclaimer here.
Note: Posts on this site are for education purposes only. They provide one firm’s insight on the markets. Not investment advice. See additional disclaimer here.
“What we’re looking for here, is some kind of Jimmy Carter type stunt where corn exports are halted in the name of ‘national security’ or some such thing.”
Corn Tracking Fund CORN, Weekly
Two Fibonacci projections are overlaid on the chart.
First, a simple retrace starting near ‘Derecho’ lows, to highs set during the week of April 29th, 2022.
Second, a counter-trend projection from those highs to the intermediate lows set during week of May 19th, 2023 and highs of June 23rd, week, the same year.
CORN has retraced 61.8%, which is also the 1:1 counter-trend projection. In addition, it’s the measured move from the wedge break.
The market has effectively confirmed the support area.
Oil Goes Negative … And Corn?
Remember that ‘anything can happen’. Oil futures made history by going negative.
We’re in a new construct, a new paradigm, our strategy should match accordingly.
Everyone has their own perspective and plan for the markets; fair enough.
From here, CORN could continue to new, all-time highs.
However, for my accounts, I’ll wait until such time it appears the downside risk is removed as much as possible.
One potential area for that ‘removal’ is the 76.4%, retrace in the vicinity of CORN @ 16 (not advice, not a recommendation).
Note: Posts on this site are for education purposes only. They provide one firm’s insight on the markets. Not investment advice. See additional disclaimer here.
If it’s not behaving as expected, then it’s obviously doing something else.
In the case of biotech XBI, that something else, may be working its way to the next set-up.
Strategy First
Until price action proves otherwise, the overall long term reversal assessment of the sector has not changed (not advice, not a recommendation).
We’ve had a potential long-term up-thrust (reversal) that’s been covered here, and here.
That second link contains a 3-Day chart analysis.
Looking at the current price action and having it dictate what chart to use, we’ll switch to a 2-Day, which shows the potential more clearly.
Biotech XBI, 2-Day
The sector has failed to break below support in the 92 – 93, area. Instead, it has decided to bounce in what looks to be a possible minor spring-to-up-thrust.
We can see there’ve been two ‘hits’ on the upper resistance line. One, immediately after the up-thrust breakdown and one later … 4-bars later.
These hits essentially confirm the area, in effect, setting it up for potential penetration.
One has to think about where the stops are located.
If I was short this sector (I have been, but not currently), where would I place my stop?
Naturally, I’d put it right above the resistance (blue) line, exactly where everyone else has put theirs 🙂
Years ago, Martha Stokes wrote an update on why everybody gets stopped out of their trades, paraphrasing from this link:
‘The Market Makers don’t know you are there; they’re not interested in your tiny little stop order.
If your order does get taken out, it’s because too many small traders put their stops at the same location.
There’s an order imbalance. The market’s response is essentially automatic … take out the stops.’
With that, let’s see what happens next.
There’s no guarantee XBI, will penetrate the resistance area but if it does, we won’t be surprised.
Note: Posts on this site are for education purposes only. They provide one firm’s insight on the markets. Not investment advice. See additional disclaimer here.
Note: Posts on this site are for education purposes only. They provide one firm’s insight on the markets. Not investment advice. See additional disclaimer here.
Bridge in Baltimore collapses after container ship strike; major port is ‘paralyzed’.
Harvard to screen a movie about blowing up pipelines, and then:
Nat-gas rachets down; volatility is low, all quiet, for now.
Strategy First
It’s been almost a year since the first post, discussing the potential for a disruption to the nat-gas supply.
A lot of things have happened since then.
For example, large speculators have likely been forced-out of the UNG, proxy. Quoting from the link above, August of last year, we have this:
“If everybody’s ready for it … it won’t happen at all or not when it’s expected to happen.”
So, the crowd and the crowded trade, is probably gone.
Then, we have continuing infrastructure disconnects, like the bridge collapse above, the aviation sector, and cattle (the food supply), to name just a few.
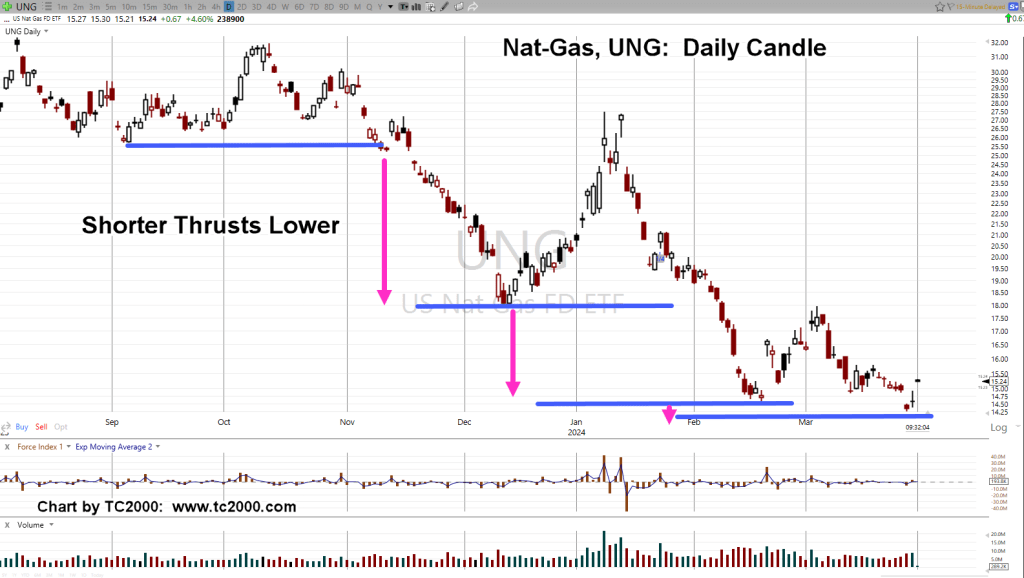
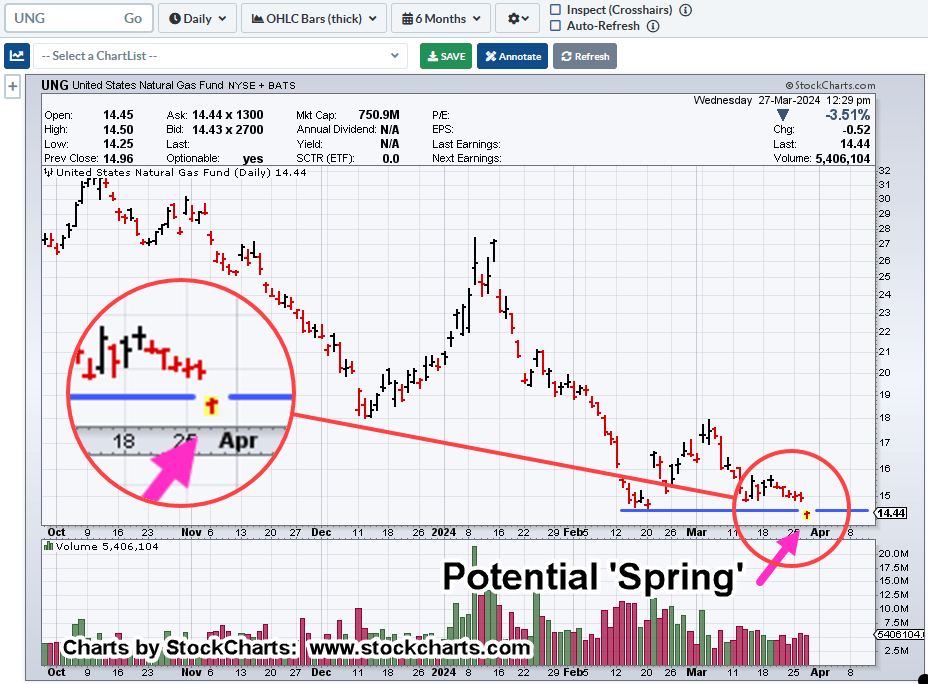
Looking at the weekly of UNG, with Force Index (lower panel), we see downside pressure is dissipating.
Natural Gas UNG, ETF, Weekly
Weekly thrusts lower, have less energy (magenta arrow)
In addition to weakening downside force, the weekly range is also becoming more narrow (blue arrow).
So far, there’re no signs of increased demand, and UNG can continue on its way to lower levels.
However, we’re already at multi-year lows; indicating, with each net downside move, downside risk is also being reduced (not advice, not a recommendation).
Note: Posts on this site are for education purposes only. They provide one firm’s insight on the markets. Not investment advice. See additional disclaimer here.
Right along with the current narrative, ‘The Fed’s going to cut rates’, is another narrative, ‘The Fed’s in charge, a leader, and sets rates’.
Is either one, actually true?
Years ago, Robert Prechter Jr. pointed out very convincingly, the Fed’s a follower, not a leader.
His research showed, over many years, the Fed consistently follows the market.
Along with that, was his premise, ‘The market leads the news, not the other way around’.
Using that, we’ll look at what the Fed’s likely to do next; let’s use the long-term view, the 10-Year Treasury.
What’s it telling us?
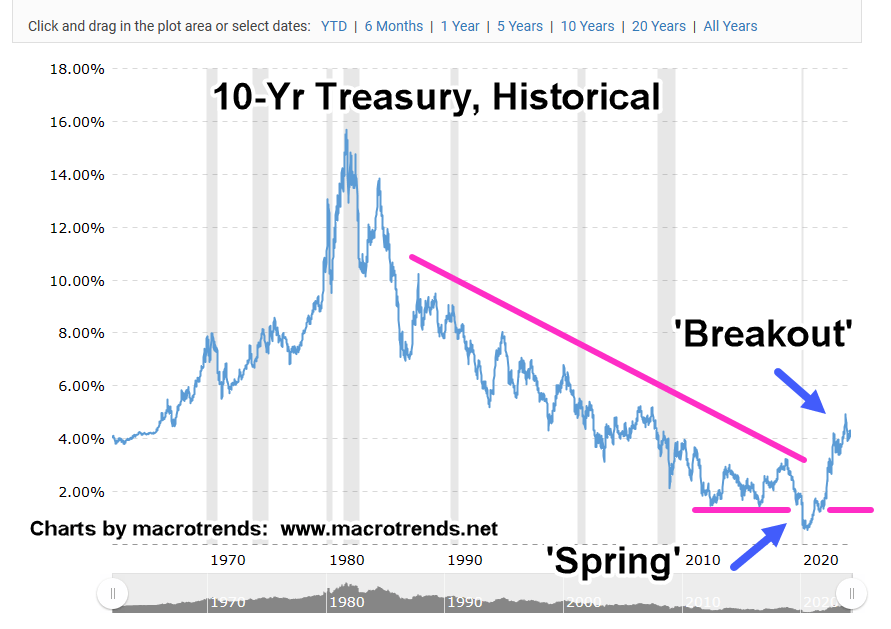
Macrotrends Historical Chart: Ten Year Treasury
As posted in the prior update, the 40-yr bond bull market, i.e., lower rates, is over (not advice, not a recommendation).
We see the upside reversal in rates (downside for bonds) took over 10-years to set up.
Rates pushed below established support into a Wyckoff spring condition, then reversed higher, then into an outright breakout.
Currently, we’re hovering around in ‘no-man’s land’.
Could rates dip lower (bonds higher) and we get a token rate cut in response from the Fed?
Well, as David Weis used to say, ‘Anything can happen’.
Strategy First
However, from a strategic standpoint and for the long-term, higher rates are more probable.
The market has already responded with interest rate sensitive sectors and stocks (IYR, KMX, CVNA, etc.), having peaked long ago, in 2021.
A Dangerous Game
Depending on one’s perspective, what’s going on here with interest rates, is a dangerous game of ‘chicken’.
As Uneducated Economist puts it, the Fed’s a ‘credible threat’; all they have to do is ‘talk’ and propose (i.e., threaten) to move rates and the market responds without the Fed actually doing anything.
It’s working, for now.
The Emperor Has No Clothes
The problem is, as Prechter has already shown with research done years ago, ‘the emperor has no clothes’.
The Fed does not control rates at all; it’s a follower, only doing what the bond market’s telling it to do.
For some reading this, it’s old news.
For others, it’s a shock to find out, yet another institution is not what you thought it was.
Note: Posts on this site are for education purposes only. They provide one firm’s insight on the markets. Not investment advice. See additional disclaimer here.
YouTube content creators have noticed the public’s inability, refusal, and denial to recognize (or accept) the truth:
Michael Bordenaro; ‘everybody’s so weak, so sensitive, they can’t handle the facts.’
Patera, Appalachia’s Homestead; discussing her lineage (Cherokee) and history, seeing the similarities of today, applying the lessons; some are more concerned about her hair and makeup.
Then, Uneducated Economist; ‘no amount of wishing is going to bring events back to the way it was. It’s effectively a new construct.’
Interest Rate Ruse
The 40-year bull market in bonds is over; rates are not going lower, they’re going higher (not advice, not a recommendation).
Ignoring or refusing to recognize this (highly probable) truth when analyzing markets, is a potential strategic error.
The longer the ruse goes on, the more violent the reaction may be when the masses (finally) ‘awake’.
All of which brings us to biotech, XBI, SPBIO, $SPSIBI.
Biotech Truth
Truth about biotech is brutal; described here, here and here.
Exactly how this will all hit the mainstream in force, is unknown. However, let’s not forget, ‘when price action goes south, bad news comes out’.
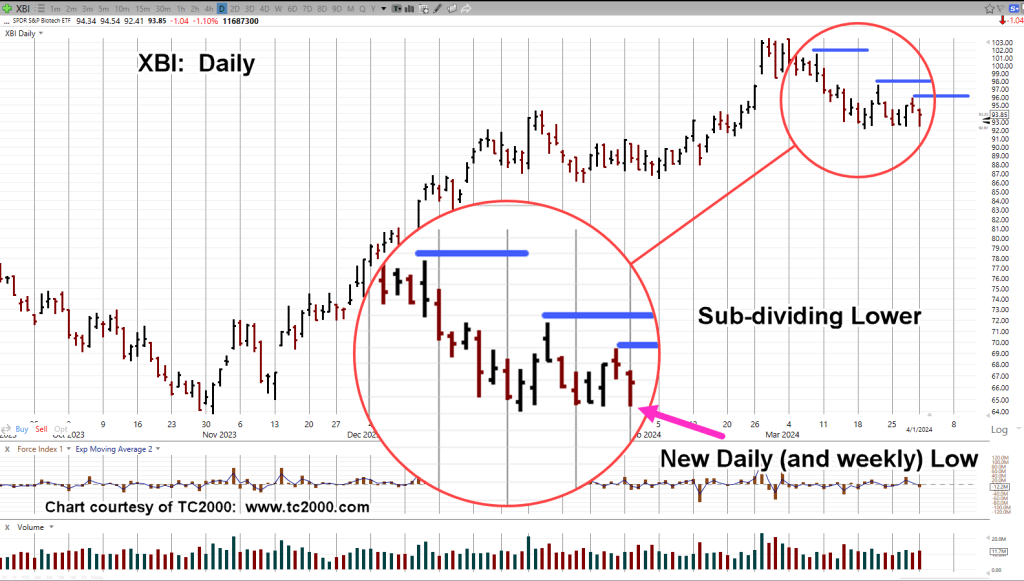
Biotech XBI, Daily
Heading south at this point, is biotech XBI.
Market test of the Wyckoff up-thrust (reversal) appears complete; previously discussed here, here and here.
As of 1:40 p.m., EST, XBI is trading back into congestion (92 – 96) and looks to have formed a trading channel.
Left channel contact line shown as No. 1, is supported by this post, potential long-term reversal.
Note: Posts on this site are for education purposes only. They provide one firm’s insight on the markets. Not investment advice. See additional disclaimer here.
The financial press will always come up with some kind of ‘reason’ why the markets went up or down.
However, getting to the truth of price action is sometimes boring and also requires a focused amount of thinking.
That thinking requirement, puts it ‘right out‘ (as the Brits would say) for any kind of media consideration. 🙂
Therein lies the opportunity; case in point, biotech, XBI.
The sector did not move higher today as a result of any type of ‘good news’ for potential rate cuts; cuts that so far have yet to materialize (waiting now, for over a year).
No, XBI went higher today to ‘test’ the underside of resistance after its own break through that resistance.
Biotech XBI, 3-Day
As stated in the prior update, it’s going to take some kind of extra demand to get the sector back to bullish.
For now, it’s right below resistance and testing.
Obviously, what happens tomorrow, is important.
If we’re in a test, and not a new leg higher, the expectation is for very limited upside price action … if any.
Note: Posts on this site are for education purposes only. They provide one firm’s insight on the markets. Not investment advice. See additional disclaimer here.
Note: Posts on this site are for education purposes only. They provide one firm’s insight on the markets. Not investment advice. See additional disclaimer here.