Note: Posts on this site are for education purposes only. They provide one firm’s insight on the markets. Not investment advice. See additional disclaimer here.
In our example above, the commentor said their family survived in part, because they had “100kg of salt”.
That amount equates to about 220 lbs.
Converting 1oz gold for (roughly) 18-oz. salt, at today’s gold prices, is about $392,000 ‘worth’ of salt.
When they came out other side, the salt may have been gone, but they had the gold. 🙂
Now, moving on to the chart.
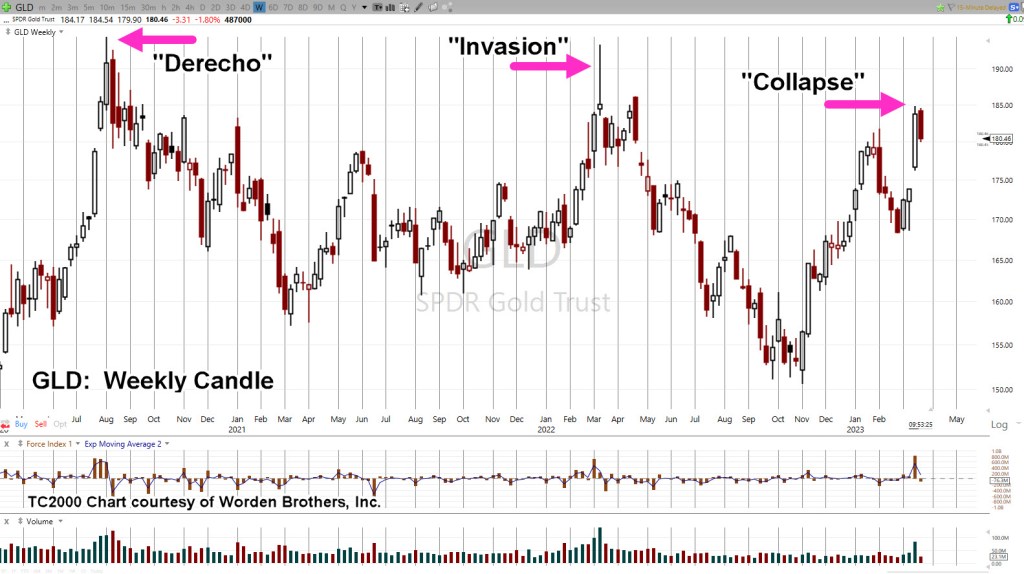
Gold (GLD), Weekly
Gold is at a critical juncture.
We’re either in a potential ‘throw-over’ on the wedge formation (with reversal) or about to pressure higher into all-time highs (not advice, not a recommendation).
We see a rising (terminating) wedge, along with a decline in volume (thrust).
We’re at The Danger Point®
Gold’s price action does not need much of a push to go either way.
Then, The Dollar
Recall, from the dollar update (link here), there’s a possibility for it to decline from current levels; potentially setting up a Wyckoff spring condition.
A dollar decline would naturally provide a likely correlation for gold rising into new all-time highs.
If either one happens, there’s probably going to be panic.
Note: Posts on this site are for education purposes only. They provide one firm’s insight on the markets. Not investment advice. See additional disclaimer here.
Before we even get started, let’s take a look at the last time there was this much dollar ‘collapse’ hysteria.
The update at this link, shows the analysis of what was likely for the dollar during the previous round of hysterics.
That was over two-years ago and in itself, highlights the ‘strategic’ nature of the analysis presented on this site.
The UUP (dollar index) chart is re-printed below and shows the location of the ‘reversal’ update.
Dollar UUP, Weekly
That was then; so, let’s move on to what could happen at this point in time.
The chart below shows three potential scenarios based on current price action and location.
No. 1
The dollar rallies from here; moving on to test the highs.
No. 2
The dollar continues lower, tests or penetrates the prior lows, then rallies in a Wyckoff spring to the highs and potentially higher.
No. 3
We really do get a collapse.
The dollar breaks the support area, comes back to test the underside and then heads lower.
Hysteria In … Hysteria Out
Of the above three scenarios, which one is going to create the most media hysteria?
A better way to ask the question, which scenario would be the most profitable for those entities that ‘control’ (manipulate) this market?
If the dollar is still in an uptrend and this is just a pull-back, then Scenario No. 2, would likely be the most profitable.
Played Like A Fiddle
Remember, the general public is being played like a fiddle.
The recent and on-going mass exodus from the small banks to the larger ones right into the potential CBDC trap, is a good case in point (not advice, not a recommendation).
So, it could be as well for the dollar in Scenario No. 2
If the dollar heads lower and manages to penetrate support, there’s likely to be media pandemonium.
That would go right along with YouTube grifters losing their minds … all the while, getting those important ‘clicks’.
If it happens, that would be a fantastic, potential set-up for a short-covering rally.
Note: Posts on this site are for education purposes only. They provide one firm’s insight on the markets. Not investment advice. See additional disclaimer here.
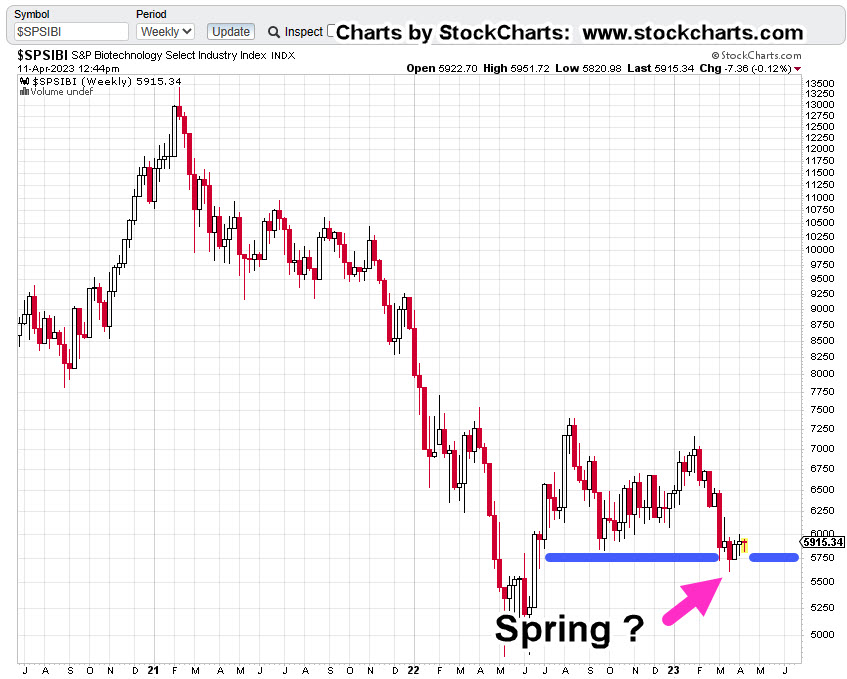
The biotech sector’s (upside) correction is complete.
If that’s correct, it’s likely to get very serious to the downside (not advice, not a recommendation).
A massive list of fundamentals, i.e., ‘side effects’, have been documented on this sector’s reprehensible behavior (saying it politely) over the past three years.
‘The List’
From here on out, we’ll call the linked information that follows, ‘The List’. So, we have The Biotech List, linked here, here, and here.
In the past few days we can add more items to the list, here, here and here.
When The Money Runs Out …
Now, it looks like the money (and ‘patient’) spigot is running dry as reported here.
So, let’s see how that’s working itself out for chief cook and bottle washer; biotech, SPBIO.
As usual, we’re looking at 3X, leveraged inverse fund LABD.
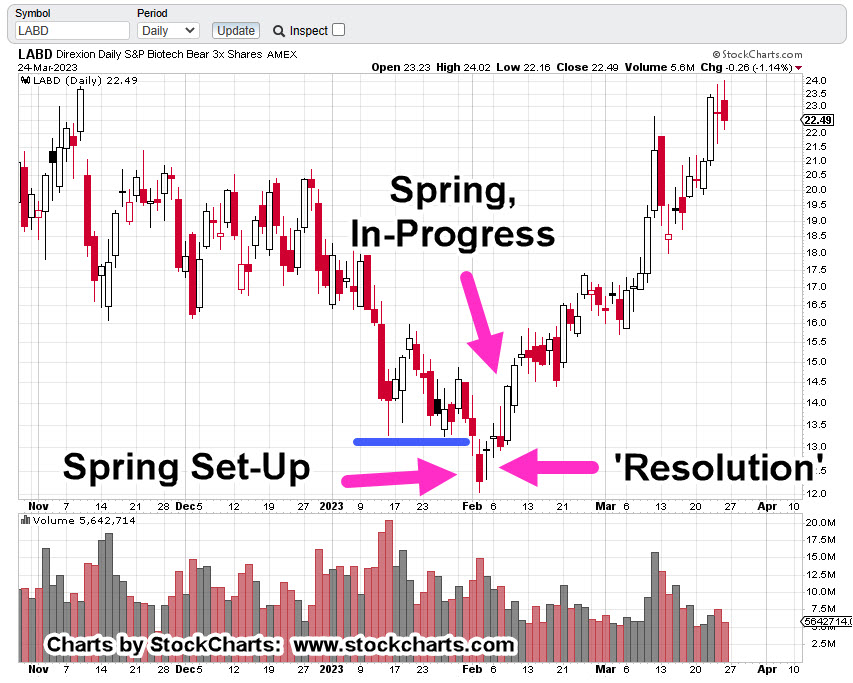
SPBIO, Leveraged Inverse LABD, Daily
Sharp reversal to the upside.
We’re nearing the end of today’s session (2:55 p.m., EST) and price action has been relentless.
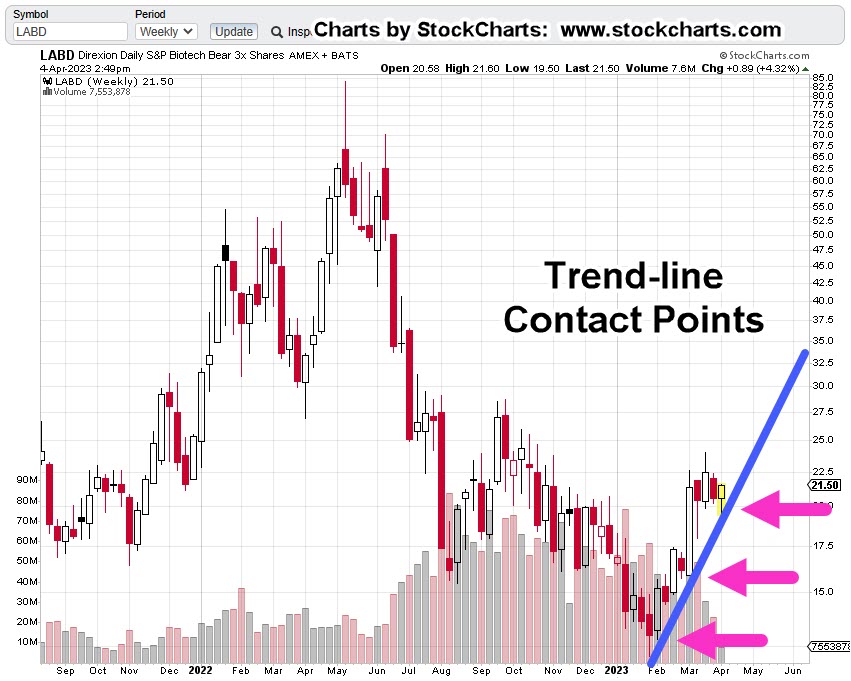
Looking at the weekly chart of LABD, we see the trendline being confirmed.
Biotech Leveraged Inverse LABD, Weekly
A reasonable expectation for the next session(s) is some type of back testing of today’s action … although it’s not required.
Positioning
Yesterday’s downside LABD, action forced the complete exit of the main position that was (in-part) established during the downside thrust on February 2nd.
Overall profit gain on the series, was just over + 44%.
So, we had partial exit with +37%, main exit with +44%.
Later in the session yesterday, it became obvious the downside correction (from March 24th) may be nearing completion; the main position was re-established @ LABD 20.27 (not advice, not a recommendation).
Today’s action puts that entry well in the green.
If this really is the next leg lower (higher for LABD), the expectation is for significantly increased volatility.
Note: Posts on this site are for education purposes only. They provide one firm’s insight on the markets. Not investment advice. See additional disclaimer here.
Until price action proves otherwise, each increase in bond price (decrease in rates) is going to be viewed on this site, from a bearish perspective.
That’s not to say bond prices won’t go higher. Counter-trend moves can be trading opportunities.
However, with market blow-ups, internet and broker outages the norm (think, SVB), taking a position against the overall main trend, is not something you’ll typically find presented on this site (not advice, not a recommendation).
With that said, let’s look at where the long-bond proxy TLT, is at this juncture.
Long Bond TLT, Daily
The chart may be hard to read but it shows the entire move lower from the all-time high posted on March 9th, of 2020.
The magenta arrow and bar is the Fibonacci 23.6%, retrace.
That’s where we’re focused on the chart below, an expanded version of the daily.
The potential set-up is obvious.
If price action breaks out of the (orange) wedge pattern into a measured move, it would retrace to the Fibonacci 23.6%, level, while at the same time, getting itself into Wyckoff Up-Thrust (reversal) position.
The up-thrust would be created if/when price action pushes above the known resistance area shown as the horizontal blue line.
The Danger Point®
If price action moves into the set-up area as shown, TLT would be at The Danger Point®
This is an area of instability.
At that point, it does not take much force to move the action in either direction, hence the name.
Strategy
As this post is being created, a quick check of ZeroHedge turns up this article, just released.
The article makes the statement as well, the bond bull market is over and uses the 10-yr Treasury to show the upside (yield) breakout.
The bottom line:
We’re in a highly dynamic environment where the typical money manager, financial advisor (as reported by Neil McCoy-Ward) finds themselves “clueless”.
If ever there was a point in time to focus exclusively on what price action is telling us using Wyckoff analysis, this is the time (not advice, not a recommendation).
Note: Posts on this site are for education purposes only. They provide one firm’s insight on the markets. Not investment advice. See additional disclaimer here.
Unbeknownst to many, we’re witnessing a once-in-a-century opportunity and public service.
Those from the era of The Great Depression, are all gone now.
So, the same playbook can be run without anyone (alive) knowing we’ve been here before.
The public service presented to us, the massive on-going exposure of the financial charlatans and grifters.
You can be ‘certified’ and still be a certified (market) dolt.
Neil McCoy-Ward, points this out in his recent update linked here. Go to time stamp 8:40;
“Clueless” … “Completely Asleep”
Anyone who’s worked in the corporate world (in any sector), especially now, knows it’s near impossible to think or act independently.
So, it is with gold.
Gold & The Grifter Bandwagon
Where was everybody back in 2001, when gold was bottoming in the area of $270/oz., after a multi-decades long bear market (from 1980)?
The fact we have nothing but breathless panic from grifters and hangers-on, about rampant inflation should at least give one pause, we could be at a temporary or major reversal (not advice, not a recommendation).
At least with the analysis below, there’s a decision point that will let us know if we’re due for another leg higher, or if there’s a Sovereign debt crisis about to break that would kick-off massive selling of all assets including gold.
Gold GLD, Weekly
As the title says, we’ve got something akin to a ‘Maginot Line’ for gold. What looks like insurmountable resistance that could still be breached … but for now, is holding.
With each (manufactured) crisis, gold’s momentum in the form of price and volume, is declining.
From a Wyckoff analysis standpoint, the bulls (for now) are running out of steam.
The ‘terminating wedge’ in gold’s price action has already been discussed, link here.
Looking at the action in another light, we see a Wyckoff Up-Thrust in the works. Price action has penetrated a previous high and is currently struggling.
If gold (GLD) is able to significantly penetrate the resistance and hold, then we’re likely on to the hysterical predictions of the masses.
If not, and we get a reversal, it’s going to be big surprise for many. They’ll be stunned, unable to move and eventually provide more fuel for the downside as they sell in panic.
Downside Drivers
What could possibly be a downside driver for gold?
One has already been mentioned, a Sovereign debt crisis. It’s a likely event considering the record-pace rise for interest rates and subsequent bank failures.
Another is an ‘executive’ decision that gold ownership is outlawed. It’s happened in the past and those who got through that event are no longer with us.
Moving on, we’ve already been told there will be a ‘cyber-attack’.
What’s going to happen to gold, when there’s no electricity, fuel or food shipments?
As survivalist author Ron Foster says, in this interview, (time stamp 27:20), during a grid-down situation, he’s not giving up his food. He says, during such an event, precious metals are “meaningless”.
Note: Posts on this site are for education purposes only. They provide one firm’s insight on the markets. Not investment advice. See additional disclaimer here.
This time, instead of, The subprime crisis is contained”, we have, ‘The banking crisis is over’.
Back then, as the market crashed into ’09, and then forced (manipulated) higher into 2010 and later, you intuitively knew the next time, there’s no saving it (not advice, not a recommendation).
So, here we are … at the ‘next time’.
However, this time around, it’s different … very different.
Coming out nearly every day, is the massive driver to the downside: Biotech. The updated list on that sector is provided at the end of this post.
For this update, we’re looking at the technical condition and more specifically, biotech leveraged inverse fund LABD.
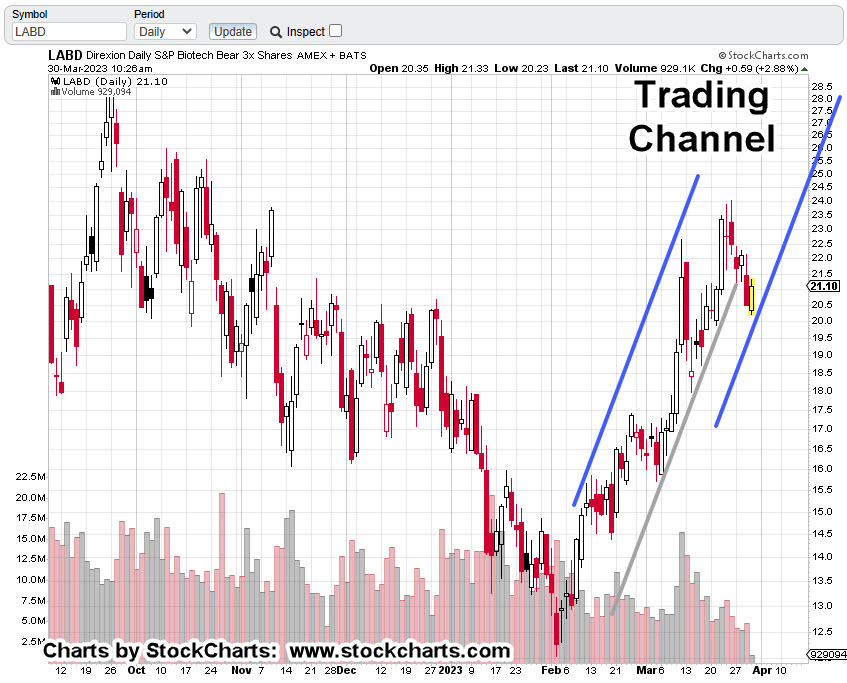
Biotech Leveraged Inverse LABD, Daily
We’re early in the session (11:03, a.m., EST) and we can see a reversal (if it holds) developing.
Today, is also Fibonacci Day 5, from the high set last Friday, the 24th.
Since today may be a pivot to the upside (biotech index lower), a potential continuation channel line is drawn in the chart below.
As mentioned in the last update, a retrace was probable and hence taking profits with a partial exit.
During the past four trading days, that position has been re-established at lower prices (not advice, not a recommendation).
Insurmountable Fundamentals.
At some point unknown to us, the fundamentals will come into play.
The conditions are insurmountable … they can’t be ignored.
Said many times, this is the driving factor for the market(s) on a go-forward basis (not advice, not a recommendation).
Latest on The Biotech List
We’re going to start first with an article that surmises, the blow-up has already happened. That article is here. The report starts off with profanity; be advised.
Then, the biotech list; growing without bound:
Risk Of Cardiac Death Tripled For Young Women Following AstraZeneca COVID-19 Vaccination: Study
Bombshell Vax Analysis Finds $147 Billion In Economic Damage, Tens Of Millions Injured Or Disabled
CDC Found COVID-19 Vaccine Safety Signals Months Earlier Than Previously Known, Files Show
Three Years To Slow The Spread: COVID Hysteria & The Creation Of A Never-Ending Crisis
Biden Signs Bill To Declassify COVID Origins Intel
“I Couldn’t Remain Silent”: Physician Assistant Fired For Reporting COVID-19 Vaccine Adverse Events To VAERS
A Haunting Anniversary – ’15 Days To Slow The Spread’
Note: Posts on this site are for education purposes only. They provide one firm’s insight on the markets. Not investment advice. See additional disclaimer here.
There may be doubters, haters, even money managers reading this and thinking that as well.
So, we’re going to get into it.
We’ll address the ‘liar’ claim, present the current state of biotech along with partial exit of the short position (not advice, not a recommendation).
Fundamentals: The Rats Scramble
Anyone with two-boosters rubbing together can see the rats scrambling; attempting to ‘normalize’ the abnormal.
For example, it’s now ‘standard procedure‘, after a Pilot’s ‘incapacitated’ (i.e., potentially drops dead) in the cockpit to roam about the cabin and ask if there’s anyone else available to fly the plane.
You can’t make this up. Nothing to see here.
Now, on to the charts.
First: Let’s Review
The chart re-printed below, is how it looked this past February 9th, as presented in this post. Recall, the actual reversal was identified to-the-day, in this post.
To go even a bit further, the Wyckoff penetration set-up was identified a day earlier, in this post.
SPBIO Leveraged Inverse LABD, Daily
Re-printed from February 9th.
Fast forward to now. This is how it looked on Friday.
From the chart above, the reversal is well underway.
Momentum has slowed a bit, hence the reason for the position to be reduced by about 13%.
If the decision to partial-exit was wrong and LABD heads immediately higher, there’s still a sizable position open.
If LABD spends the next several days contracting lower (as anticipated), there may be an opportunity to re-acquire the exited position at a lower level (not advice, not a recommendation).
The next chart shows the current trading channel.
It won’t take much sideways to down action to contact the right side. If or when that happens, we’ll see how price action behaves.
Where’s The Lie?
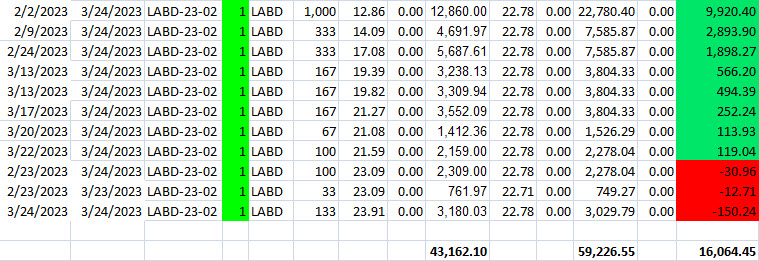
The spreadsheet below, is a modified version of what’s used by my firm. Note, it’s not the actual shares traded but a representation of that action.
The chart has been simplified with the initial entry (of this series) adjusted to 1,000 shares. Subsequent entries are adjusted by the same factor as the initial entry.
For the engineers, the data has been ‘normalized‘.
Working the numbers; we have $43,162.10 initial cost, $59,226.55 at the exit, yielding $16,064.45, which is just over a +37%, gain.
If there’s a lie in all of the above data, the analysis identifying the set-up, the reversal and subsequent trading actions with partial exit, I’m not sure where it is. 🙂
Note: The two left-most rows of ‘zeros’ in the chart are for commission charges. The spreadsheet was developed way back in the day when we had such things.
The right-most row of ‘zeros’ is open profit/loss.
Note: Posts on this site are for education purposes only. They provide one firm’s insight on the markets. Not investment advice. See additional disclaimer here.
Note: Posts on this site are for education purposes only. They provide one firm’s insight on the markets. Not investment advice. See additional disclaimer here.
“Gold (GLD) either reverses from here or moves slightly higher to the 187.50-area before reversing.”
Immediate reversal is exactly what happened.
Actually, gold did go higher to the targeted (GLD 187.50) area in the overnight session; then reversed before the regular session open.
So, it did both of the forecasted moves. 🙂
The ‘Real’ Unemployment
By now, anyone with two pension-plans rubbing together, knows the numbers … that is, any ‘official’ numbers are complete propaganda (not advice, not a recommendation).
For example, the ‘real’ unemployment here, is likely closer to 25%, rather than the ‘official’ level below 4%.
Keep that in mind, as we continue on.
Gold GLD, Weekly
The GLD, weekly has the three major tops with the current (potential) one included.
The second chart (the daily) focuses on the reversal; in technical terms a ‘Wyckoff Up-Thrust‘.
Gold GLD, Daily
Right now, we’re at the test or The Danger Point®; it won’t take much force to move price action either way.
Pointing probabilities to the downside, we have a repeating pattern of ‘Spring to Up-Thrust’.
It’s an observed empirical phenomenon, markets tend to go from a Wyckoff ‘spring’, straight into an ‘up-thrust’.
The New ‘Paradigm’
Well, we probably to have a new paradigm but it’s not in gold (not advice, not a recommendation).
That new paradigm is what no one will discuss.
In the opinion of this author and contrary to what is presented here and here (remember our ‘unemployment’ numbers) we’re in a full-scale demand and population collapse.
The ‘inflation’ for possibly a large part, has been manufactured.
You can’t have over one-hundred food processing plants mysteriously burn down (bug, insect factories not affected) with millions upon millions of egg laying hens destroyed, cattle herd at 1962, lows and not affect the price.
For whatever reason, the mainstream has decided to reveal to the masses what’s been known for years to those who are awake.
Of special interest, Tucker Carlson interview, linked here.
Going Forward
Gold’s at The Danger Point®.
If it can’t make it higher from here on so much apparent and ‘rampant’ inflation, there’s a real risk of it being affected by some kind of Sovereign default … somewhere.
A default would potentially lead to a massive asset sell-off; including everything that’s not nailed down … i.e., gold.
Note: Posts on this site are for education purposes only. They provide one firm’s insight on the markets. Not investment advice. See additional disclaimer here.