If so, during the next leg down, we may be about to get the revelation.
The previous post was valid but a little early … by one day.
As we’ll see below, If the current action holds, it’s a potential major pivot to the downside.
Biotech SPBIO, Daily Chart
The un-marked chart does not look like much at this point. However, the mark-ups below reveal the potential.
We’ll start first with an obvious trend-line.
Next, is a similar trend to the left of the original and then, a potential trend at the right edge.
Where it gets interesting, is when the chart is compressed to show the symmetry of the trading channel.
It’s hard to dispute that it does not exist … there it is.
Positioning
Currently short this sector via LABD (not advice, not a recommendation), with LABD entries at 27.58, and 29.29 for a combined entry of 28.11.
Trade identified as LABD-22-05, with current stop at the session low LABD 26.57.
Summary
SPBIO, is edging lower with near term support areas on the hourly chart (not shown).
We’re still at the danger point; price action can reverse its nascent down move.
However, this time the fundamentals could provide the backdrop; a potential black swan (of ‘side effects’) and especially if the overall markets (S&P, Dow, NASDAQ) have also reversed.
Note: Posts on this site are for education purposes only. They provide one firm’s insight on the markets. Not investment advice. See additional disclaimer here.
With the CPI just released, the article at this link says, ‘the Fed’s work isn’t over.’
They’re so right; but it’s not the work they (at MarketWatch) think it is.
We should all know by now, the truth is right in our faces, but we have to be able to ‘see’.
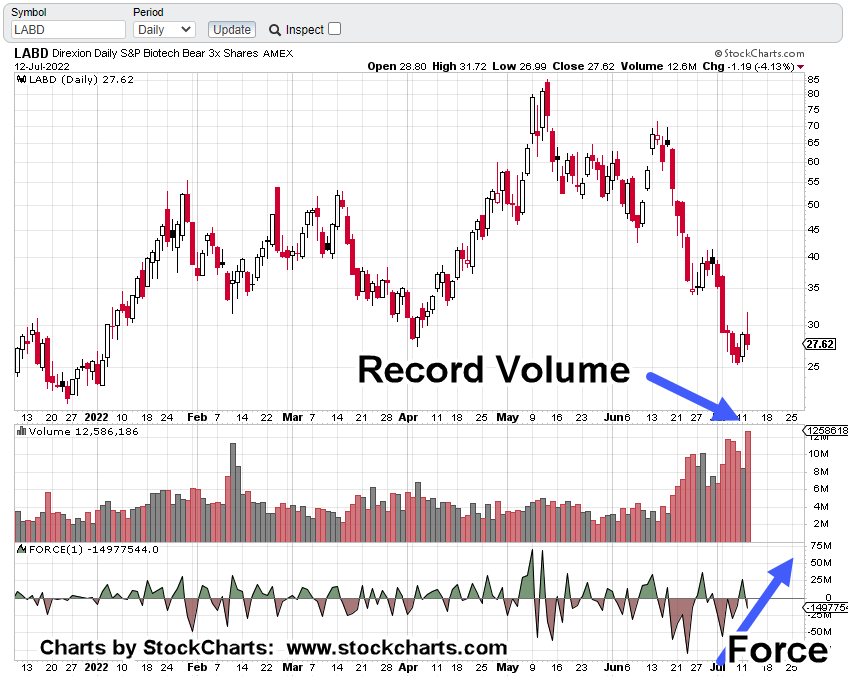
What was seen yesterday, was that biotech appeared to be reaching an extreme.
As a result of the price action, a change was made in positioning out of (Basic Materials short) SMN and into a biotech short via LABD (not advice, not a recommendation).
Part of the reason to focus on LABD was the record volume as shown on the chart below.
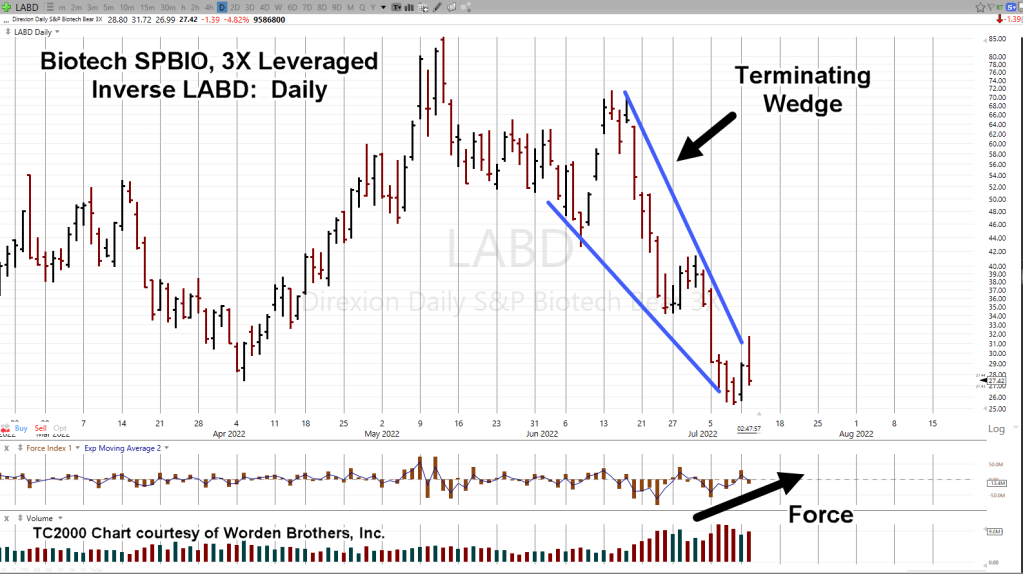
Biotech 3X, Leveraged Inverse LABD, Daily
Note how the Force Index shows downward thrust energy is dissipating … even with the record down volume.
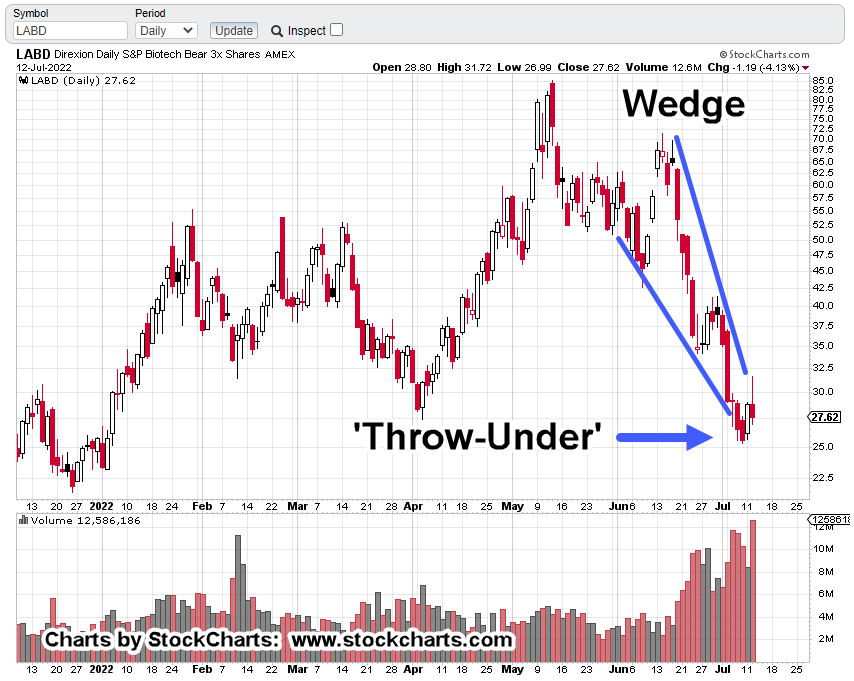
Next, we have the terminating wedge formation; indicating a potential reversal is at hand.
A wedge formation is a typical signal for an up-coming (potential) reversal.
It occurs at the tail-end of a sustained move; meaning a wedge is the last pattern to be formed. Sometimes there’s a throw-over (or under) and sometimes not.
Either way, it’s the end of the directional move.
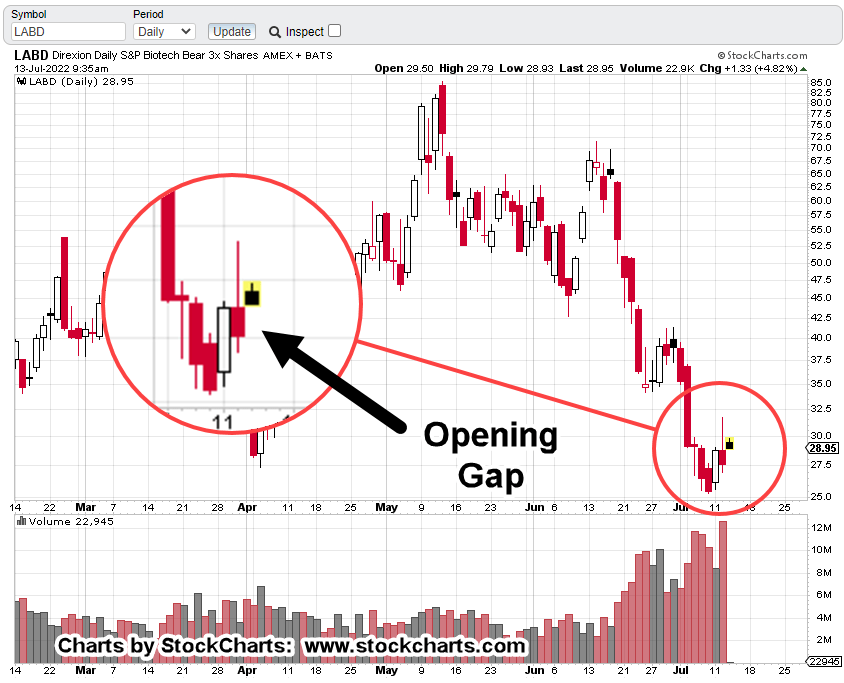
After The Open
We’re just after the open; this is how it looks for LABD.
The first order of business is usually an attempt to close the gap.
As with the prior set-up in YANG, linked here, the objective is to allow LABD, close the gap as much as possible before adding to the existing position, LABD-22-05 (not advice, not a recommendation).
That may happen or not. This market’s already at a pivot extreme.
Note: Posts on this site are for education purposes only. They provide one firm’s insight on the markets. Not investment advice. See additional disclaimer here.
At this link she explains to the kindergarteners (who even at this late stage, STILL believe the lie), the truth about ‘The Speck’.
Go to time stamp 6:37 and watch; you can clearly see her exasperation as she has to go through it one more time.
We also have this going on behind the scenes as well.
On the other side is the continuous stream of fear propaganda. Just go to your local TAAS (sorry, FOX) news outlet to hear the latest lie du jour.
With that in mind, let’s go straight to the index for the day, biotech SPBIO.
The last analysis proved to be flat wrong.
There was a breakdown as anticipated but that move did not follow through. It was the precursor to an up-leg which is where we are now.
Biotech SPBIO, Weekly Close
It’s obvious.
Last week was a test of the resistance (blue line).
Thís week started with biotech sharply lower (early today) but then coming back to test … where we are now.
That test is starting to reverse late in the session (around 3:00 p.m. EST).
Let’s go straight to the inverse fund LABD
SPBIO 3X Leveraged Inverse LABD, Daily
A very tight wedge has formed.
Price action attempted to break out but has come back for a test. This is where risk is least (not advice, not a recommendation).
Positioning
The Basic Materials short (SMN-22-01), while profitable, was not going as planned. That position was exited at SMN 14.29 … you can see it as the low of this session on your trading platform.
SMN 14.29, is me 🙂
That capital has now been used to position short biotech, SPBIO at LABD 27.58. trade LABD-22-05 (not advice, not a recommendation).
The current stop is the low of the day @ 26.98.
Summary
Even as this post is being generated LABD is pulling away from the lows. With about one hour left in the session, it’s at 28.18.
The LABD entry was an initial position; there’s plenty of capital left to increase the line if trade conditions warrant.
Note: Posts on this site are for education purposes only. They provide one firm’s insight on the markets. Not investment advice. See additional disclaimer here.
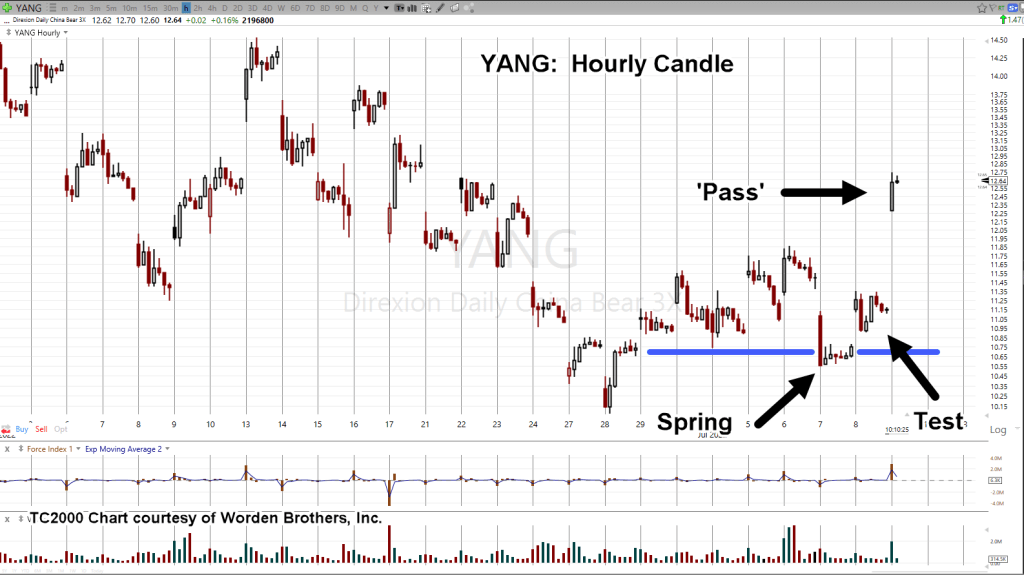
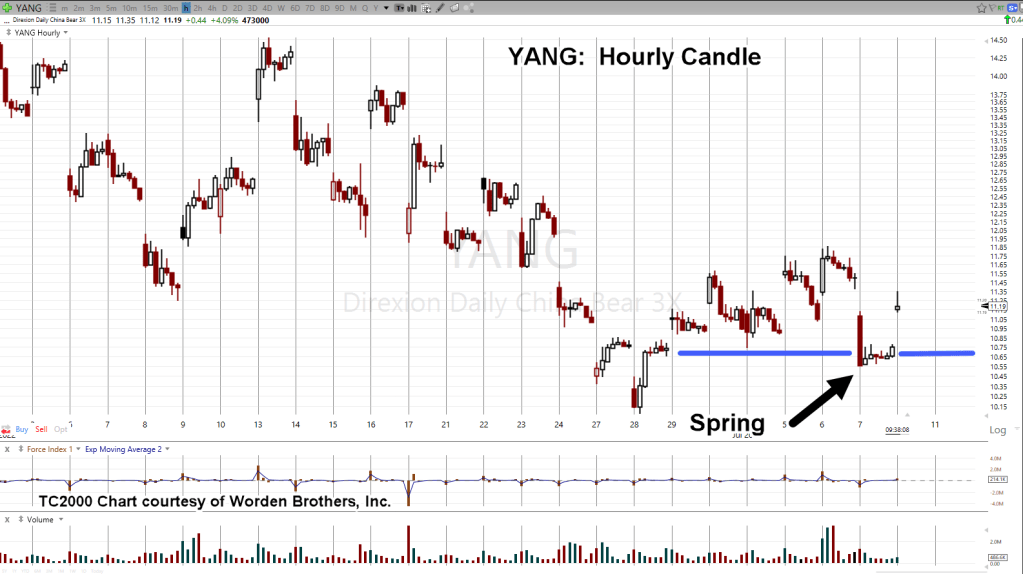
The last report on China, FXI, stated we’re in a Wyckoff set-up that was about to be tested.
More specifically, it said the leveraged inverse fund YANG, was in ‘spring’ position; ‘spring’ is opposite of up-thrust, because we’re looking at shorting the FXI, via inverse fund YANG.
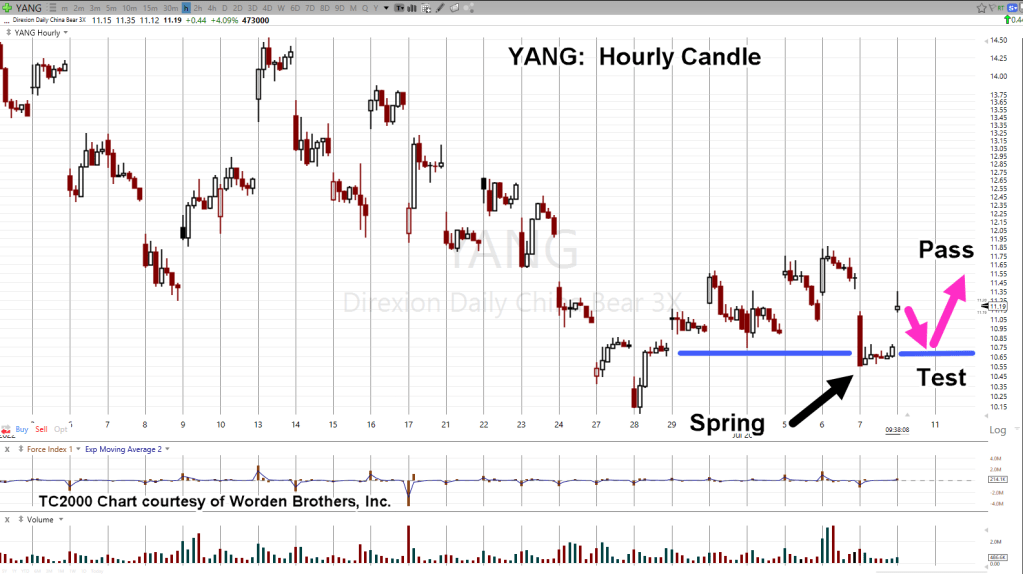
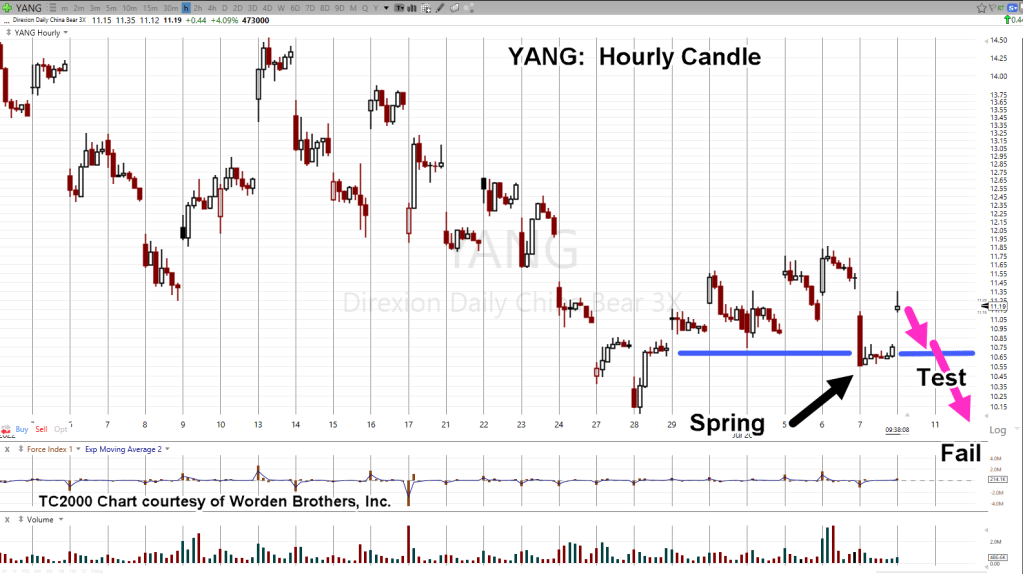
Back then, two charts were provided with the most probable outcome of the set-up. One showed a ‘pass’ of the test and one showed ‘fail’.
Well, it’s obvious now; pass it is.
The original hourly chart is repeated below with the current chart (ninety minutes into the session) following.
Leveraged FXI Inverse YANG, Hourly
Prior to the ‘test’.
And now … ninety minutes into the session:
Back in the day, over a century ago, Wyckoff wrote that ‘somebody always knows something’ and that ‘something’ shows up on the tape.
What we in the Proletariat didn’t know last week, was this week, would bring us this report from ZeroHedge.
The important part is that Wyckoff analysis allowed one to see what was happening (on the tape) and position ahead of time (not advice, not a recommendation).
“Risk on a position short FXI via YANG (not advice, not a recommendation) can be reduced by allowing YANG price action to retrace as much of the opening gap as possible.”
That’s exactly what was done with an entry made near the lows of the day.
For the haters (if any), here’s a reproduction of the entry exactly as it appears in the trade account:
Check for yourself if you like, that YANG was at 10.95, right around 10:51, a.m. EST.
The low of the day occurred several minutes later at YANG 10.90. The stop is set just below that low @ 10.89 (not advice, not a recommendation).
The trade’s identified as TDA-YANG-22-01. The ‘TDA’ references that a separate account (TDA Ameritrade) is being used for this position.
Hopefully, that’s enough ‘transparency’ and we can move on.
The Wyckoff Edge
Properly done (without being skewed by personal bias), there’s nothing else needed other than Wyckoff analysis.
It’s important of course, to understand the context of our (global) environment such as ‘everything’s going according to plan’ but allowing the mainstream to influence the analysis, other than providing a contrarian view, is an absolute waste of time.
Note: Posts on this site are for education purposes only. They provide one firm’s insight on the markets. Not investment advice. See additional disclaimer here.
From a strategy standpoint, we’re now ready for the next round of financial destruction.
If we use this article from ZeroHedge, as the pivot point, consumer credit has maxed out.
The consumer (i.e., middle class) is now on the downward slope, just as the layoffs are about to begin in earnest.
Following the typical corporate model, expect job losses (time stamp 15:18) to start slow, then accelerate into December of this year.
The latest employment numbers provide the perfect backdrop to raise interest rates into a declining economy; all going as planned.
Market Response
As is typical, everyone’s focused on the major indices; The S&P 500, Dow, NASDAQ, SOXX, and on.
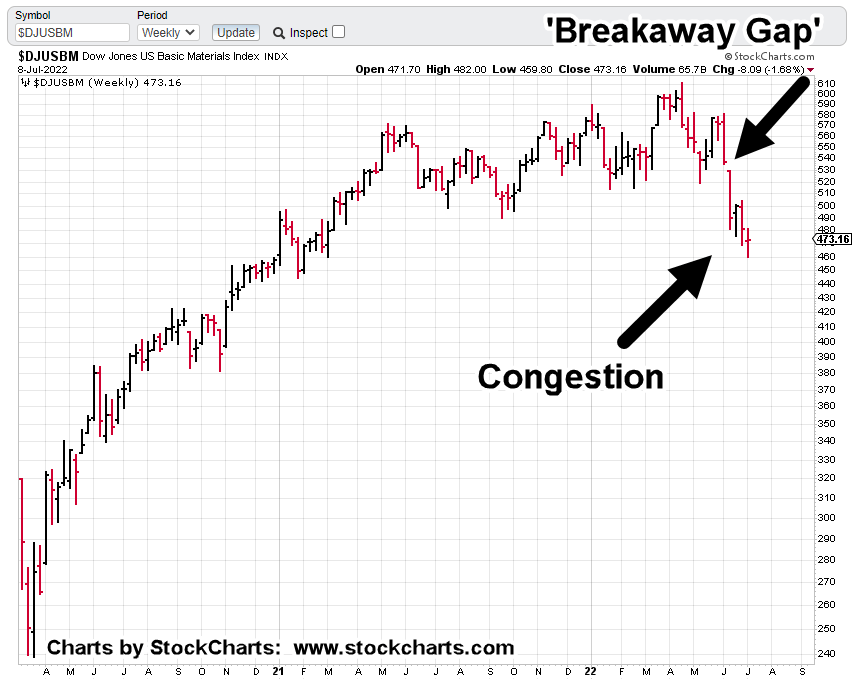
However, there’s one sector covered in the past, that’s mostly ignored: Basic Materials, with ticker DJUSBM.
That sector has held up until recently; probably because the thinking was, we’re going to have infrastructure projects to keep the economy going.
Looks like someone got the memo; Basic Materials has broken down.
As of this past Friday, it’s at a critical point.
The prior post from last November, does an excellent job of highlighting the divergences (which have only become worse) as well as downside potential.
Basic Materials DJUSBM, Weekly
On the chart, we’ve got a breakaway gap that looks like it won’t be filled.
After that break, price action has formed a congestion area over the past three weeks.
However, it’s the congestion area giving us clues; the sector’s set up for an imminent break to the downside.
If that congestion holds true, it’s a stunning revelation of what may be about to happen.
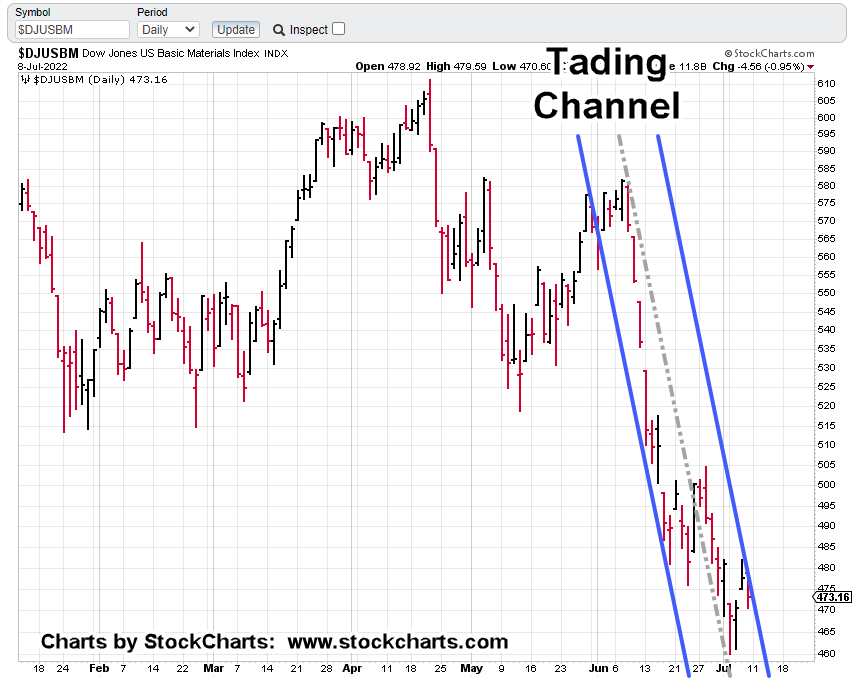
We’ll go to the daily chart and start with a Fibonacci time correlation between pivot points.
Basic Materials DJUSBM, Daily
Well, it might not look like much.
However, let’s go one step further with another time correlation, shown below.
If you’re reading ahead, then you already know a trading channel has been defined.
The next chart shows the result.
For this channel to confirm Fibonacci ‘Day 21’, Friday’s action had to post lower … and it did.
That lower action also confirms, the channel’s a Fibonacci 13-Days wide.
Even more disconcerting (depending on one’s viewpoint), the channel lines are declining at approximately – 96.5%, on an annualized basis.
It’s not straight down but it’s close.
The next chart has a zoom of the congestion area.
Note how the grey dashed ‘center line’ is perfect in its contact points … further confirmation of the channel.
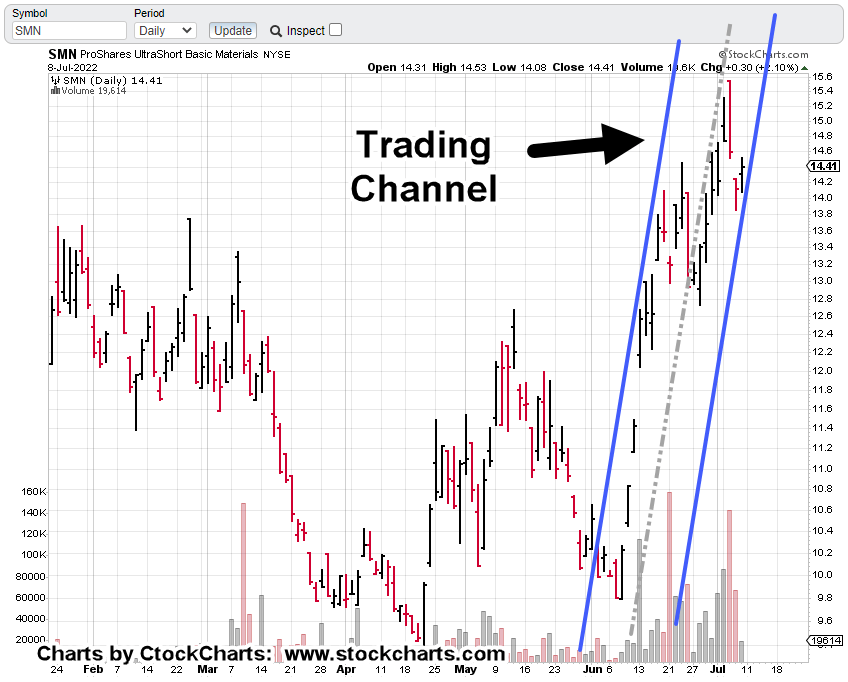
Leveraged 2X Inverse SMN, Daily
Although volume is still light, it has improved dramatically.
On a weekly basis, last week was the second largest trading volume at least going back to the ’07 – ’08, meltdown.
The inverse fund is shown below with the trading channel.
Liquidity is still marginal but has picked up over the last three weeks.
The Week Ahead
Obviously, the expectation for the next open is to post lower for basic materials.
Even with all the analysis, it’s the market itself that’s the final arbiter.
Positioning
As the hyperlink tabs in this post (top-left) show, I’ve positioned one account short the sector via SMN (SMN-22-01), with a stop just below Friday’s SMN, low at around SMN 14.05 (not advice, not a recommendation).
It’s a very tight stop.
The analysis is either in-effect, or it’s not. By this Monday, we’ll find out.
A Decline of Biblical Proportion.
On a strategic basis, we can see how expertly the middle class has been maneuvered into a corner.
For the past two years and probably much longer, that sector has been positioned to not have any recourse when the real decline hits.
We may be there now.
At the same time, if you’re up on Biblical references, you already know that when destruction came, there was always a ‘remnant‘.
The remnant was left to either escape or re-build and was typically 10% of the population.
If you’re reading this, you have already decided at some level, to be part of that remnant.
Note: Posts on this site are for education purposes only. They provide one firm’s insight on the markets. Not investment advice. See additional disclaimer here.
The Danger Point®, trade mark: No. 6,505,279
Active: Short DJUSBM via SMN, as SMN-22-01, stop @ SMN 14.05
The last update’s high probability set-up was negated at the next session … only to morph into another high probability.
We’ll go straight to the FXI, leveraged inverse fund YANG.
FXI, Leveraged Inverse YANG, Hourly
It’s about twenty minutes after the open and YANG is trading at around, 11.15 – 11.16.
The chart below shows a Wyckoff spring set-up in progress.
What’s missing at this point, what’s to be expected during this session or next, is the test.
That same hourly chart is marked up below to show how that test may look with a pass or fail.
Risk on a position short FXI via YANG (not advice, not a recommendation) can be reduced by allowing YANG price action to retrace as much of the opening gap as possible.
It’s Friday and we’re heading into the weekend.
Does anyone really want to be positioned long? 🙂
It’s not as if anything bad is happening.
Nothing like British Members of Parliament (and the Prime Minister) turning in their resignations … all staged but that’s a whole other story.
Note: Posts on this site are for education purposes only. They provide one firm’s insight on the markets. Not investment advice. See additional disclaimer here.
And so it was. Short position in real estate, closed out.
Even with all the analysis, real estate (IYR) has pushed higher. The short position via SRS (SRS-22-01) was exited just below the stop @ SRS 16.33.
Exiting a trade, frees the mind to look elsewhere for opportunity.
Typically, one would have to wait days or even a week or so for something else to be available.
However, despite appearances, the market is moving very fast at this juncture.
Looking around in those markets, we have a textbook entry signal (to go short) the FXI (not advice, not a recommendation).
David Weis & The Video
Many times, on this site (actually, for years), the Weis video has been recommended.
Next to Wyckoff’s treatise from 1910, Studies In Tape Reading, that video is probably the most important one could ever watch concerning the markets.
In it, he describes a ‘trick’ as he calls it, to get aboard a market that’s already underway. At the time, his discussion was using DE (if memory serves), as the trading vehicle.
That ‘trick’ is highlighted below on FXI
China Index FXI, Daily
This is how the chart looks early in today’s session.
Next, we’re going to invert the chart to mimic what’s seen on leveraged inverse fund YANG.
And now, the signal zoomed-in
The above price action is nearly exactly as presented in the Weis video; even though it was recorded fifteen-years ago.
The above signal is not a guarantee.
It is, however, a high probability low risk set-up (not advice, not a recommendation).
The entry signal was triggered at approximately YANG 11.75, with a stop at YANG 11.02, for a ‘risk’ of 0.73/share (not advice, not a recommendation).
Summary
As this post is being created, YANG is retracing and is currently trading near 11.67, narrowing the distance from any potential entry to the stop.
On a very long term (Monthly) basis, there are interesting things happening in FXI. We’ll be covering that soon in another update.
Note: Posts on this site are for education purposes only. They provide one firm’s insight on the markets. Not investment advice. See additional disclaimer here.
The Danger Point®, trade mark: No. 6,505,279
Active: YANG (YANG-22-02), entry @ 11.83, with stop @ 11.30
‘Sometimes it seems as if the market hangs in the balance by the weight of a feather.’: Wyckoff, circa 1910.
Is this the big reversal to the downside?
Before we get to that answer, let’s review two recent market pivots (including today).
A Day To Remember
Back on May 4th, the post with the same title, linked here, was to be used for reference on a go-forward basis.
The post has a linked article, whose comment section could be surmised as the bourgeois rebuke of a 78-year-old fund manager.
That manager was quoted as saying, “It’s the biggest bear market of my life”; to which the younger crowd responded with derision, effectively saying the old man’s a dolt, an idiot, a doofus and needs to retire.
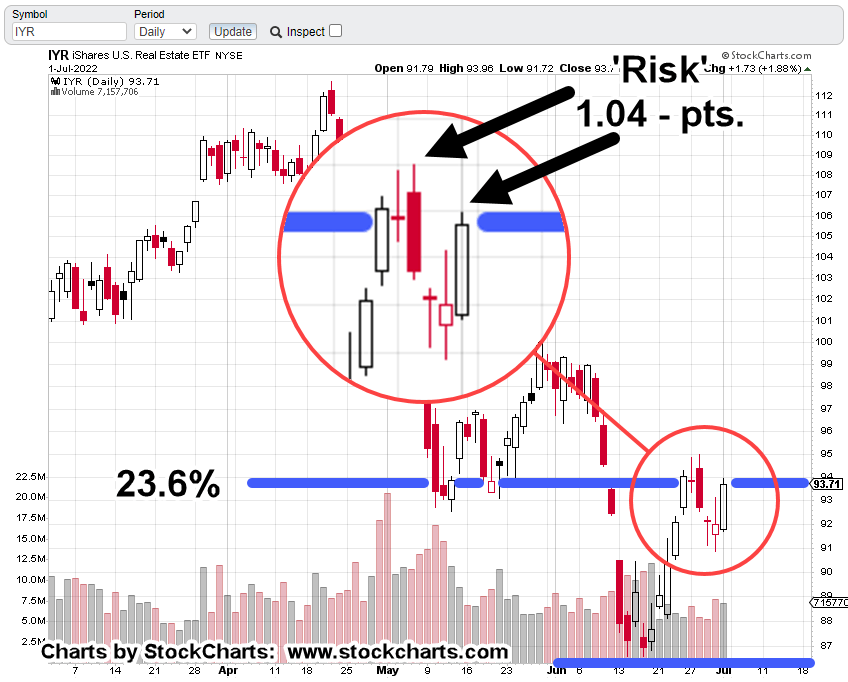
Now that time has passed, let’s remind ourselves when the quote was published with the daily (IYR) chart below.
Not only did IYR, not close higher after that, it never printed higher either. It was the top of the pivot reversal, to the day.
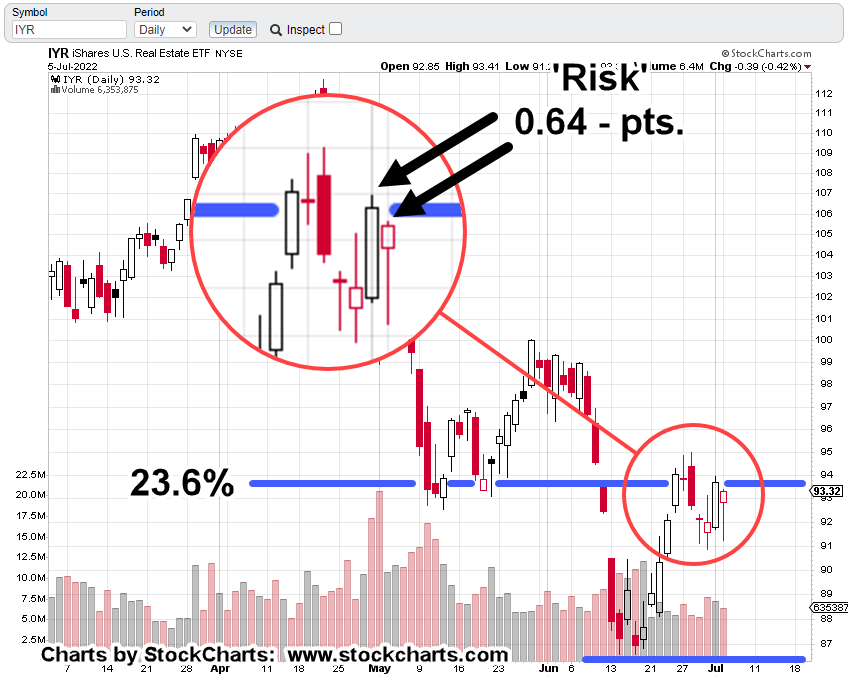
The 23.6%, Retrace
Then we have this report just days ago, showing IYR’s price action coming back to a (very weak) Fibonacci 23.6%, retrace.
The daily chart repeated below, showed the ‘risk’ on a short position as approximately 1.04-pts (not advice, not a recommendation).
Risk Narrows Even More
As a result of today’s new daily low and lower close, one can (theoretically) reduce the risk of a short position even further (not advice, not a recommendation).
The risk is now defined as the distance between today’s close (IYR: 93.32) and Friday’s high of IYR: 93.96
A subsequent push above Friday’s high negates the short and would likely indicate a potential move to a 38.2%, retrace.
Subtleties of The Market
A lower daily print and marginally lower close (IYR down just – 0.39-pts.) does not look like anything of consequence.
Could we be right in the middle of a historic crash and not even know it?
Of course, it’s never for sure, until it’s over.
However, if shorting opportunities are being spotted, entered, and managed correctly, probabilities are that one will already be positioned short when ‘the big one’ hits.
Note: Posts on this site are for education purposes only. They provide one firm’s insight on the markets. Not investment advice. See additional disclaimer here.
The Danger Point®, trade mark: No. 6,505,279
Active: Positioned short via SRS (SRS-22-01), with stop at SRS: 16.38
Anyone who thinks the Fed’s going to ‘pivot’ because the numbers are weak, does not understand (or won’t admit to) the real purpose of the entity; but I digress.
The Strategy
Way back in December of 2020, this post was released which discussed ‘Genesis 41’, specifically.
It was an intuitive assessment; we’re in a phase where corn and grain (i.e., the food supply) are potentially more important than ‘stacking‘ silver or gold.
Over the ensuing year and a half, how correct, that has proven to be.
Then, nine-months ago, was this post, presenting the ‘elephant’; a massive population decline whose repercussions would last the lifetimes of anyone reading.
Now, we have this. A report that confirms the elephant.
It’s all starting to hit the mainstream, although the language is still being couched to not cause undue panic. Good luck with that.
So, what’s next?
The Danger Point: Real Estate
While mainstream press and money managers alike struggle to figure out the obvious, we have price action itself telling us the next likely direction of the market.
During an economic downturn there are many places not to be such as semiconductors, airlines and other low margin businesses, restaurants and so on.
However, the most illiquid of all, is real estate. It does not matter how bad one wants to sell, if there is no buyer, there is no sale.
Real Estate IYR, Weekly Chart
Last week, real estate IYR, closed right at the Fibonacci 23.6% retrace as shown.
Getting closer in on the daily, it’s marked up to show the risk from a shorting perspective (not advice, not a recommendation).
Real Estate IYR, Daily Chart
In this case, the risk on a short position is defined as the distance from last Friday’s high (IYR: 93.96) to that same week’s high of IYR: 95.0
Let’s add, Friday’s action saw IYR, retrace a Fibonacci 76.4% (the most available) of the entire move for the week.
The Summary
Amazon (AMZN), ProLogis (PLD), and Real Estate IYR, are joined at the hip.
Now the economy’s imploding, massive warehouse space is not needed.
Ditto that for employees as well.
ProLogis is already down – 31.2%, from its all-time highs set just this past April.
We’ve already shown PLD, has a nasty habit of going straight down during a market route.
Last time, PLD, crashed over – 84%, in just two months.
Note: Posts on this site are for education purposes only. They provide one firm’s insight on the markets. Not investment advice. See additional disclaimer here.