Tesla Top, and Fibonacci

Options Day-Trade, Nets … 170%

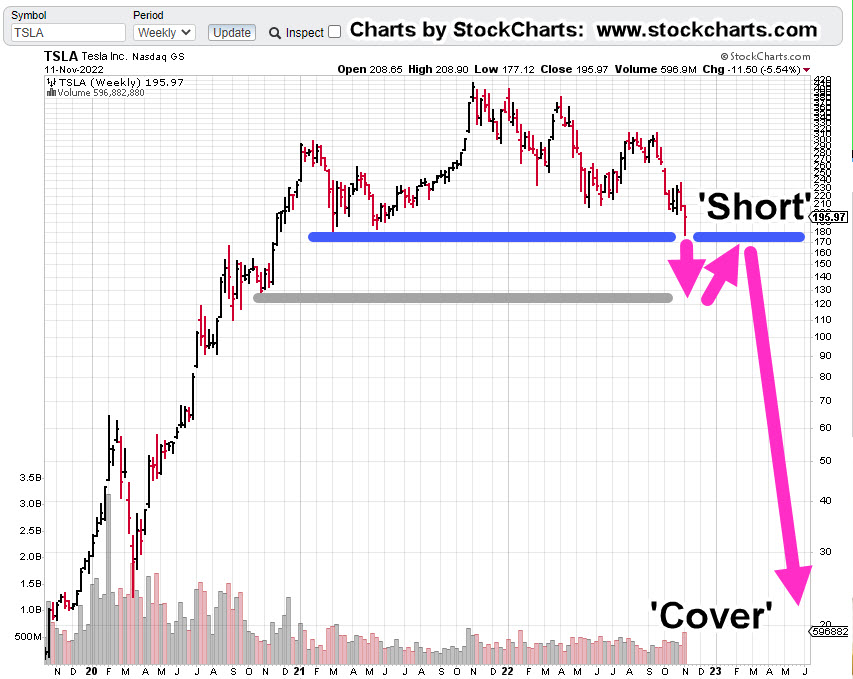
It’s no secret that Tesla’s a Ponzi scheme mania.

Its current market capitalization is over ten-times that of General Motors (GM); a company that’s been in business, since 1908.

GM’s auto production numbers for 2022, were 66% higher (imagine that), than Tesla’s 1.37-million; provided, that we actually believe any of the data. 🙂

If we take Tesla’s market cap as of Friday’s close (654.7bln) and divide it by the closing price of 196.89, we get 3.33.

You can’t make this stuff up.

The TSLA market has ultra-high liquidity and is highly emotional (like the gold market). That liquidity lends itself to Fibonacci-based analysis.

We’ll get to the analysis but first, the options trade.

Tesla TSLA, Option Trade: 3-minute Chart

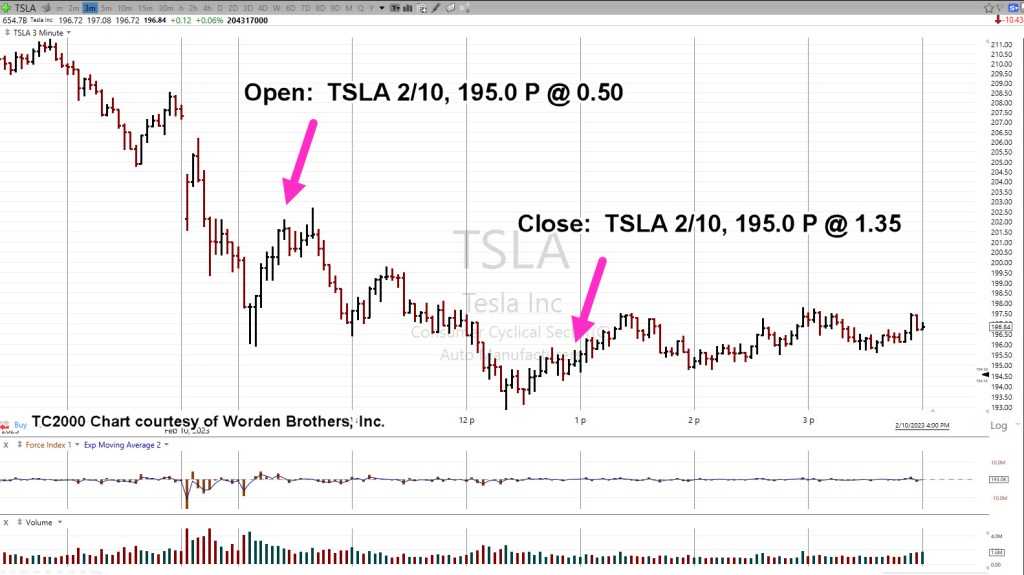
We’re trading the day of expiration 2/10, and the value is decaying rapidly. The entry of 0.50 was about where the option closed on the prior session.

Note, the entry was made on the way up … extremely difficult to stomach selling short, on an expiring position, as the price is rising.

Option was closed when it was obvious there was no more downside for the day. Since it was a 195.0 Put, it expired worthless at the end of the session.

Now, on to Fibonacci.

Tesla TSLA, Daily, with Fibonacci Projection(s)

The chart shows how precise the moves have conformed to Fibonacci.

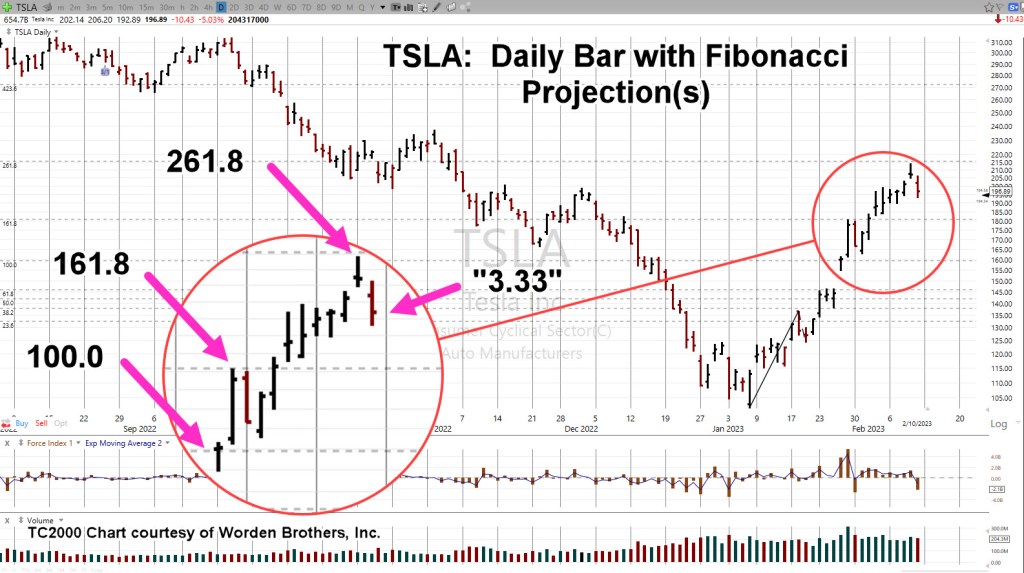
We’ve included the “3.33”, as mentioned above; it will be interesting to see what happens at the next open.

After-hours activity was down – 2.31 pts, on 2,486,196 shares, according to BigCharts.

Depending on subsequent price action, the next update will address the Fibonacci downside projections.

Stay Tuned

Charts by StockCharts

Note:  Posts on this site are for education purposes only.  They provide one firm’s insight on the markets.  Not investment advice.  See additional disclaimer here.

The Danger Point®, trade mark: No. 6,505,279


Tesla … At The Top

Terminating Wedge

Technically, the short-covering rally appears to be over.

Shown below, there was a minor wedge formed over the past two weeks that has been met with a measured move.

Pre-market action (9:10 a.m., EST) is lower; currently trading below yesterday’s low of TSLA 204.77.

We’ll get to that but first, a look at the forecast created back in November, last year.

Tesla TSLA, Weekly: November Forecast

Here is the link to the original post.

In that post, note there were two potential outcomes for price action. The charts below show that “Chart 2“, was the course chosen by TSLA.

Original Forecast

And … the result

Let’s move on to the daily and show the terminating wedge.

Tesla TSLA, Daily

It’s important to note that TSLA’s previous decline was ‘well behaved’. That means, it was orderly with few if any significant price gaps.

On the next move down, if it occurs, ‘well-behaved’ is not what comes to mind.

Notice on the short covering rally how there were at least three price-gaps higher … the last of which may be filled at the open today.

Summary & Strategy

We’re in the largest bear market in world history.

There is no sure way to ‘predict’ what will happen next (not advice, not a recommendation).

What can be done, is to identify probabilities.

At this juncture, TSLA appears to have completed its short-covering rally.

It’s now up to the trader/speculator to either stand-aside, or to enter the arena.

Stay Tuned

Charts by StockCharts

Note:  Posts on this site are for education purposes only.  They provide one firm’s insight on the markets.  Not investment advice.  See additional disclaimer here.

The Danger Point®, trade mark: No. 6,505,279

Biotech Bobsled, Starts … Down

Slowly, At First

Of all the major indices for today’s (Wednesday) session, biotech’s SPBIO, Leveraged Inverse Fund LABD, had one of, if not the largest gain @ +10.48%.

The last update identified two sectors to watch for short positioning: Real Estate IYR, and Biotech SPBIO; Short positioning via leveraged inverse funds DRV, and LABD, respectively (not advice, not a recommendation).

Since that post, DRV is up + 1.74%, and LABD is up + 8.58%, both measured on a close basis.

The ‘Big Reveal’

Remember: When price action turns south, that’s when the bad news comes out.

If this is the big reversal and biotech is the downside leader, unfortunately, that could mean a planned ‘reveal’ by the mainstream media.

Anyone going to alternative sites such as BitChute, ZeroHedge, Rumble, know full well what’s happening.

Maybe we’ll have another distraction like the 100-th (at last estimate) food processing plant fire or even something totally retro, like a balloon flying across … oh, wait. 🙂

Biotech SPBIO, Leveraged Inverse LABD

We’ll get straight to the point as prior updates have built a substantial case for a long term, significant reversal.

Recall, LABD is the leveraged inverse of SPBIO. The daily chart shows the current set-up.

This site does not provide investment advice.

With that said, one could infer from this prior post (at the bottom), a position in LABD had already been established and included a hard-stop.

That was indeed the case.

Next Steps

There’s no guarantee on how far or how long a directional move will go.

However, for SPBIO, one can observe since the February 2021, reversal from all-time highs, a sustained, directional move typically lasts 4 – 6 weeks.

The next update will show the best chart timeframe (multiple days) that resulted in capturing the majority of the directional moves since the February 2021-high.

Stay Tuned

Charts by StockCharts

Note:  Posts on this site are for education purposes only.  They provide one firm’s insight on the markets.  Not investment advice.  See additional disclaimer here.

The Danger Point®, trade mark: No. 6,505,279

The Moderna ‘Channel’ … Redux

… And The Weekly, ‘Summary & Strategy’

The last update about our chief cook and bottle washer of gene ‘modification’ had this to say about price action.

“We’re about forty minutes into the session; Moderna (MRNA) has just confirmed the up-thrust reversal discussed in the last update“.

From that point Moderna (MRNA) declined for seven weeks for a total of around – 31.5%.

However, that’s not the most important part.

In that update, a trading channel was shown which at the time, was declining at – 93.7%, on an annualized basis.

Well, the channel is back.

Only this time, probabilities and price action have come together to set up for a potential sustained decline.

Moderna MRNA, Weekly

Above, we have a Wyckoff ‘Up-Thrust’ and a test that has since turned lower.

Next, we have a series of repeating trend or channel lines.

Additional data has modified the downward slope to be declining at approximately – 90%, annualized.

From a fundamental standpoint, the data set is enormous on the events of the past three years.

At some point that data could provide a huge tailwind for downside action.

For now however, let’s stick with what price action is telling us and go to the Summary & Strategy

Summary & Strategy

The past week has identified two areas of position or trade execution and two areas for possible short-term options execution (not advice, not a recommendation):

Position or Trade: Real Estate IYR, and Biotech SPBIO

Options: Carmax KMX, and Moderna MRNA

As a reminder, most if not all trade analysis is for the short side (not advice, not a recommendation).

Final Thoughts

Since we have possibly the largest bull trap in market history with huge numbers of VIX Call options, the following week may be subdued by going modestly up, sideways or down, slowly.

With that said, options positioning (if any) could be slated for the week of 2/17/23.

As always, price action is the final arbiter.

Stay Tuned

Charts by StockCharts

Note:  Posts on this site are for education purposes only.  They provide one firm’s insight on the markets.  Not investment advice.  See additional disclaimer here.

The Danger Point®, trade mark: No. 6,505,279

CarMax … Dead Cat Bounce

That, Was Then …

Back in October last year, the update on CarMax, said this:

“… there could be small blip up to resistance in the 85-area before potentially rolling over into a descent that projects to the 4.00, level.

If and when that happens, CarMax rival Carvana, may be long gone; its disruptive vending machines possibly being used as homeless shelters or insect farms.”

Even with the short-squeeze mania last week, rival Carvana, remains down a blistering – 96.2%, from its all-time highs; having reached an interim low of – 99.1%, in December.

Insect farms, dead-ahead. 🙂

The ‘Bounce’

So, does getting to a high of KMX 80.92, meet the forecast of “the 85-area” ?

It looks close enough, but the real story is the bearish trade set-up.

I’ve lost track of the number of Wyckoff ‘Spring to Up-Thrust’, set-ups that have been covered since this post, over sixteen months ago; we now have another.

CarMax KMX, Weekly

Unmarked chart.

Long time users should be able to spot the set-up immediately.

For those new to the site or if more clarification is needed, here it is:

Getting down to the daily, is where a trading plan is created.

KMX, Daily

Several scenarios.

Three potential scenarios are below.

Remember, we’re in possibly the largest bull-trap in market history.

Those in control of the markets need to bleed-off the VIX Call options values by having the market go up, sideways, or down slowly (at first).

Here is the VIX Option expiration calendar for 2023-2025.

Going straight down at this juncture (although anything can happen), is not the most probable outcome.

Scenario No. 1

Lower open at the next session, followed by a labored move to test the underside of resistance.

The test can happen in one day or several days.

Scenario No. 2

Next up, is congestion tests before heading lower.

Scenario No. 3

Lastly, a steady but ratcheting move lower.

These are just three potential outcomes of an infinite number.

The market itself will give clues at the next session to the more probable outcome.

Summary

It may be after the 15th (past VIX option expiration), before there is a decisive move lower.

Not covered in this update is what happens if KMX, actually goes higher instead of lower. If that happens, we’ll post updates as necessary.

Stay Tuned

Charts by StockCharts

Note:  Posts on this site are for education purposes only.  They provide one firm’s insight on the markets.  Not investment advice.  See additional disclaimer here.

The Danger Point®, trade mark: No. 6,505,279

Biggest Bull Trap, in History ?

Slow Descent, At First … Then, Mass Sell-Off ?

The large number of VIX (volatility) Calls, tells us, not to expect an immediate sharp move lower.

Those Calls will likely need to be bled-off in value, before we get a significant downward spike … if there is one.

Market Summary, Watch List

Over the past week, there are two markets that are being monitored for short position entry: Real Estate and Biotech; IYR, and SPBIO, respectively.

After nearly five months of price action whipsaw and congestion, biotech appears to be in a nascent downside reversal. Real estate looks to have reversed today (not advice, not a recommendation).

Biotech has been the weakest (technically) of all the major indices (except miners, GDX and GDXJ).

We’re going to look at the daily chart of SPBIO, to see the opportunity and the risk.

Biotech SPBIO, Daily Close

Since late September last year, there has been sideways-to-up, price action congestion.

Price action today, appears to have resolved into a nascent reversal.

We’re going to invert the chart to mimic the leveraged inverse fund LABD, showing the opportunity and the risk.

SPBIO, Daily Close (Inverted)

The prior two days of Fed induced bullish short-covering hysteria, have resulted in a decisive penetration of the support level, as shown.

By definition, this puts us in Wyckoff ‘Spring Position’; be on guard for a potential reversal.

Positioning

There have been many false starts to this sector’s reversal as evidenced by previous posts.

However, today’s action is consistent with resolution of the five-months of congestion (not advice, not a recommendation).

Every trading/speculator has their own style and this site does not give financial advice.

With that said, a (highly leveraged) short entry via LABD, would have a hard stop at today’s low.

At present (2:15 p.m., EST) and entry at LABD 12.91 would have a stop at 12.45, yielding a ‘risk’ of 0.46-pts.

Stay Tuned

Charts by StockCharts

Note:  Posts on this site are for education purposes only.  They provide one firm’s insight on the markets.  Not investment advice.  See additional disclaimer here.

The Danger Point®, trade mark: No. 6,505,279

Et Tu, Biotech ?

Biotech SPBIO Joins The Ranks In ‘Danger’

The clock is ticking for biotech in so many ways. Now, one more event.

Shown below is an inverted chart of biotech sector SPBIO.

While all the major indices have posted a bear market rally above their 200-Week moving average (except the miners), the SPBIO, has remained firmly below those levels.

Now, today, we have a decisive penetration of resistance as shown on the daily below.

The chart has been inverted to mimic the 3X Leveraged Inverse Fund LABD.

So, ‘resistance’ now becomes ‘support’ on the inverted chart.

Biotech SPBIO, Daily (Inverted)

We’ve penetrated ‘support’. Therefore, we’re in Wyckoff ‘Spring Position’, ready for reversal.

Even as this post is being created (2:25 p.m., EST), LABD is coming off its lows; currently trading at LABD: 12.61

A push back above support (approx. LABD 14.00 area), would indicate the spring reversal, is underway (not advice, not a recommendation).

Stay Tuned

Charts by StockCharts

Note:  Posts on this site are for education purposes only.  They provide one firm’s insight on the markets.  Not investment advice.  See additional disclaimer here.

The Danger Point®, trade mark: No. 6,505,279

Historic (Downside) Potential

Momentum Stretched Like ‘Never Before’

How do you know it’s a bear market bounce?

Take a look at the long-term chart of real estate IYR, below.

From a historic momentum standpoint, we’re at ‘never before’ levels.

The chart puts it in perspective.

Real Estate IYR, Weekly

MACD momentum is stretched to (nearly) off the chart.

In the zoom version below, note how MACD histogram made lower lows in 2022, and then immediately launched to an historic extreme in January.

It’s potentially the largest short squeeze in IYR, trading history.

What that means; when we finally get a decisive reversal (possibly this week) the downside potential is enormous (not advice, not a recommendation).

Old vs. New ‘Investor’

Here’s a good read on the differences between those who learn and those who do not.

A paraphrased quote:

‘Whatever bad scenario you can imagine, reality can be far worse.’

In the next update, and depending on price action for the day, we’ll discuss how you author is (or plans to) positioning for the downside in IYR.

It’s about five minutes before the open and IYR, is trading slightly higher.

Stay Tuned

Charts by StockCharts

Note:  Posts on this site are for education purposes only.  They provide one firm’s insight on the markets.  Not investment advice.  See additional disclaimer here.

The Danger Point®, trade mark: No. 6,505,279

Do Not Pass ‘Go’

Do Not Collect $200

Go Stright To Economic ‘Depression’

And, that’s where we are ladies and gentlemen.

Provided many times on this site, the assessment we’ve gone straight past recession and directly to: ‘The Greater Depression’, or ‘The Great Depression 2.0’

By now, we’re all aware of this data, just out from ZeroHedge.

That data is at the ‘peak’ or the depths of 1932, and we in our current market, haven’t even got started!

‘Entertain Me’

YouTuber, Michael Cowan, has picked up the story.

You can hear the frustration in his voice (time stamp 1:31) as everybody seems to be waiting to be ‘entertained’ with a crash before they do anything.

It’s a good thing we’re not part of that ‘crowd’, right? 🙂

Lions and Tigers and The Fed, Oh My!

The Fed’s interest rate announcement is due out at 2:00 p.m., Eastern, today; does it really matter?

We can see with unbiased observation; the wheels have already, irrevocably, been set in motion.

The economy along with the ‘elephant’ that no one talks about, are juggernauts on a downward course.

The 1929 Crash, Then Bull Rally

Remember, the big market speculators of the early 1900s typically made their fortunes on the way down (not advice, not a recommendation).

Let’s also not forget, one of, if not the largest market rallies up to that time (in percentage terms), happened right in the middle of The Great Depression.

Chart by macrotrends: www.macrotrends.net

Of course, to trade that mid-1930s rally, you had to have the capital to do so.

Which brings us to the next topic: Real Estate.

Real Estate IYR, Weekly

With yesterday’s new print high, we’re at Fibonacci Week 34. That puts us at a potential trading channel or inflection point as discussed in this post.

There’s no guarantee of a trading channel or even a reversal.

However, we do have a confluence of events; upside volume (pressure) declining, marginal new highs and the potential Fed pivot point, due out today.

It’s about 20-minutes before the open. Let’s see what happens next.

Stay Tuned

Charts by StockCharts

Note:  Posts on this site are for education purposes only.  They provide one firm’s insight on the markets.  Not investment advice.  See additional disclaimer here.

The Danger Point®, trade mark: No. 6,505,279