Note: Posts on this site are for education purposes only. They provide one firm’s insight on the markets. Not investment advice. See additional disclaimer here.
We’re still in the pre-market (9:13 a.m., EST) but already, long bonds (TLT), are trading lower with rates higher.
The current bond reversal was first discussed in this post.
Part of what was said (then) is to watch how the press paints the picture; that is, to get your popcorn ready.
Cue The Press
So, the ‘press’ has decided that ‘investors’ are losing confidence in the Fed.
Instead of highlighting wrong-think about who is leading whom (hint, bonds are in charge, not the Fed), we’re going to ‘let the trade do the talking’ or the analysis, as it were.
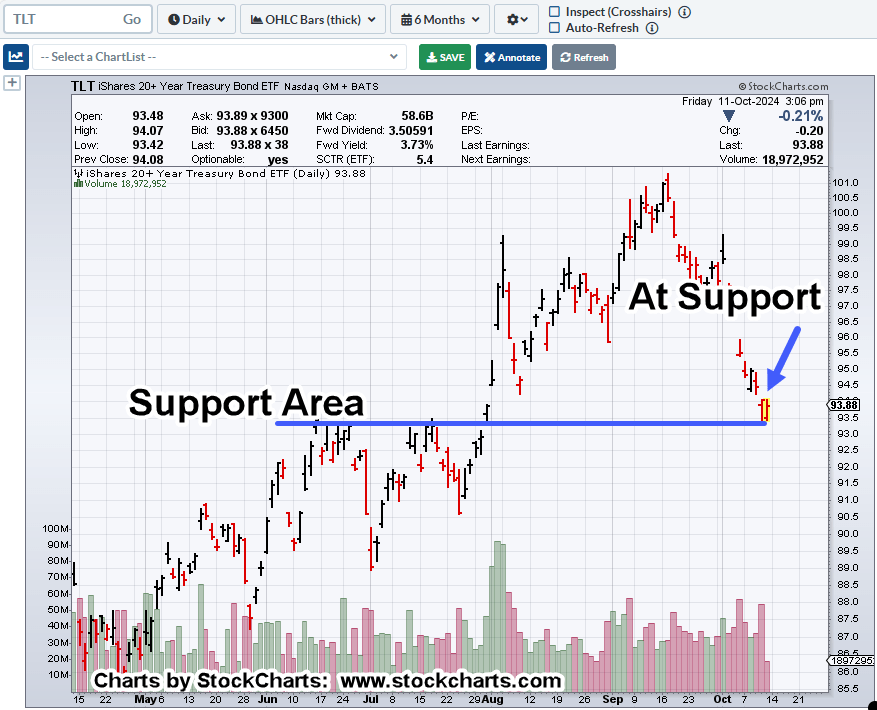
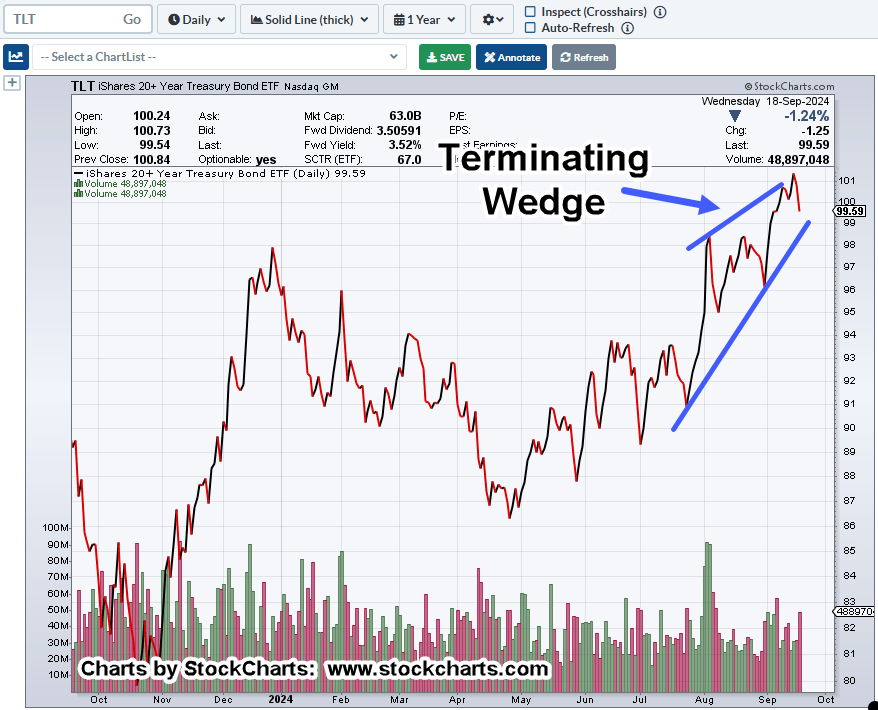
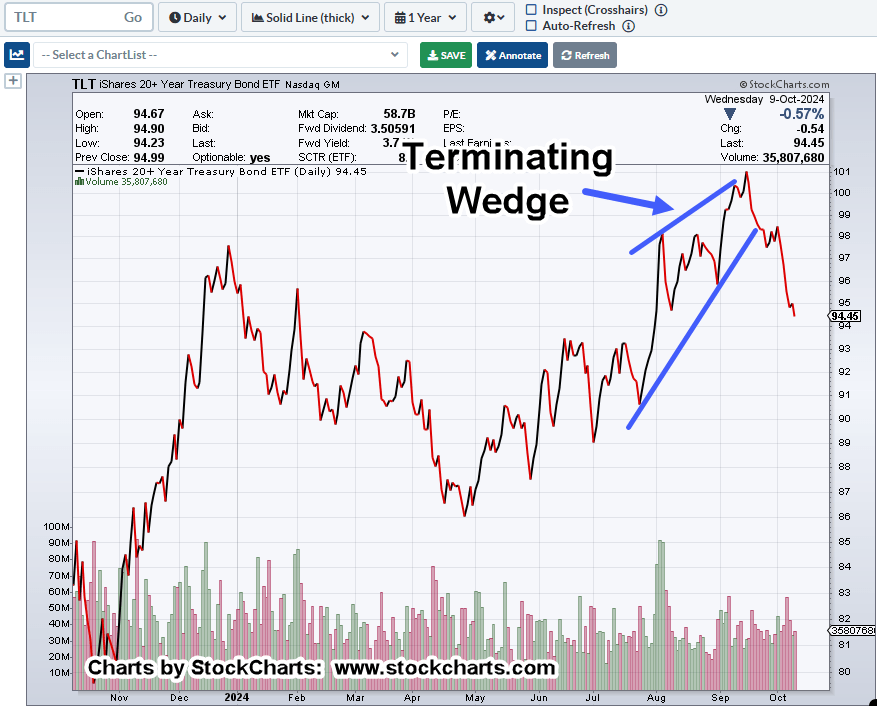
Long Bonds TLT, Daily Close
Back then (September 19th), wedge identified.
Moving on to now.
We’ll propose that investors are not losing confidence in the Fed.
No, we’re in a new paradigm, catching many off-guard; unsure as to what data to believe and how to position.
This site is using the method described in the About section. You’re watching in real time, how that method fares under the current chaotic market conditions.
As Buffett is attributed to saying.
‘When the tide goes out, that’s when you find out who’s been swimming naked’.
Note: Posts on this site are for education purposes only. They provide one firm’s insight on the markets. Not investment advice. See additional disclaimer here.
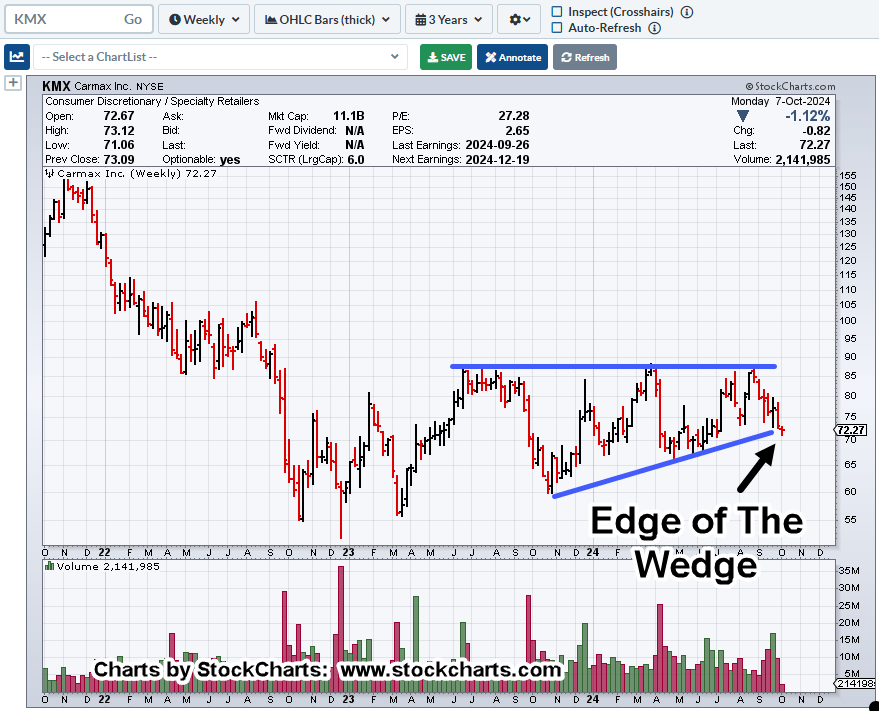
As interest rates rachet higher, the squeeze is being put on operations that are rate dependent; real estate and auto loans to name just two (not advice, not a recommendation).
Tomorrow’s price action in CarMax, is likely to confirm the trend (shown below) or negate.
Note: We could also have a trading channel.
CarMax KMX, Daily
If KMX, is in the channel, we’re at the far-right end of the ‘supply side’.
It’s important to note, price action is also (just) below well-established support at the 73.50-area.
From a technical standpoint, that puts KMX, in Wyckoff ‘spring’ position.
The expectation is for the spring set-up to fail (not advice, not a recommendation).
Note: Posts on this site are for education purposes only. They provide one firm’s insight on the markets. Not investment advice. See additional disclaimer here.
For silver bulls, it must feel like the old Rod Stewart song, from the early 70’s, ‘In a Broken Dream’;
‘Right now, is where you are … in a broken dream’
Especially so, for those allowing themselves to be subjected to non-stop propaganda about a ‘hyperinflation breakout’ or that silver’s going to ‘close the gap’ with gold.
So, it’s been nearly six months … where is it?
Meanwhile, back at the ranch during those same six-months, the press and YouTube grifters et al., were ignored.
Analysis was fact based; what’s the market saying is the most likely thing to happen?
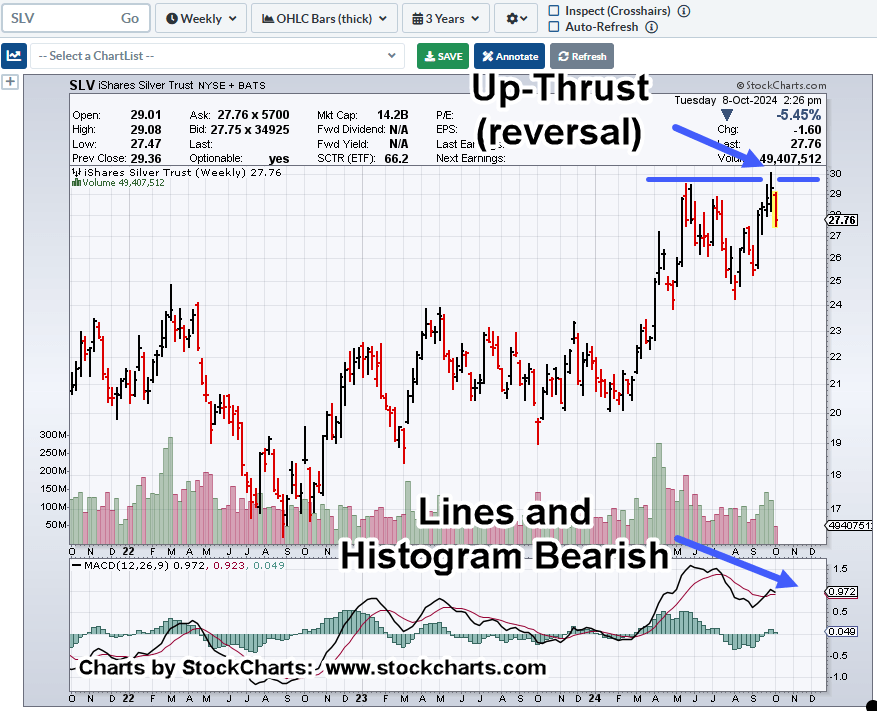
The last post, link here, said to watch out for a failed breakout (Wyckoff Up-Thrust).
Silver SLV, Weekly
SLV price action has posted a new weekly low; both MACD lines, and histogram, show bearish divergence.
Of course, anything can happen. Silver could move higher.
However, the chart says, at this point, probability for (significantly) higher action is low (not advice, not a recommendation).
Note: Posts on this site are for education purposes only. They provide one firm’s insight on the markets. Not investment advice. See additional disclaimer here.
Note: Posts on this site are for education purposes only. They provide one firm’s insight on the markets. Not investment advice. See additional disclaimer here.
With the reversal now obvious (since the Fed announcement, September 18th), we have the usual suspects putting out ‘content’ (here and here) letting you know what’s already happened.
In Prechter’s book, The Wave Principle of Human Social Behavior, he states, being part of the herd, is hard-wired into the brain.
Therefore, it takes diligent, consistent effort, to go against the mindless (limbic brain) herd if you’re going to make an objective observation.
So, let’s do just that, taking an objective look at the potential effects of the bond reversal.
Bonds (TLT proxy) began its reversal, rates higher, the day before the last Fed announcement.
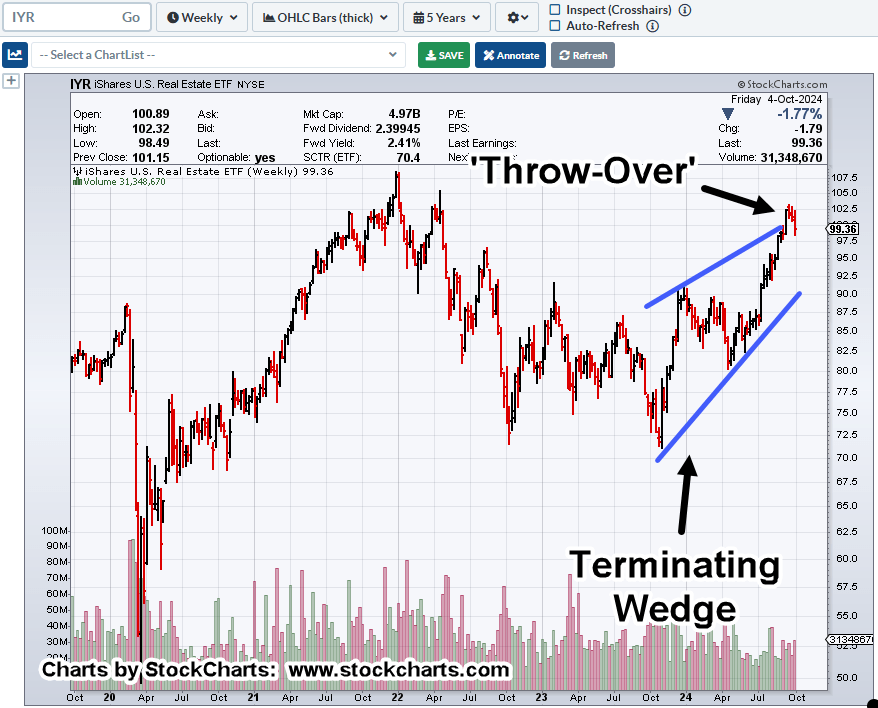
The IYR, reached its high that Wednesday, 9/18/24.
Real Estate IYR, Weekly
It’s been nearly three years since the all-time high in December, of 2021. The wedge shown below has been just over a year in the making.
The reversal action of the past few weeks can be seen in the ‘Throw-Over’ area of the chart.
If the wedge has been identified correctly, price action has now entered back into that formation.
Positioning
This post highlighted a short position was on the horizon.
Note: Posts on this site are for education purposes only. They provide one firm’s insight on the markets. Not investment advice. See additional disclaimer here.
We’re about to find out if silver (SLV), is headed for a breakout, sideways congestion and/or, outright reversal.
In a world that seems to be allergic to the truth (as serpentza, put it), we’re going to do just that; look at the truth, the price action itself.
The last update, link here, said to watch for an SLV, breakout that could fail, confirming a bearish divergence.
From the intro line, here we are.
We have the breakout.
All that’s missing is continuation higher or reversal (not advice, not a recommendation).
So, let’s go to the truth of the matter, the SLV chart.
Silver SLV, ETF, Daily
Years ago, Dr. Elder stated, when MACD histogram and MACD lines are parallel (bearish divergence), it’s a rare occurrence.
The coming week might be the deciding factor.
Before we leave this post, let’s throw in a bonus and consider the dollar ‘collapse’ narrative.
Dollar ‘Collapse’, Where?
Below is an updated chart of the dollar index.
Note the arrow to this link, posted nearly four years ago!
Dollar Index UUP, Weekly
It’s important to note, at the time the ‘Reversal Ready’ post was created, there was absolutely no-one (that was known) indicating the dollar index was headed significantly higher.
This is what’s meant by ‘Strategy’ in the About section.
Livermore was focused on what’s going (or likely) to happen in a big way.
Note: Posts on this site are for education purposes only. They provide one firm’s insight on the markets. Not investment advice. See additional disclaimer here.
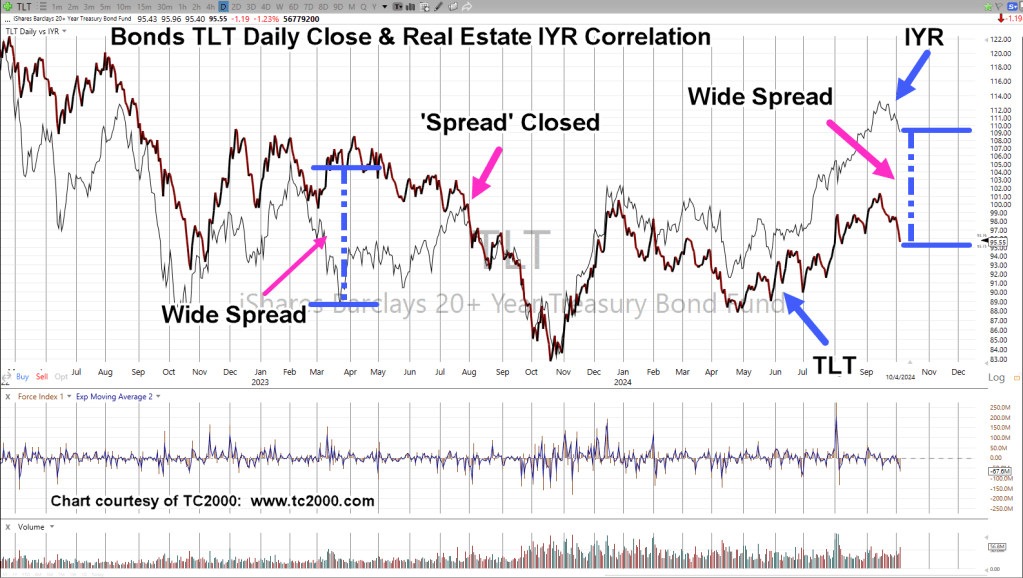
As the chart shows, real estate and bonds (interest rates) have been well correlated for over three years.
There are times, when that correlation gets ‘spread’; one market goes one way, while the other market goes … well, the ‘other’ way.
That time appears to be now.
Long Bonds TLT & Real Estate IYR, Daily Close
Note how the ‘spread’ eventually gets closed.
Note: The first spread on the left part of the chart took several months to close (completed in late July 2023).
The correlation remained near exact until about January 2024, where it began to diverge again.
Now, we’re spread with bonds heading lower (rates higher) helped along with the latest ‘jobs data‘.
Positioning
If time permits, we’ll go into price action posted yesterday and how this series of two IYR, price bars, yesterday, the day before, are (almost) exactly like DE (John Deere) price action shown by Daivd Weis on his video … except taking it from a short perspective.
Current position DRV-24-05, remains intact; stop now moved tentatively to the DRV session low for today (not advice, not a recommendation).
Note: Posts on this site are for education purposes only. They provide one firm’s insight on the markets. Not investment advice. See additional disclaimer here.
Note: Posts on this site are for education purposes only. They provide one firm’s insight on the markets. Not investment advice. See additional disclaimer here.
Note: Posts on this site are for education purposes only. They provide one firm’s insight on the markets. Not investment advice. See additional disclaimer here.