Jerrimiah Babe, Calls It
In probably his best video update since he stared in early 2015, he lays out the details of what’s ahead.
Although not well versed in the markets (and he says so), he has enough experience, life-knowledge, to understand the current potential and likely outcome.
That is, ‘relentless collapse’.
Those of us who have been getting ready for years, know that we still aren’t ready. How can anyone be fully ready for a complete systems breakdown.
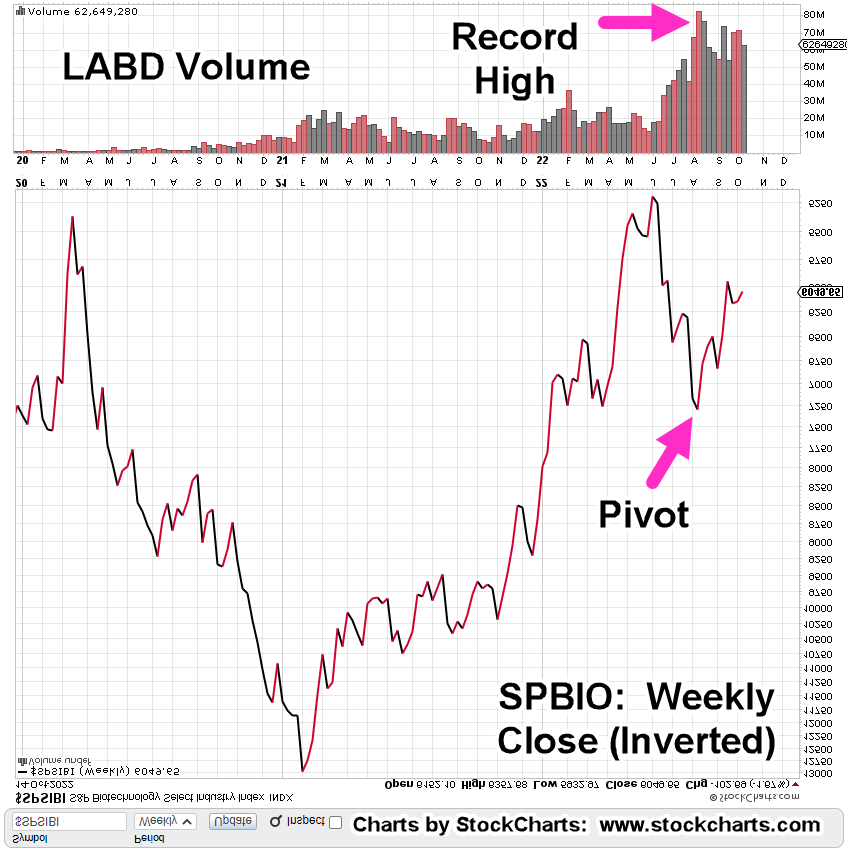
One ‘system’ that’s set for implosion and has been since before ‘The Speck’, is biotech.
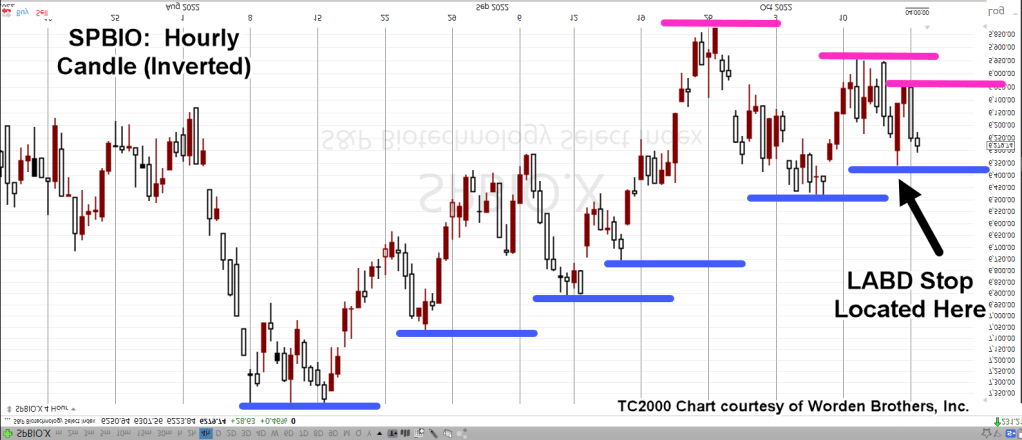
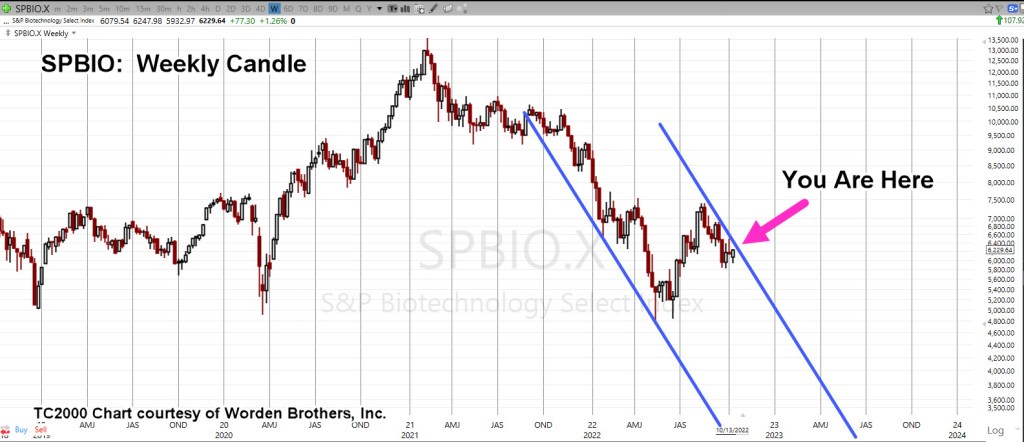
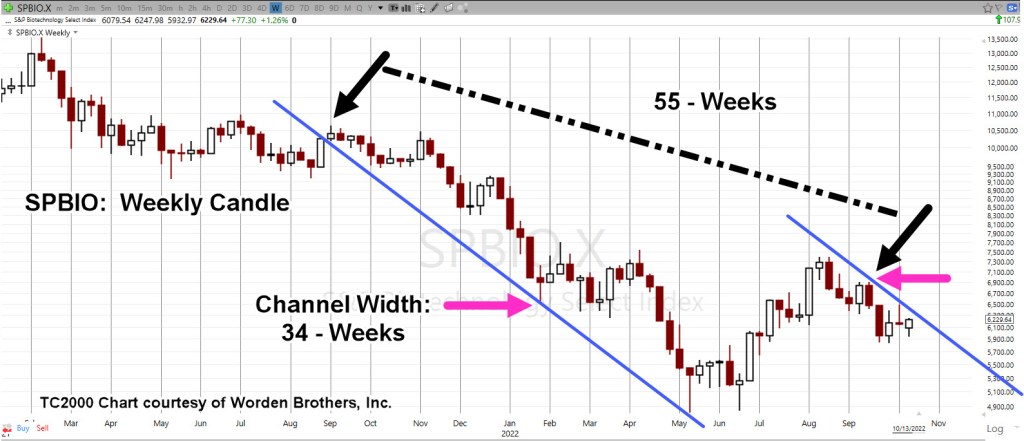
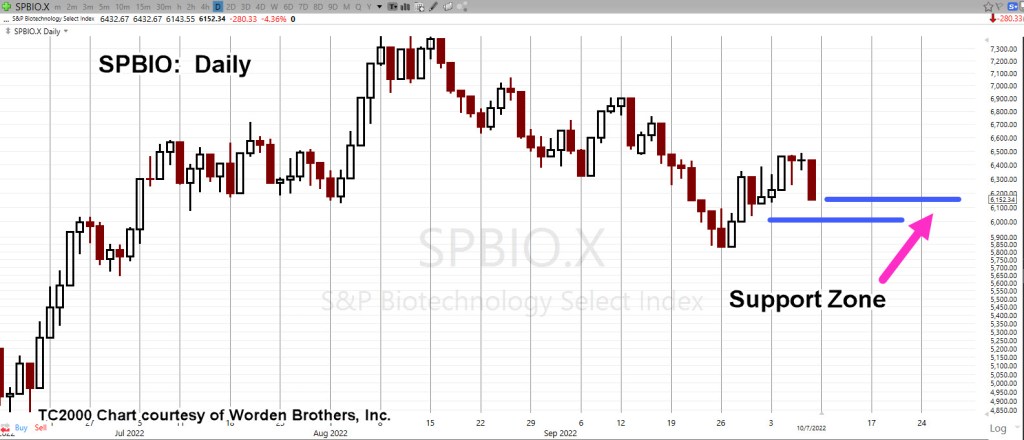
Biotech: Cue The Implosion
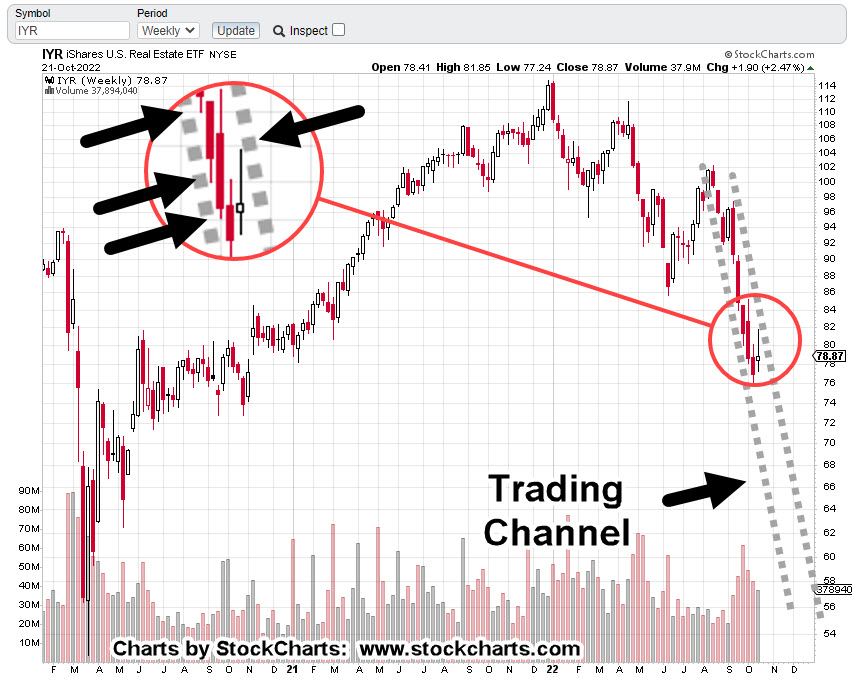
It’s been an on again, off again, back on, and so on, with this index (SPBIO).
Every day now, sometimes multiple times a day, we see the effects of their ‘protection’. Wheels are in motion and we’re most likely just getting started … for decades to come.
Yesterday’s Fed announcement, may have (finally) provided the up-thrust and reversal needed to get this index in a sustained down move.
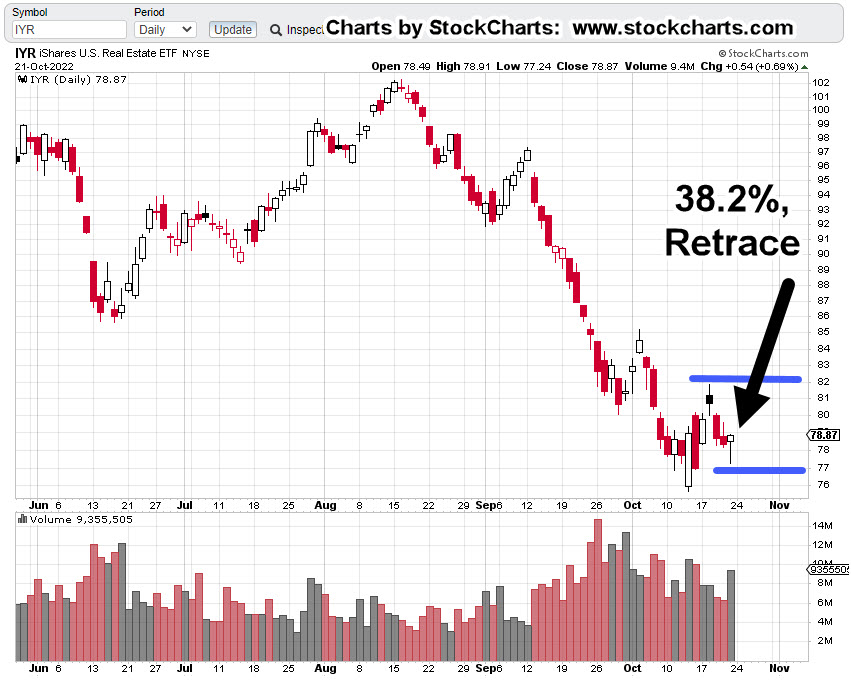
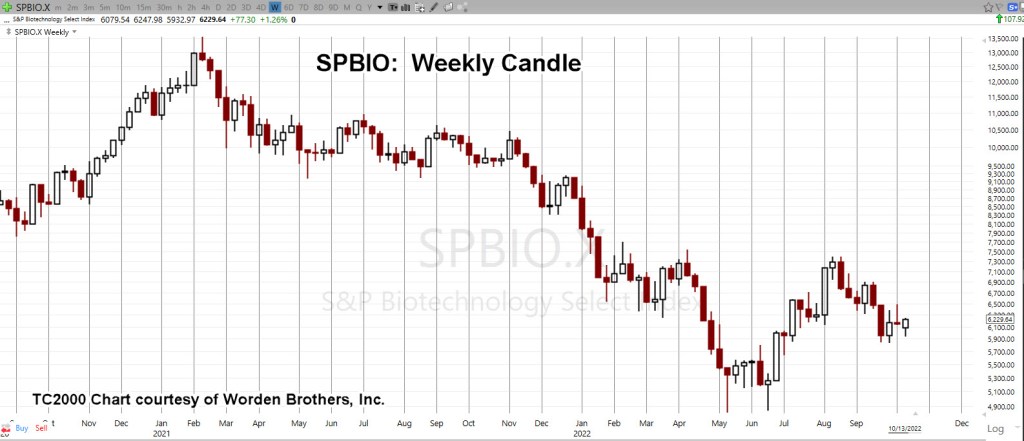
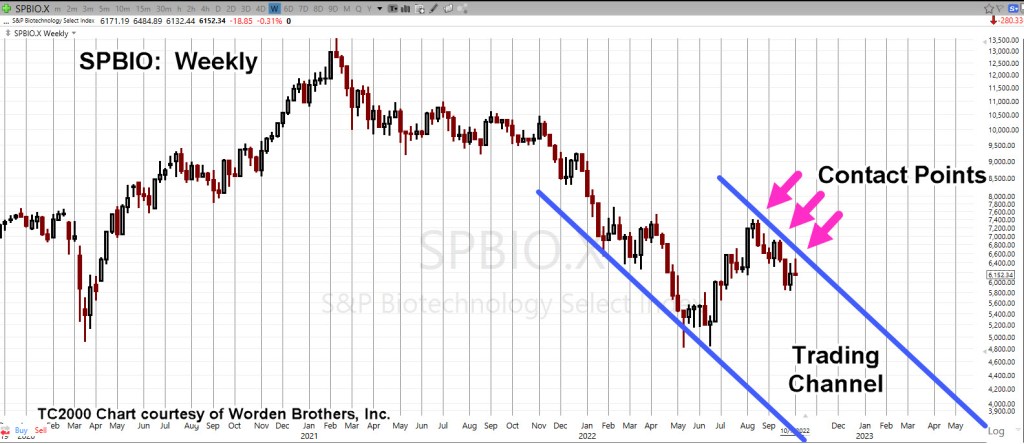
Biotech SPBIO, Daily Close
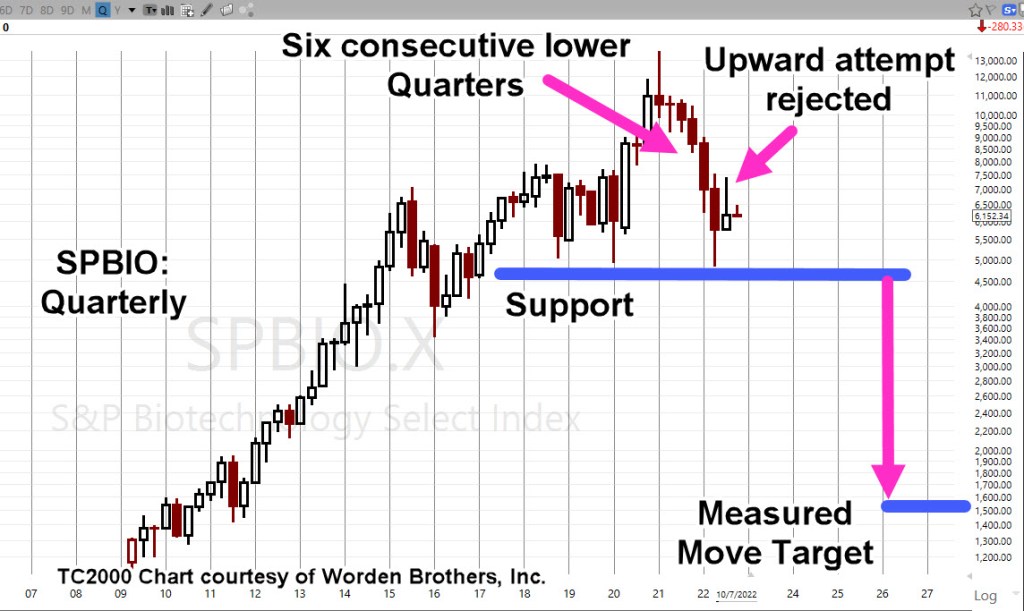
The daily chart shows the up-thrust test and reversal.

We’ll get into downside potential(s) in an upcoming post.
For now, the positioning remains unchanged (not advice, not a recommendation).
Positions, Market Stance (courtesy only, not advice).
TMF-22-01:
Entry @ 7.166, Stop @ 6.77
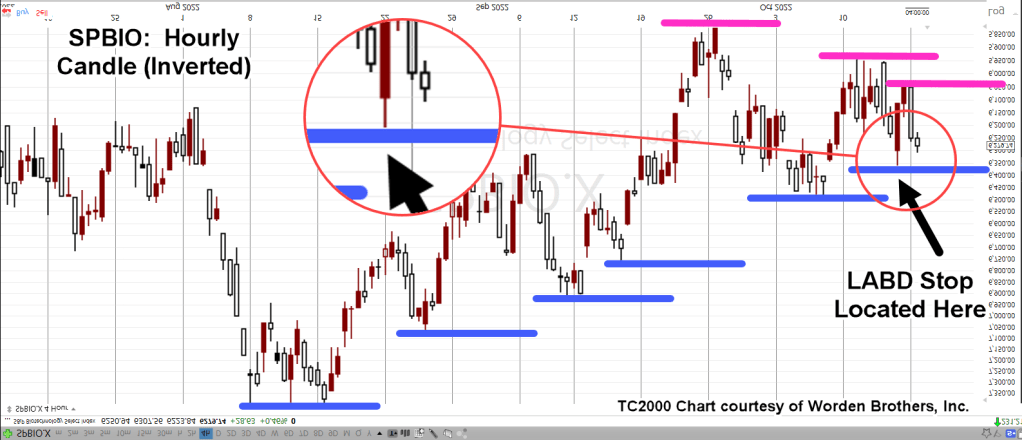
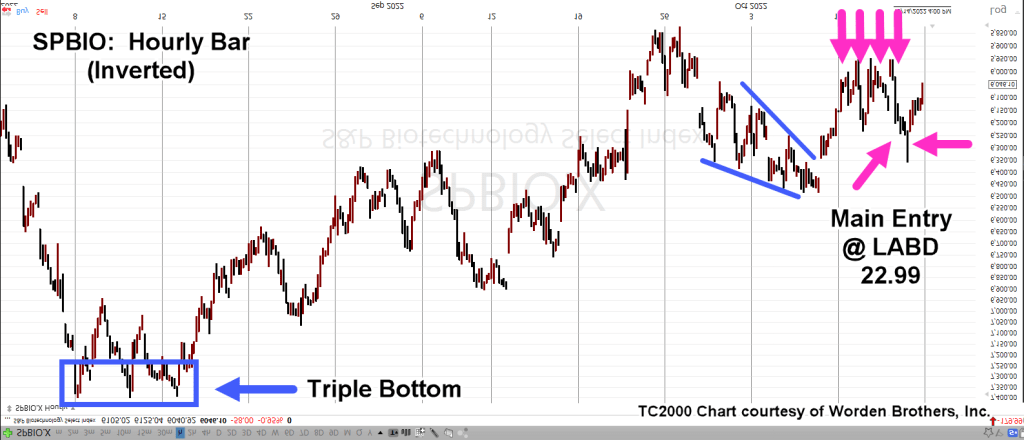
LABD-22-09:
Entry @ 19.88, 19.71, Stop @ 18.69
Note: Positions may be increased, decreased, entered, or exited at any time.
***, Indicates change
Stay Tuned
Charts by StockCharts
Note: Posts on this site are for education purposes only. They provide one firm’s insight on the markets. Not investment advice. See additional disclaimer here.
The Danger Point®, trade mark: No. 6,505,279