Subdivision To Decision: Biotech

Lower Highs … Higher Lows

As we’ll see below, SPBIO, has oscillated itself into a decision point.

From a positioning standpoint, my firm has taken a bearish stance on biotech via LABD (not advice, not a recommendation).

Yesterday’s update anticipated more SPBIO, downside which did not happen.

Instead, we got a test of the latest SPBIO, high.

This testing action does not negate the short via LABD, but it’s now very close.

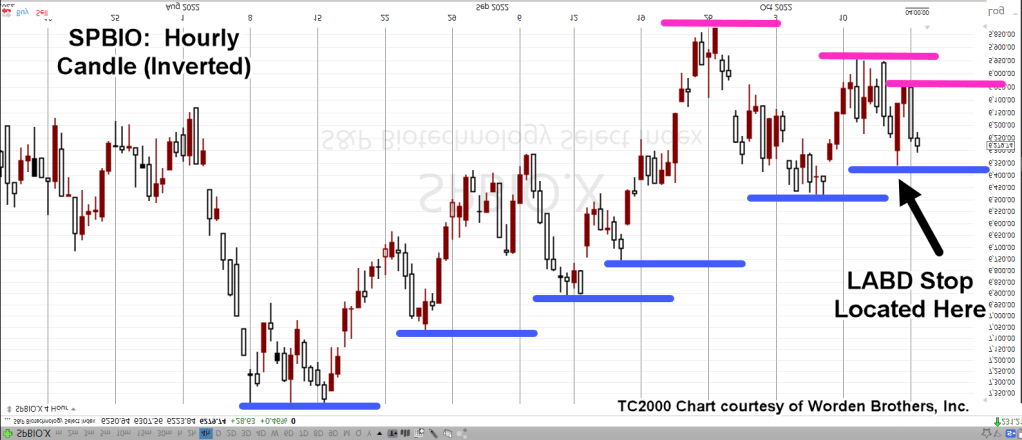
Once again, we’ll use an inverted chart of SPBIO to mimic the action of leveraged inverse fund LABD.

Biotech SPBIO, Hourly (Inverted)

The blue lines are subdivisions higher and the magenta, subdivisions lower.

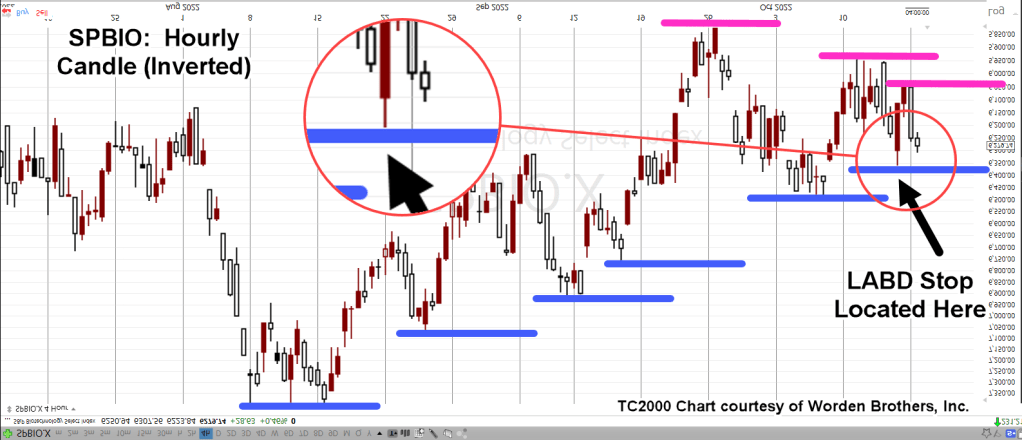
The zoom chart below shows just how close we’re to short-set-up, exit. If SPBIO posts a new daily high, by definition it will push past the LABD, stop and the trade will close (not advice, not a recommendation).

Strictly speaking, in the chart above, the ‘risk’, is the distance between the latest hourly low for SPBIO (Inverted) and the stop location at the black arrow.

That’s approximately 50-pts on the SPBIO, chart which corresponds to about 0.43pts for LABD.

After hours action (5:57 p.m., EST) has LABD, trading lower -0.37pts, or -1.68%, @ 21.68, but still above the prior stop location @ LABD 21.23.

Stay Tuned

Charts by StockCharts

Note:  Posts on this site are for education purposes only.  They provide one firm’s insight on the markets.  Not investment advice.  See additional disclaimer here.

The Danger Point®, trade mark: No. 6,505,279

The Usual Suspects

Special Biotech Edition

Bogart

An immense flood of data; research reports, lawsuits, expose articles and anecdotal evidence; every day, multiple times a day, something new.

Has the biotech technical (finally) lined up with the fundamental?

Those fundamentals are farther down but first, we’ll discuss the technical.

As a reminder, sometimes charts are inverted during analysis. This ‘trick’ was discovered years ago and is based on techniques used by Dr. Alexander Elder.

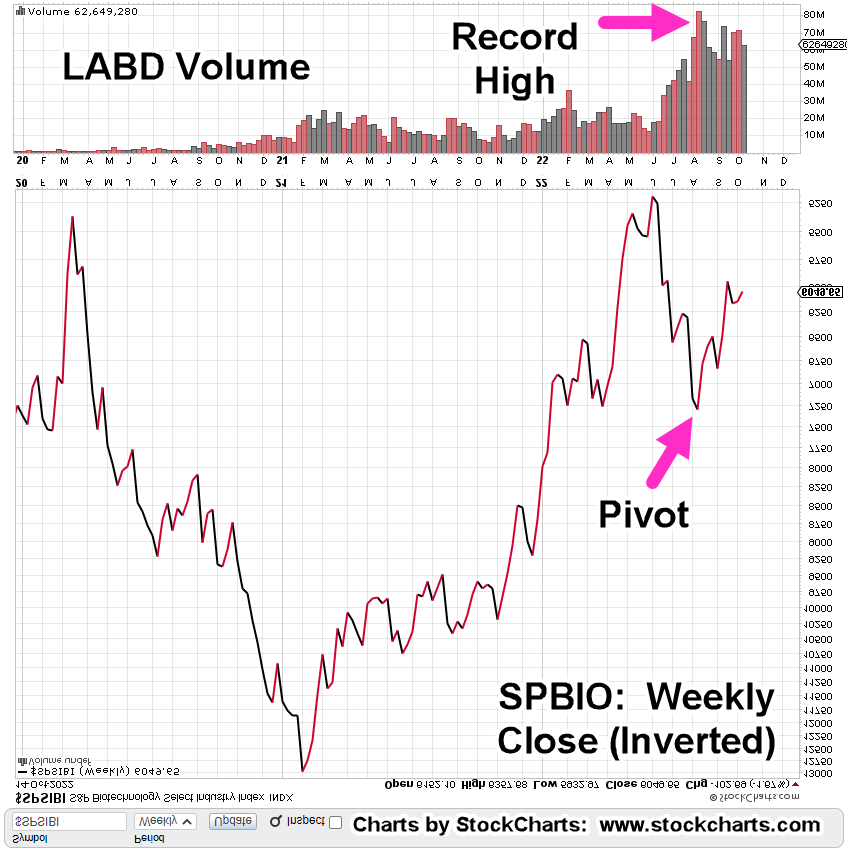
Biotech SPBIO, Weekly Close (Inverted)

We’ve taken the weekly closing chart of SPBIO ($SPSIBI, on StockCharts) and inverted it to mimic the action of inverse fund LABD.

The index has no volume; so LABD is used instead.

The magenta arrow shows the pivot point for the index, corresponds will all-time record volume on leveraged inverse LABD.

Next, we’ll get closer-in and look at the ‘pivot’ on the hourly chart (inverted).

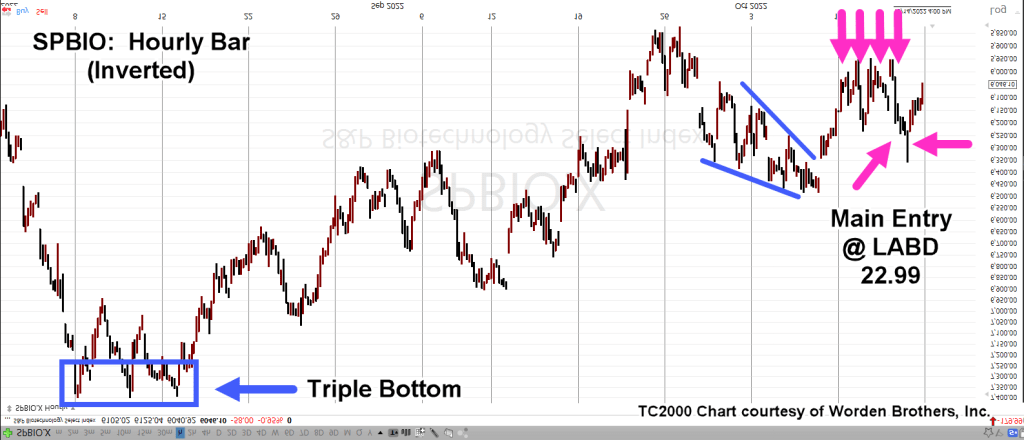
SPBIO, Hourly (Inverted).

The magenta arrows show successive positions (Livermore ‘probes’) entered (via LABD) before the main entry @ LABD 22.99, which was 90% of position size up to that point.

The next day (Friday) had a gap-lower open that was quickly reversed. Position size was increased by another 5%, at LABD 22.29 (not advice, not a recommendation).

Effective position equates to LABD 23.17

Price action pulled away steadily from the early morning levels, suggesting a sustainable reversal.

The Fundamentals

Some of this stuff, you just can’t make up.

Listed in somewhat chronological order, here they are (not an exhaustive list).

No. 1

Pfizer hires 600 to help document adverse events. Wasn’t it supposed to be ‘safe and effective’?

No. 2

Pilot Shortage

Fired/quit because they refuse to get ‘protection’.

A possible corollary to what’s happened, via injection, we have this.

No. 3

Pfizer, nobody wants their product … after the rollout.

No. 4

Who could it be?

Previously unknown (or rare) problems and illness now starting to accelerate.

No. 5

We’re here to help.

No. 6

You mean, it was all a lie?

No. 7

The real reason for getting ‘tested’?

No. 8

What did the media know and when did they know it?

No. 9

It’s still a ‘suggestion‘ but the payouts to family members are real.

No. 10

It’s over … and then it’s not.

No. 11

We’ll keep it quiet, so no feelings get hurt.

No. 12

How bad is your batch? Let’s see.

No. 13

You mean, it was never tested? I’m shocked.

No. 14

After all that, maybe we can give it another shot.

No. 15

A potential infinite number of complications … nothing to see here.

No. 16

Getting away with it? Not so fast.

No. 17

Just had a heart attack? We can help.

No. 18

Limited Hangout? You decide.

No. 19

Lastly, this is what it’s really all about.

Recorded years ago. Did her ‘prophecy’ come true?

Stay Tuned

Charts by StockCharts

Note:  Posts on this site are for education purposes only.  They provide one firm’s insight on the markets.  Not investment advice.  See additional disclaimer here.

The Danger Point®, trade mark: No. 6,505,279
Wheels Come Off … Biotech

Unraveling, Quickly

This just out on ZeroHedge:

An Epoch Times article, using excerpts from a Lancet Report, linked here.

It’s best to let the reader sort out what it all means, arriving at one’s own conclusions.

Of course, the obvious problem, the ‘elephant’ is not addressed directly.

However, VAERS is quoted in The Epoch Times article, thus giving it legitimacy.

Leading The Downside

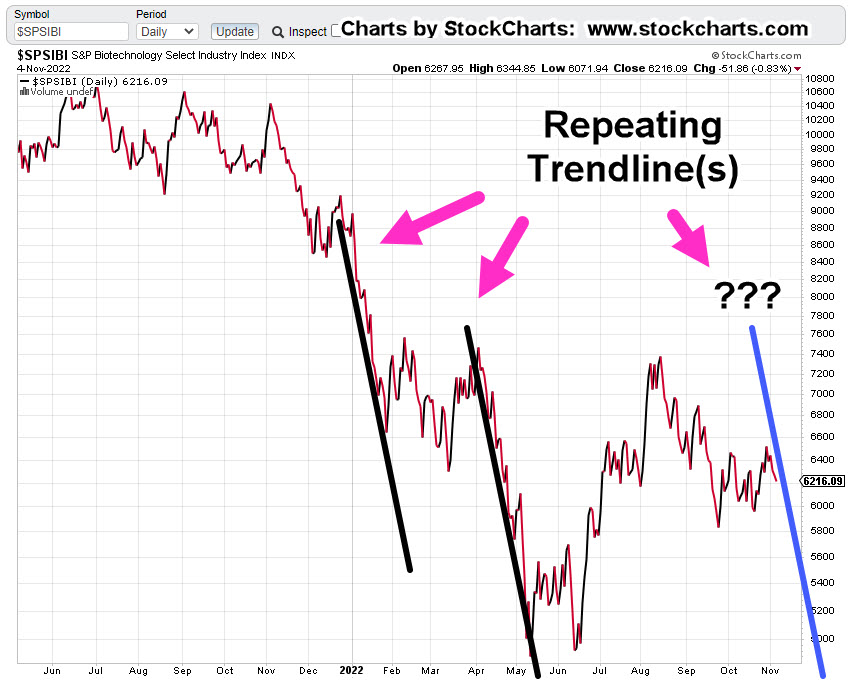
For some time, this site’s highlighted, biotech (SPBIO), as unique to all other indices save GDX, and GDXJ.

That is, it’s down the most since the bear market started.

As of today’s close, it’s down over – 54%, from all-time highs while the S&P is down only – 23.7%.

As documented over several years, the sector’s unique; it’s at risk (more than other indices) to implosion.

With today’s close, it looks like we’re at a critical juncture.

Biotech SPBIO, Weekly

The unmarked weekly chart

Compressed, with added trendlines.

It’s an obvious trading channel of immense size … but so is nearly everything else concerning these markets. We’re operating at unprecedented scale in unprecedented times.

But wait, there’s more.

The trading channel has Fibonacci time correlation(s).

We’ll expand the weekly chart for more clarity.

From channel entry, week ending 9/3/21, to the right-most contact point (week ending 9/16/22), is Fibonacci 55-Weeks.

Channel width measured from week ending 1/28/22, to the same contact-point, week ending 9/16/22, is a Fibonacci 34-Weeks.

We’re at The Danger Point®

Positions & Current Stance (courtesy only, not advice).

The following is the positioning of my firm’s main (largest) account.

DRV-22-04:

Entry @ 66.463, Stop @ 63.98

Discretionary exit (today) @ 75.96***

Trade Closed

LABD-22-08:

Entry @ 25.1278, 24.735, 26.025***, 22.99***, Stop is Open (to be set at next session)

***, Indicates change

Note: Positions may be increased, decreased, entered, or exited at any time.

Stay Tuned

Charts by StockCharts

Note:  Posts on this site are for education purposes only.  They provide one firm’s insight on the markets.  Not investment advice.  See additional disclaimer here.

The Danger Point®, trade mark: No. 6,505,279
Sentiment Shift … Biotech

Was Friday, The Day?

Is the tide (finally) going out for biotech?

The end of the prior update, shows a lot coming to the surface.

So much, that it can’t be ignored.

Also coming out on Friday, was this report.

Is it all too much, price action has finally reversed? We’ll analyze that potential below.

Biotech SPBIO, Quarterly

First, the big picture.

There have been six consecutive lower quarters … the most of any major index

What’s not labeled above, is an apparent Head & Shoulders pattern forming; the arrow showing the rejection of the upward move could be the top of the Right Shoulder.

The left shoulder is considered to be the eight quarters that span, 6/29/18 – 3/31/20.

If it’s an H&S, and if the support is penetrated, the measured move target is shown.

That’s a lot of ‘ifs’.

Moving on to the weekly, we see confirmation of the right-side trendline. Also shown is the potential trading channel.

Biotech SPBIO, Weekly

Price action could still break out to the upside from the channel line.

For that to happen, there would need to be some kind of huge catalyst.

So far, nothing out of the ordinary other than the typical Ebola outbreak and/or, radiation poisoning 🙂

Downside Reversal Probabilities

So, last Friday was decidedly down. If we’re in a reversal, what’s the next likely thing to happen?

For that answer, we go to the daily chart.

Biotech SPBIO, Daily

The blue lines are a minor support zone.

If we are in a reversal, a lower open at the next session (into the support zone) weights probabilities to the downside.

If that happens, expect price action to attempt to ‘test’ Friday’s wide bar by moving higher … at least temporarily.

If there’s a higher open instead, it does not necessarily negate the reversal, but it does weaken the case.

It may mean there’s more upside testing and/or, the beginnings of a move to much higher levels.

Stay Tuned

Charts by StockCharts

Note:  Posts on this site are for education purposes only.  They provide one firm’s insight on the markets.  Not investment advice.  See additional disclaimer here.

The Danger Point®, trade mark: No. 6,505,279

Tesla … Set To Implode

Watch The Tape

Two-year uptrend, broken.

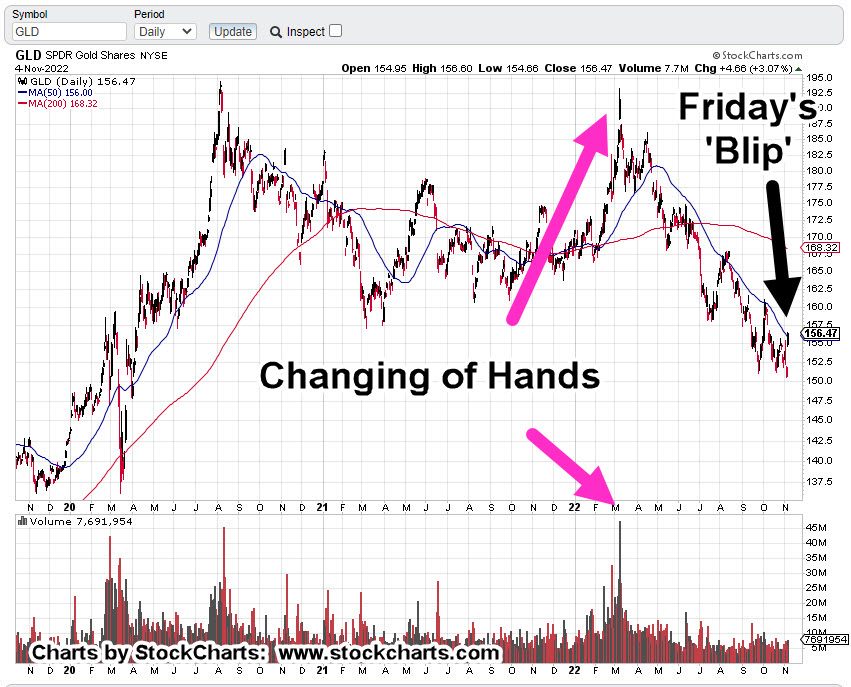
A year’s-worth of ‘distribution’ from strong hands to weak.

Ten days from now is the next TSLA, earnings release.

With TSLA, price action approaching The Danger Point®, that earnings release is likely to be a catalyst.

The monthly chart has the trendline (and channel) break along with the distribution phase.

Tesla TSLA, Monthly

Note, each thrust attempt higher (magenta arrows) has subsequently failed.

Thrusts following the first one, are at lower levels.

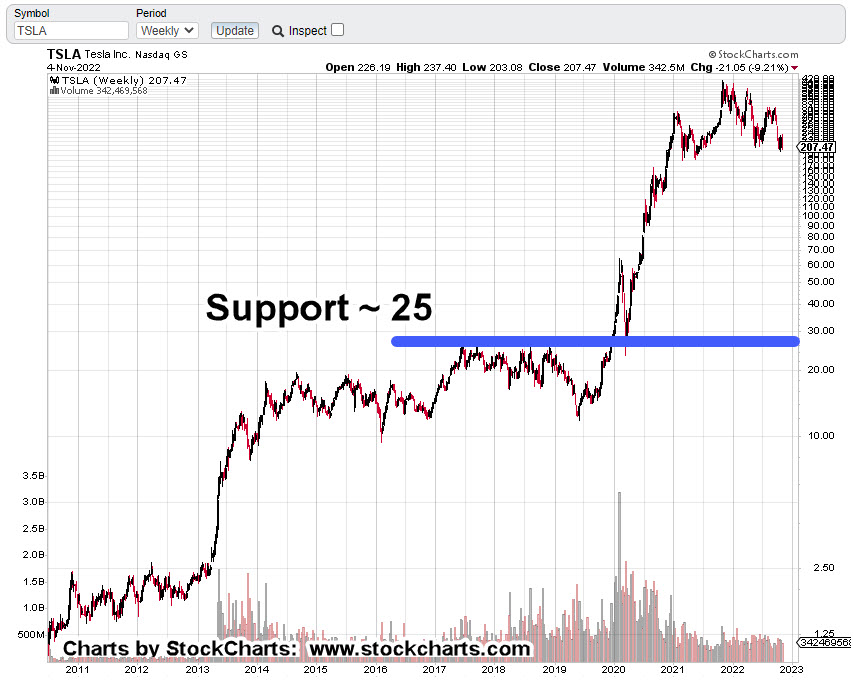
The weekly chart below, shows what we’re looking for; penetration of support to potentially set up a short-trade (not advice, not a recommendation).

Tesla TSLA, Weekly

When or if that penetration takes place, depending on the depth of the thrust, we’ll have a Wyckoff spring set up … that ultimately is expected to fail.

Ways To Trade

As if on cue and possibly in anticipation of TSLA fireworks, there’s a long and short ETF, for just this ticker.

Released just months ago; TSLS, a 1X inverse (bear) TSLA. The bull side has 1.5X leverage with TSLL.

TSLS, has a 100% maintenance requirement and TSLL, has the same.

Or, one can short directly.

There’s no dividend and the broker used by my firm shows TSLA, has no borrowing restrictions other than a 40% maintenance requirement (not advice, not a recommendation).

Then, there are options … we’ll discuss those if some kind of high probability opportunity presents itself.

The Masses

Let’s not forget the herd. What are they doing/saying?

With that in mind, a random check of our favorite holding pen, SeekingAlpha, has oodles of TLSA analysis.

The most recent is actually quite good from a thoroughness perspective. It admits/discusses the downward pressures and identifies the support/resistance levels discussed above.

The problem is the mass psychosis.

It’s the EVs are the way’ mantra as if Bhagwan Shree Rajneesh himself, was communicating directly.

With the winter carnage in Europe just weeks away, we’re about to find out how green ‘electrics’ hold up when there is, well, no electricity.

Back to Biotech

While all of the above is transpiring, the real Black Swan continues to emerge; the latest here, here and here.

This event is happening now; the effects of which will last our lifetimes.

It’s massive and world-wide; likely to override any mainstream (traditional 60/40, type) analysis.

After letting go of the biotech short for the seventh time, two days later, this past Friday, it decides to reverse.

We’ll cover that in the next update.

Stay Tuned

Charts by StockCharts

Note:  Posts on this site are for education purposes only.  They provide one firm’s insight on the markets.  Not investment advice.  See additional disclaimer here.

The Danger Point®, trade mark: No. 6,505,279
After The Close …

The Tape Is Always Right

Once again, stopped-out of the biotech short (not advice, not a recommendation).

Call it bad timing, incorrect analysis or whatever. Every opportunity for SPBIO, to go lower is being thwarted … so, no more for now.

On the flip side, the potential collapse in silver has been discussed over the past few weeks, here, here, here and here.

Looking at the chart below, not only do we have a Wyckoff Up-Thrust, but unless it’s negated by subsequent price action, we’ve got an ‘island gap reversal’ as well.

Prices can’t be sustained at yesterday’s higher level.

Silver SLV, Daily

As previously discussed, very late in the session as SLV, price action rose higher, reducing the risk, a short was entered via Leveraged Inverse Fund ZSL @ 28.08 (not advice, not a recommendation).

The trade is identified as ZSL-22-01.

An obvious hard-stop would be yesterday’s high in SLV, or the corresponding low in ZSL @ 26.55.

Stay Tuned

Charts by StockCharts

Note:  Posts on this site are for education purposes only.  They provide one firm’s insight on the markets.  Not investment advice.  See additional disclaimer here.

The Danger Point®, trade mark: No. 6,505,279
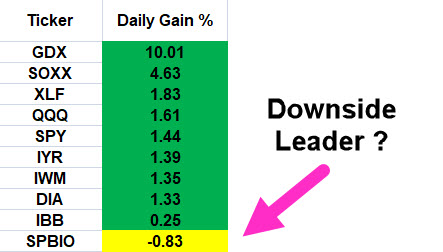
Biotech Reversal … The Big One ?

Seventh Time A Charm

‘Get right and sit tight’ … Livermore

Well, it’s the ‘get right’ part that’s the challenge.

As for Biotech SPBIO, it’s no secret it’s been on again, off again, then back on again.

So, it is. Based on current price acton, yesterday was a head-fake into the 38% retrace.

This morning’s session attempted to move higher but was rejected within the first 3-minutes.

Once again, the short trade via LABD, has been re-established (not advice, not a recommendation).

We have LABD-22-07; entered at 21.88, with a stop at the session low of 20.88.

At this juncture (10:50 a.m., EST), Inverse Fund LABD, is pushing higher.

The hourly chart of SPBIO, shows the 38% retrace and reversal.

Biotech SPBIO, Hourly

Expanded version.

As of this post (10:50 a.m., EST) price action has just filled the gap from yesterday’s session. Some amount of SPBIO, retrace higher (below this morning’s highs) is reasonable.

Summary

The groundwork has already been laid over the past few months and even as far back as one year, why this sector may be set for a stupendous decline.

Of course, we don’t know if ‘this is it’, until it’s all over.

For now, the LABD position is in the green with a hard stop at the session low of 20.88 (not advice, not a recommendation).

Stay Tuned

Charts by StockCharts

Note:  Posts on this site are for education purposes only.  They provide one firm’s insight on the markets.  Not investment advice.  See additional disclaimer here.

The Danger Point®, trade mark: No. 6,505,279

Sanity, Amidst Chaos

Biotech About To Go ‘Up-Thrust’

With about three-minutes to go before the close, the stop was hit at LABD: 20.90.

Short position LABD-22-06, is closed (not advice, not a recommendation).

The ‘timing‘ analysis was overridden by the market about mid-session; there’s obviously something at work on a longer timeframe.

We’ll look at what that might be with the 4-Hour chart of biotech SPBIO.

SPBIO, 4-Hour Candle

The chart shows price action pushing past the 38% level just before the close.

Unless there’s a major gap lower at tomorrow’s open, the stage is set for SPBIO, to push on higher to the 50%, retrace.

However, another set-up could be in the works.

We’re going back to our usual trick of taking the above chart an inverting it to show what inverse fund LABD would look like with no tracking errors.

SPBIO, 4-Hour Candle (Inverted)

Now we see what may be happening.

A decisive push below support, puts the inverted chart (i.e., LABD) in ‘spring’ position.

Conversely, SPBIO, would be in ‘up-thrust’ condition at the same time.

Stay Tuned

Charts by StockCharts

Note:  Posts on this site are for education purposes only.  They provide one firm’s insight on the markets.  Not investment advice.  See additional disclaimer here.

The Danger Point®, trade mark: No. 6,505,279

Timing The Market

Less Time Pushing Higher

The danger of this situation can’t be over emphasized.

Not only do market levels and depth of penetration need to be watched but also the time; time spent pushing higher or lower.

Biotech SPBIO, indeed moved higher and penetrated our previously stated 6,384.50 level; here’s the important part: As of now (11:34 a.m., EST), it’s struggling to hold that level.

Looking at leveraged inverse fund LABD, on a 30-minute basis, the market itself is showing, each successive thrust lower (higher for SPBIO), spends less and less time at the new level.

Like a drowning swimmer coming up for less air each time.

The market (SPBIO) may get itself together and somehow continue higher.

However, at this point, we’ve got a hard stop; this morning’s LABD low, of 20.90 (not advice, not a recommendation).

SPBIO, Leveraged Inverse Fund LABD: 30-minutes

Today’s close is likely to be important.

A failure to push lower for LABD, may indicate “we’re done” and now ready for a decisive reversal.

Stay Tuned

Charts by StockCharts

Note:  Posts on this site are for education purposes only.  They provide one firm’s insight on the markets.  Not investment advice.  See additional disclaimer here.

The Danger Point®, trade mark: No. 6,505,279
Between Sucess … and … Failure

‘Inside Days’ For Biotech

The market will attempt to hypnotize all participants.

That’s what’s happening now.

This, just out from ZeroHedge; buying ‘puts’ at the bottom and selling out or timing-out at the highs.

Typical bear market behavior

Our chosen sector for going short, biotech (SPBIO), is not immune to hypnotic action (not advice, not a recommendation).

Yesterday was an ‘inside day’, staying within the confines of the prior day’s action.

We’re still at The Danger Point®; it can go either way.

In the pre-market (8:55 a.m., EST), biotech along with the overall market is set to open higher.

How much higher, is the key as we’ll see below.

Biotech SPBIO ($SPSIBI), Daily

The daily chart includes our ‘trick’ previously discussed of using LABD volume to show supply/demand forces.

As price action rose to test the top of the range, volume decreased significantly.

Commitment to the upside is weak (at this point).

The zoom version below shows more detail.

From the LABD pre-market action, the best that can be determined, we’re still within the range of Friday’s (9/30/22), bar.

As shown, the level to watch is the SPBIO high of 6,384.50.

A decisive penetration of this high indicates potential retrace to 50%, at least.

In that case, the short in LABD (LABD-22-06), will be exited (not advice, not a recommendation).

Stay Tuned

Charts by StockCharts

Note:  Posts on this site are for education purposes only.  They provide one firm’s insight on the markets.  Not investment advice.  See additional disclaimer here.

The Danger Point®, trade mark: No. 6,505,279

.