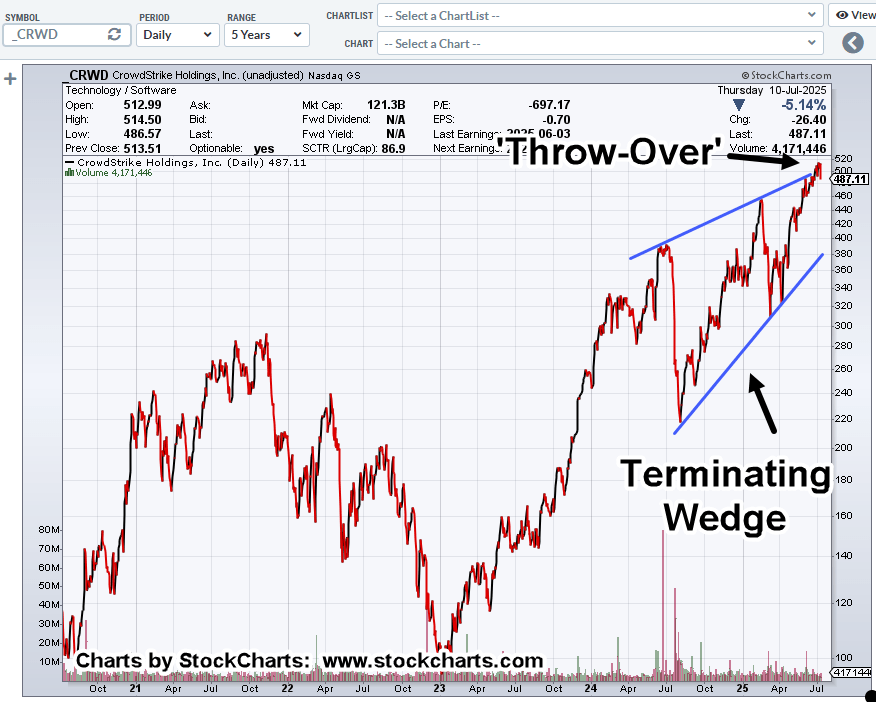
Part of the wedge ‘Throw-Over’ as we’ll see in the chart, may have been in response to this, link here.
With the ‘all clear’ going out to millions of ‘investors’, what could go wrong?
Looking at it from a strictly Wyckoff, and chart pattern perspective (a la Richie Nasso), probabilities favor a reversal (not advice, not a recommendation).
CrowdStrike CRWD, Daily Close
Price action has entered back into the pattern.
Positioning
No active positions in CRWD … yet.
After yesterday’s trend-break (into the pattern), there’s a possibility for a rally to test.
Other Markets
SOXX short, was re-opened as SOXX-25-04, with stop at yesterday’s high (not advice, not a recommendation).
Wal-Mart short, WMT-25-04, remains active, with stop being moved down to (near) the last session high of 96.91 (not advice, not a recommendation).
Note: Posts on this site are for education purposes only. They provide one firm’s insight on the markets. Not investment advice. See additional disclaimer here.
As a trading professional, you must know (or have a good idea) who’s on the other side of your trade.
Whom are you competing against?
It’s just one of many questions to be asked (along with price action) when estimating the opportunity; whether long or short.
Well, ladies and gentlemen, here’s some of what’s on the bullish side of Nvidia, link here.
So, according to the video, tech stocks (and Nvidia) went down because of the U.S. 10-yr Treasury?
Think about it. ‘Likes’ vs. ‘Dislikes’ on that video (as of this post) are over 13:1.
How about this:
Nvidia went down because it posted the largest ever price action down-thrust; then, went through a test of that action, completed the test, then reversed to the downside.
Wow, sounds so clear when put that way. 🙂
With that, let’s get back to reality.
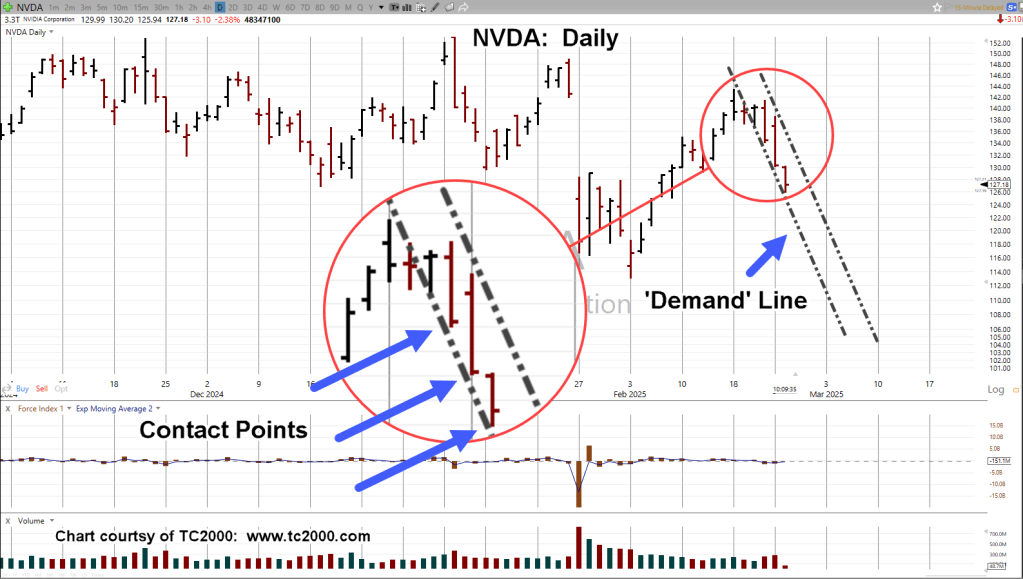
Nvidia NVDA, Daily
Earnings are scheduled for after-hours tomorrow. Things could get interesting.
In the meantime, we have a demand line and possible channel.
As of this post (10:47 a.m., EST), NVDA has sliced through support at the 129 – 130, level with ease.
We should expect a test of that support. However, at this point, price action is quite weak (not advice, not a recommendation).
Note: Posts on this site are for education purposes only. They provide one firm’s insight on the markets. Not investment advice. See additional disclaimer here.
What kind of idiot would think that gold (GLD) is going lower?
Well, for starters, it’s not what one ‘thinks’ that’s important.
Way back, when I was being mentored by the late David Weis, he never started our sessions with ‘what do you think’.
No, he always started by presenting a chart and then asking (and I quote), “What do you see?”
It was never ‘what’s the Fed doing’ or ‘what’s Cramer saying’ (that’s an easy one), or ‘what are earnings’ or any other number of useless, distracting rabbit-holes.
“What do you see?”
With that, we’re going to look at the long-term chart of gold (GLD) on a weekly close basis.
Gold (GLD) Weekly Close
With the passing days, weeks and now months, we can see there’s been a significant, potentially long-lasting reversal to the downside.
The prior report linked here, contains no fewer than seven other links to gold (GLD) that identified ‘changing of hands’ in various stages as it transpired.
Slow Motion Train-Wreck
So far, events in gold have been moving slowly and thus hypnotizing the gold bulls.
It was nearly two-years (20-months) between the Wyckoff Up-Thrust high (8/6/20), and the test of that high (3/8/22).
Enough time to put everybody to sleep.
At this point, GLD is back down near support levels … another bounce higher is not unreasonable.
However, it’s trading in a downward channel (not shown) that’s declining at approximately – 30%, annualized.
The above linked report presents long-term downside targets for GLD (not advice, not a recommendation).
The ‘Event’
As Pinball Preparedness puts it, each day that passes brings us one day closer to ‘the event’.
None of us in the proletariat know what the event will be.
Note: Posts on this site are for education purposes only. They provide one firm’s insight on the markets. Not investment advice. See additional disclaimer here.
Evidently, according to this out on ZeroHedge, stocks will be a good buy when the Fed pivots; apparently getting back to 2%, inflation.
So many lies, half-truths and pre-suppositions, all in one sentence. Let us count the ways.
Actually, let’s not.
At this point in time, one does not want to draw any undue attention.
A better idea is to see what the market’s saying about itself. This is the crux of Wycoff analysis.
Wyckoff stated a century ago (1902, to be exact), stock prices moved based on an energy of their own; at times, completely disconnected from fundamentals.
Looking at those markets and from my own tracking spreadsheet, 106, indices or equities are currently monitored.
That list will change over time but it’s typically around 100 or more ticker-symbols.
Of that number, the following are those currently in a downward sloping trading channel.
Note: Posts on this site are for education purposes only. They provide one firm’s insight on the markets. Not investment advice. See additional disclaimer here.
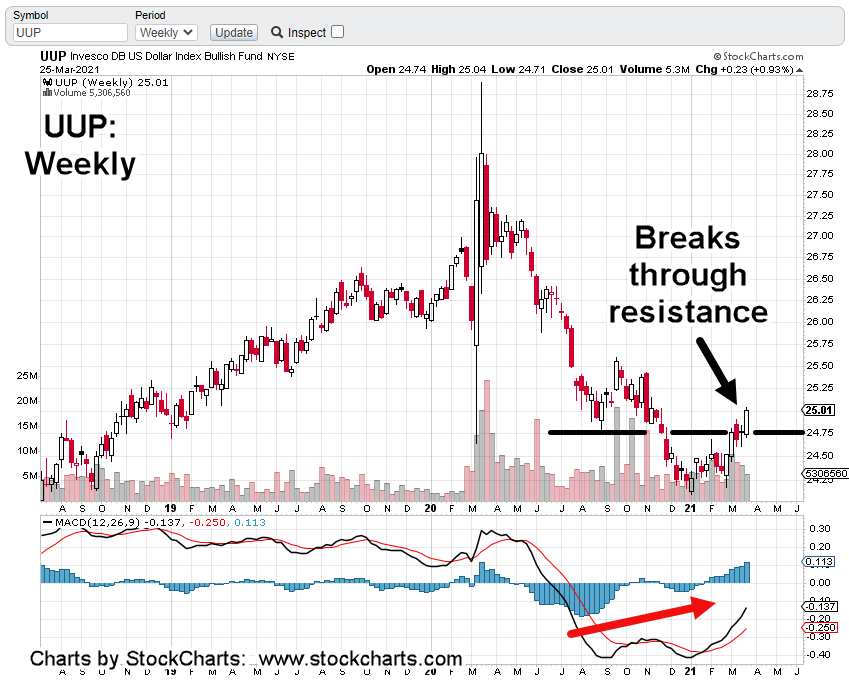
Bonds could be reversing but have already pushed rates high enough (long enough) to choke-off critical sectors of the economy like here and here.
Now we see the dollar has bottomed as well.
It looks like a strong multi-month (or year?) rally. Correspondingly, gold is weak. The overall markets are stretched to ever-livin’ extremes; never before seen.
Whenever this baby pops, try logging on to chaos, or exit any position (except maybe for the long bond).
Our approach then (not advice, not a recommendation), is continue work on positioning short. So far, the ‘project’ is taking small hits in those attempts. We’ll see how basic materials (SMN) works out today.
Note: Posts on this site are for education purposes only. They provide one firm’s insight on the markets. Not investment advice. See additional disclaimer here.