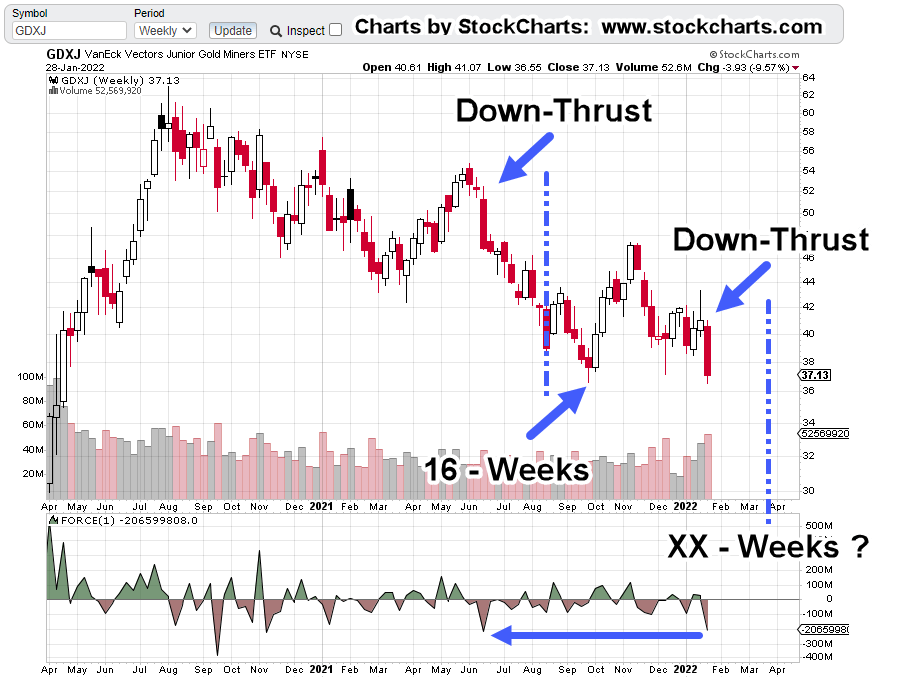
The last time weekly down-thrust energy (Force-Index) was this deep, GDXJ price action ratcheted lower for 16-weeks before a significant reversal.
That reversal took place at support where GDXJ, is now. However, back then (week of October 1st), contact with support was on weakening Force-Index; this time, it’s increasing.
It’s reasonable to expect an attempt to rally in the coming week … but with this much down force, a successful rally is not the high-probability outcome.
Summary:
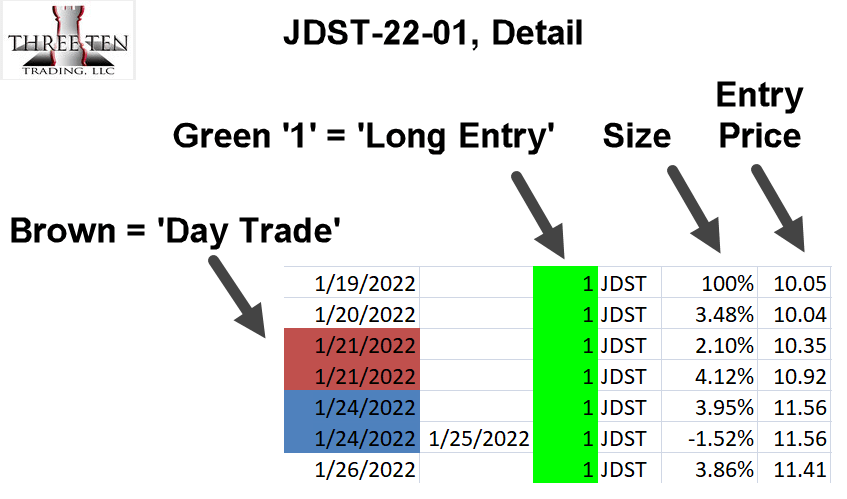
One possible clue for exit of short position, JDST-22-01, is to look for continued downside action but with divergent (lessening) thrust energy; not advice, not a recommendation.
Note: Posts on this site are for education purposes only. They provide one firm’s insight on the markets. Not investment advice. See additional disclaimer here.
Note: Posts on this site are for education purposes only. They provide one firm’s insight on the markets. Not investment advice. See additional disclaimer here.
In a rare (media) event, the answer may be included in the above link.
The analyst in the article is quoted as being “surprised” the actual metal, gold, has not moved appreciably higher as a result of massive ETF inflows.
Since before 1980 when gold reached an all time high (back then) of $850/oz., its’ been ‘inflation, inflation, inflation’.
That Was Then:
It’s been forty-plus years (some would argue more) of non-stop inflation.
At some point, the music stops; we seem to be very close.
Everybody stampeding into gold and related markets (i,e., the miners) appears to be fighting the last war: Inflation.
Where We Are Now:
In Steven Van Metre’s latest update, he presents just how precarious and fragile is, the current market environment.
It’s a short video, just under 13-minutes; it’s worth the time.
The internet’s been the great equalizer and so everyone has access to the same information.
After watching his video (time stamp 6:07), it raises the question as to why anyone, or any financial manager, would want to be long in the equity market (not advice, not a recommendation).
To Be, Or Not To Be, ‘Certified’
Let’s just throw in that ‘certified’ management actually underperforms non-certified peers. At least in the case of the CFA (Chartered Financial Analyst).
In the article above, it even states that ‘experience’ is a deciding factor. Imagine that. 🙂
One has to be smart to pass the certification tests. No doubt. However, ‘smart’ does not equal ‘savvy’.
Taking all of this into account, it’s reasonable to think we’re possibly just one ‘fat-finger’ away …
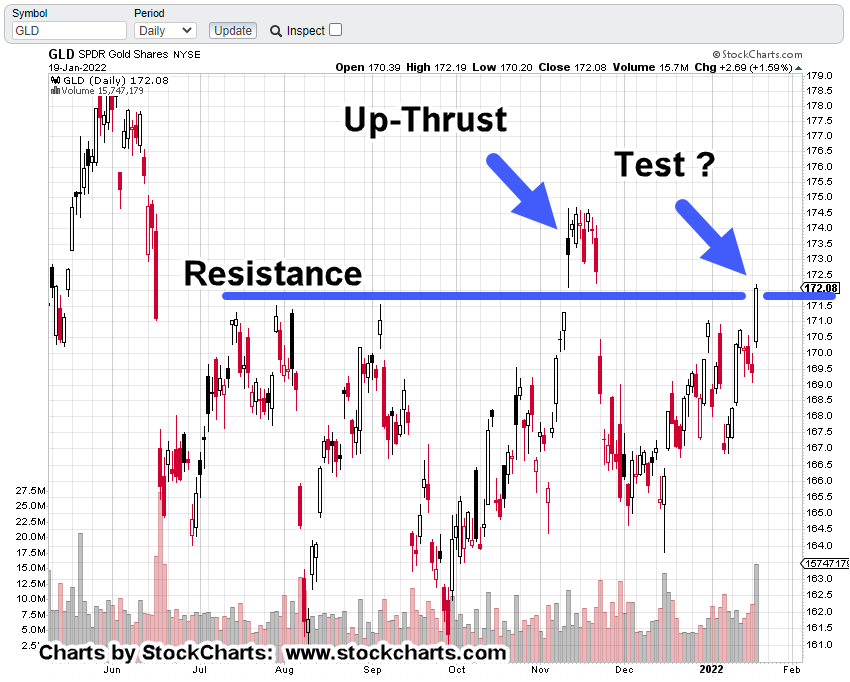
Gold Finished Testing ?
We’re a few hours from the Fed announcement but the market looks like it’s already made a decision.
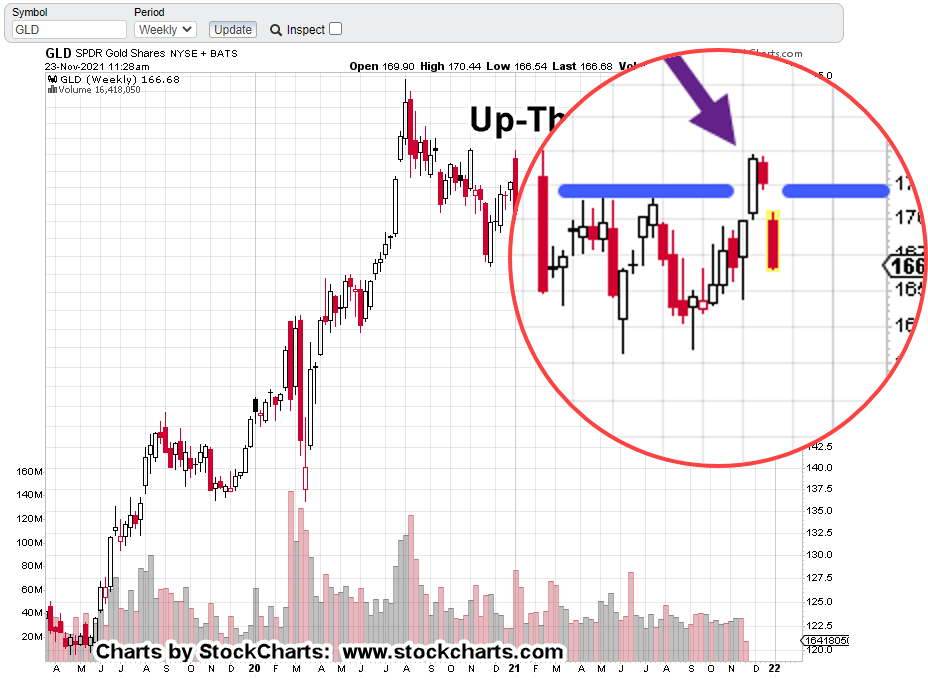
The daily chart of gold (GLD) shows all that’s happened since the potential for up-thrust breakout was first presented.
The zoom chart shows price action right at the support/trendline of the terminating wedge.
More importantly, we see that action is below the established resistance line; possibility indicating the test is complete.
Note: Posts on this site are for education purposes only. They provide one firm’s insight on the markets. Not investment advice. See additional disclaimer here.
First off, we’ll re-post the weekly close chart of Junior Miners, GDXJ as it was then (October 25th, 2020):
The following quotes were also part of that report:
“One way to look at it is, the junior sector does not believe gold (and silver) prices can be sustained at current levels.”
“Or, if they are sustained, there must be something else at work that would prevent them form obtaining a substantial profit.”
Now we know, nearly a year and a half later, that “something else at work”, is what we call The Speck and the Speck-Effect.
Not only that, energy (and money) that’s being diverted to solve non-problems (covered in the last post) may be having an effect as well.
Let’s not forget supply chain problems with no end in sight.
If there ever was a case for Wyckoff analysis, this is it.
Reading price action, making calculated (intuitive) decisions will keep one away from what by now, has become useless prattle from the mainstream sources.
Remember ‘blue skies ahead’?. Seems like it was almost yesterday … oh, wait. 🙂
This garbage-in, garbage-out, is not exclusive to just the financial media.
As Dr. Vernon Colman points out in his video (linked here), it seems to be pervasive in all types of media world-wide.
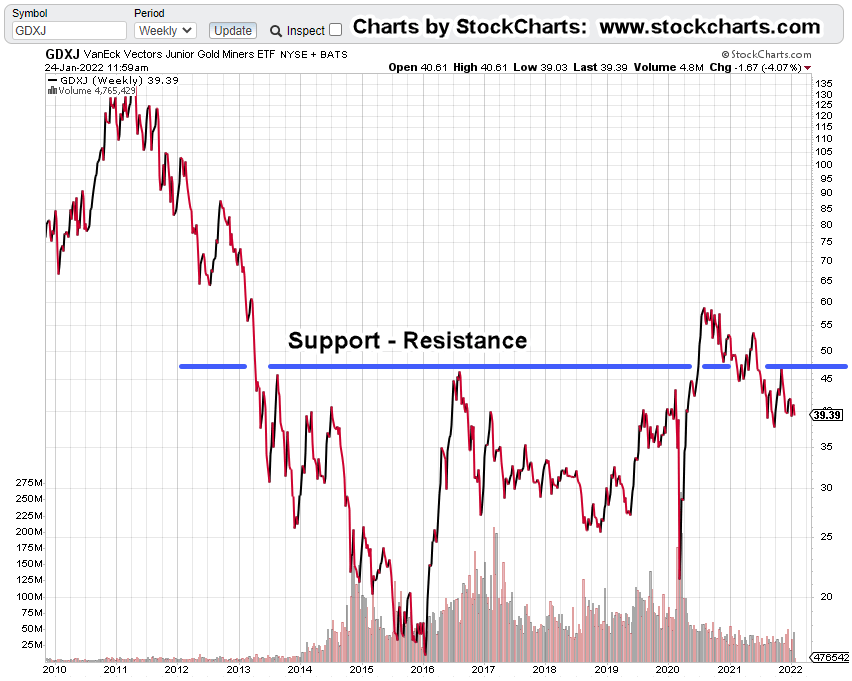
Junior Miners GDXJ, At Present:
Here’s how the weekly close of the Junior Miners looks today (approximately, mid-session):
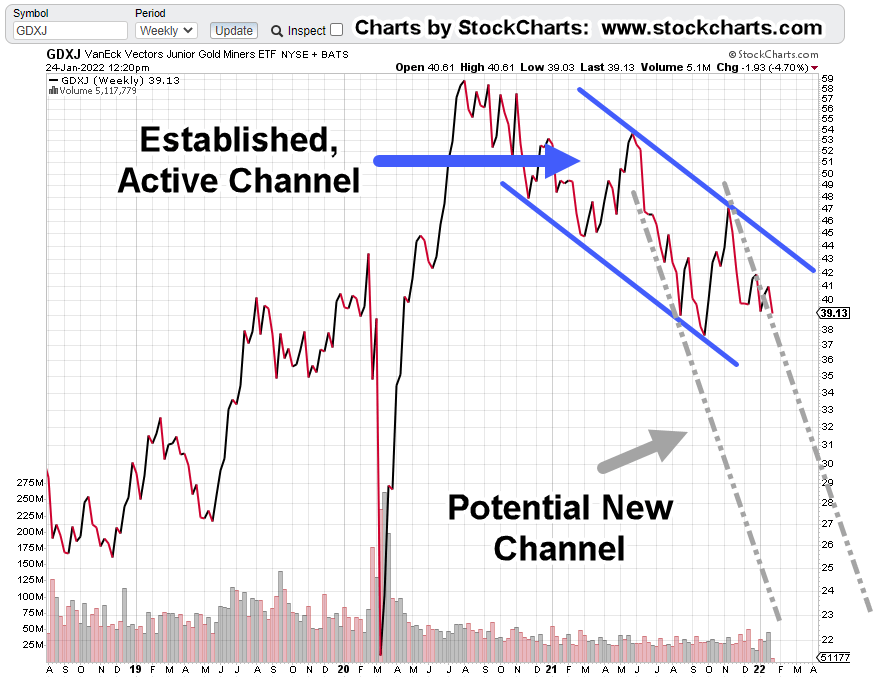
Downside Trading Channel(s)
We’ll stay with the weekly GDXJ but zoom in and mark it up:
GDXJ, has been in a well-established down-channel, beginning around late November of 2020.
As shown with the grey dashed-line, there’s a possibility of a new more aggressive channel.
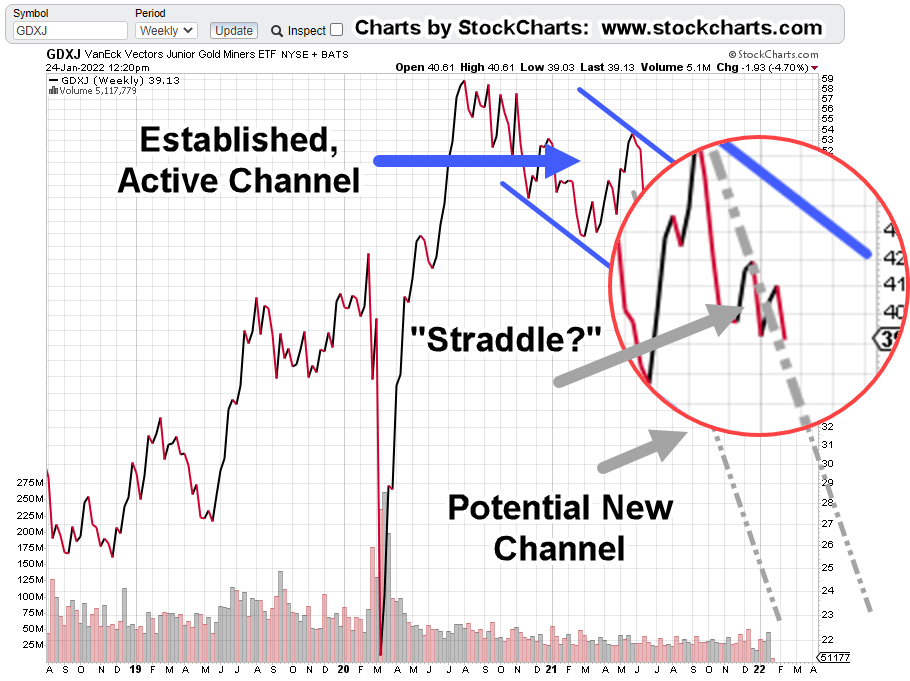
The chart below shows the potential right-side trend line is currently being ‘straddled’ by price action; this can happen when the equity or index is unsure there’s been a change.
If GDXJ really has pivoted more aggressively to the downside, price action will ‘get itself into the channel’ by accelerating sharply lower.
Where’s It Headed?
For this update, we’re going to use the P&F projections for GDXJ. Fibonacci projections (which have a similar target) may be covered in tomorrow’s update … price action depending:
Downside projection is for a drop of approximately – 35% to -50%, from current levels (not advice, not a recommendation).
Summary:
As always, anything can happen. The markets could be rescued yet one more time.
However, at this juncture we’re at least in the established down channel shown above. Price action will let us know if there’s been a decisive acceleration to the downside (grey dashed-line).
Remaining short GDXJ via JDST; labeled as JDST-22-01 (not advice, not a recommendation).
Note: Posts on this site are for education purposes only. They provide one firm’s insight on the markets. Not investment advice. See additional disclaimer here.
Volatility cauterizes the emotions. It reveals the market extremes and shows each player’s hand; bulls and bears.
With the market just opened we’re going to look at gold’s last man standing: Newmont Mining.
‘Last man standing’ because, except for two equities far down in Senior Miner’s GDX, no one is anywhere near their mid-November highs.
The take on this: The gold market’s thinning out and ready to reverse.
A really big move
It’s easy to get lost and hypnotized with the day-to-day action. However, by pulling back, one sees the potential for a massive short (the market) opportunity (not advice, not a recommendation).
Implosion Effects: Broker Platforms Go Inoperative
Over and again, nearly each time there’s a big down move in the markets, where the Dow may lose 1,000 points or more, brokerage platforms seize up.
It happens so often; it’s probably best to incorporate it into one’s trading approach.
That’s one of the reasons, if not the main reason to work the short side (not advice, not a recommendation).
Newmont’s Short Clues
The volatility has exposed everybody’s hand on both side of the trade. That’s the good part.
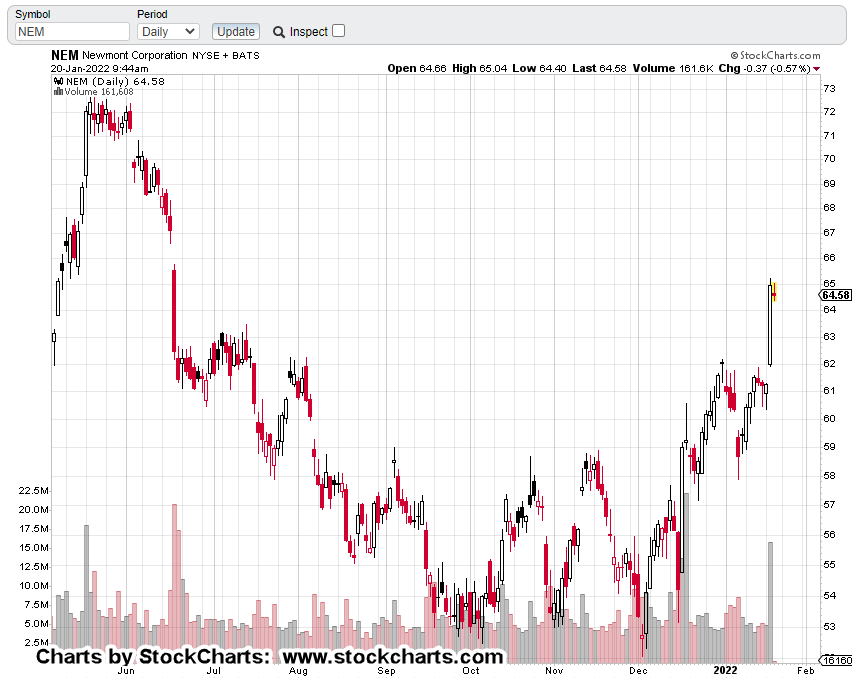
We’ll touch on each technical event separately, starting with the unmarked daily chart:
First off, markets that have wide, high-volume bars, tend to come back and test that bar. We see it below:
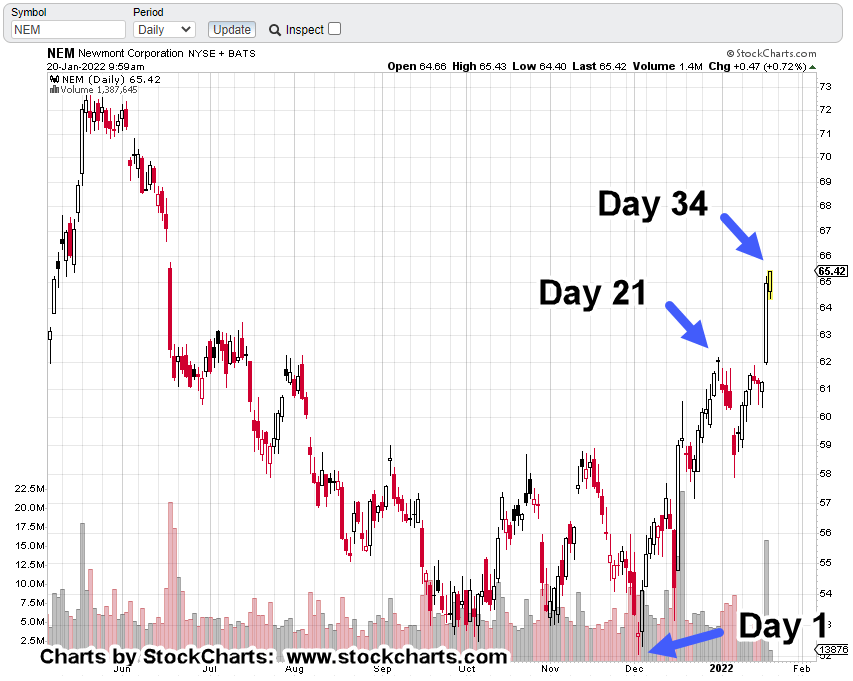
Next, price action’s got itself into a terminating wedge; a potential bearish reversal pattern:
Then, we have today as Fibonacci Day 34, from the December 2nd, reversal low.
As this post is being created, NEM just made a new daily high; potentially culminating its wedge terminating move.
Big Fish, Little Hook
As Dr. Elder has said concerning stop placement, ‘You can’t catch a big fish with a little hook’.
So, we have GLD, GDX and GDXJ, in a November bull trap (up-thrust), with what looks like two-months of price action to come back and test.
If that assessment’s correct and it took two months just for a test, whatever happens next, may be on the order of years to resolve itself.
From a trade standpoint, it looks like today’s low in JDST, current open position, JDST-22-01, may be a good place for a stop (not advice, not a recommendation).
Newmont, Reversing
After Newmont posted a new daily high, it’s currently trading below yesterday’s close.
Deflation Pivot-Point
We have the usual hysteria in the gold market but this time, deflationary forces may be overtaking the manic gold bulls.
Case in point:
Existing home sales look like they’re rolling over. All kinds of excuses being made about lack of inventory and the imaginary ‘Speck’ with its new variant.
The one thing not imaginary about The Speck, is this report about what’s really going on.
Note: Posts on this site are for education purposes only. They provide one firm’s insight on the markets. Not investment advice. See additional disclaimer here.
If this is a test of the mid-November up-thrust, things may happen quickly from here on out; with that in mind, it’s important to get it all (technical data) out in the open.
The gold (GLD) chart is similar to the GDX that was discussed in the prior update.
It could be a test of the bull trap from last November.
If that’s indeed the case, and price action reverses lower from here, the downdraft could be more than significant.
Position Change
Instead of lightening-up on the DUST-21-01 position as stated, that position was modified.
The DUST-21-01 was closed out. Then, a position in JDST opened immediately; currently labeled as JDST-22-01, with nearly the same position size.
The gold market appears to be thinning out.
We want to pick the weakest part of the sector for downside potential (not advice, not a recommendation).
The Junior Miners. GDXJ, have been lagging the Seniors GDX, for some time.
Today appeared to be a good opportunity, with everything at extremes, to make the change (not advice, not a recommendation).
Note: Posts on this site are for education purposes only. They provide one firm’s insight on the markets. Not investment advice. See additional disclaimer here.
For now, we’ll discuss only the technical aspects.
We’ll leave the rest of the truth for mainstream news.
Discussed previously, the sector (SPBIO) was left with our assessment that it may reverse higher into a retrace; combined with an up-thrust/reversal.
That was then.
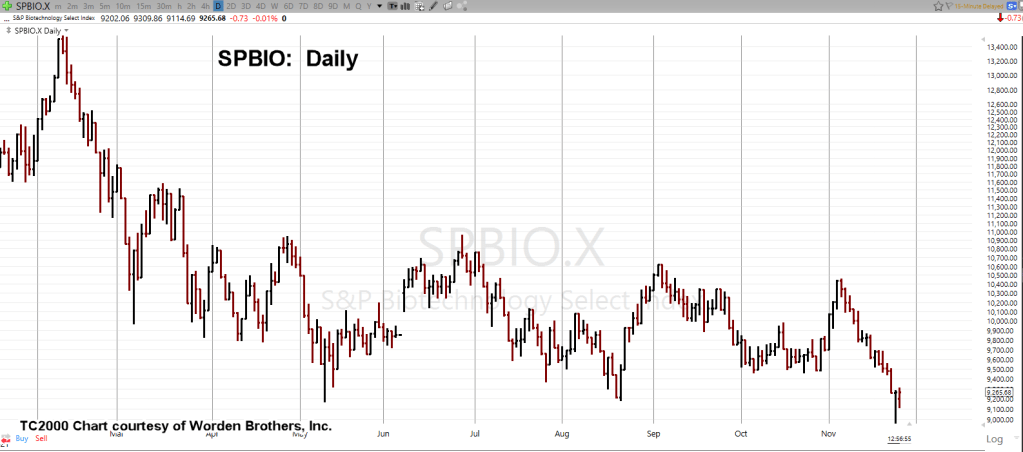
Biotech, SPBIO, Now:
Daily un-marked chart of SPBIO:
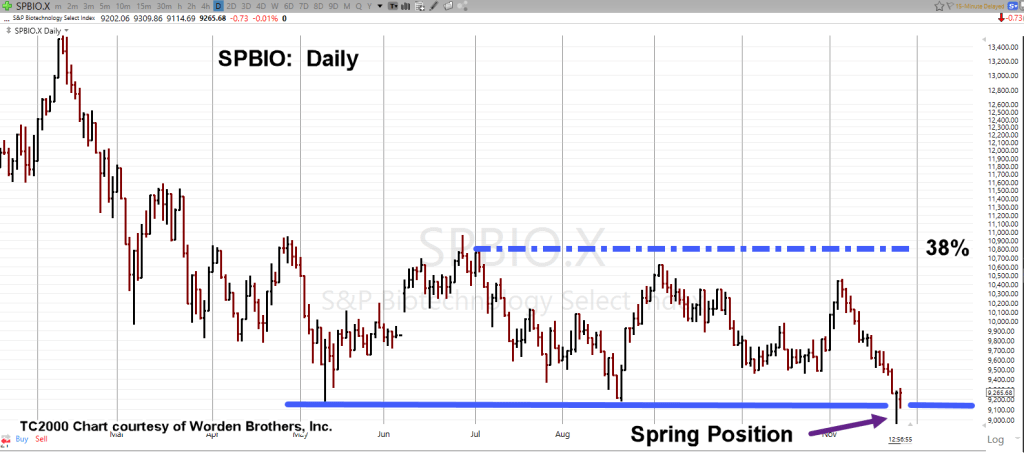
Below, a marked-up chart showing penetration and move off support (Spring Condition).
Included, is the 38% retrace level … location for potential test and reversal:
As with the on-going reversal in gold (GLD) and the miners, GDX, GDXJ, we’ll have to see how this plays out.
Unfortunately, as we head into what used to be the regular flu season, those who received ‘protection’, are going to find out they’re not protected at all.
Stay Tuned
Note: Posts on this site are for education purposes only. They provide one firm’s insight on the markets. Not investment advice. See additional disclaimer here.
The latest update from Steven Van Metre, has comments from the Fed that seem like they’re from another world, another time.
Evidently, the economy’s so strong … so good, that we might taper more aggressively and then … raise rates.
At this point, ‘what difference does it make?’
They’ve probably already cashed-out (like last time) and now stand on the sidelines.
Meanwhile back at the proletariat, we’re deciphering the market’s next moves … Fed press releasees notwithstanding.
Is Gold (GLD) The Black Swan ?
Frist off, there are several YouTuber’s that are providing an excellent service; letting us know the real state of the economy.
They are invaluable; thus, receiving their fair share of hate from those that don’t want to hear, see, or smell, ‘bad news’.
All of them willingly admit, they’re not experts when it comes to the markets … fair enough.
However, in Jerimiah Babe’s latest update, he may have unwittingly revealed a (or the) black swan.
Gold and the gold market.
JB’s offered the anecdote of attempting to purchase more gold at the dealer. For the first time ever, he was limited on the amount available.
From a market standpoint, the public, is all-in.
Even as we speak, gold (GLD) and the miners, GDX, GDXJ, are in a vicious downside reversal.
At this juncture, it looks like an upward test of resistance (discussed yesterday) is nowhere in the cards.
Price action for the most part, is straight down.
Which brings us to the charts.
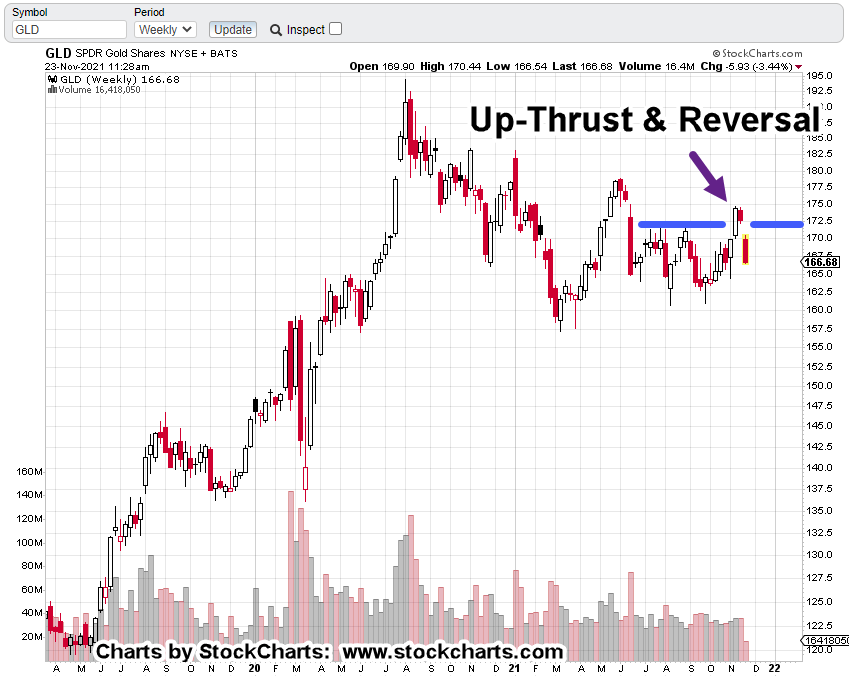
GLD, Weekly Chart:
Marked up with resistance and the up-thrust reversal.
Zoomed area of the reversal
Personal Opinion:
Because the gold hype by the financial press was so incessant for so long (which by the way, has strangely ‘disappeared’), this reversal may be something that lasts much longer than anyone would expect (not advice, not a recommendation).
Downside Targets:
The weekly GLD chart below has a Fibonacci projection tool overlay.
A 161.8%, projection would take GLD down to 119 – 120.
Are the gold bulls prepared for an extended downside rout in the metals?
Summary:
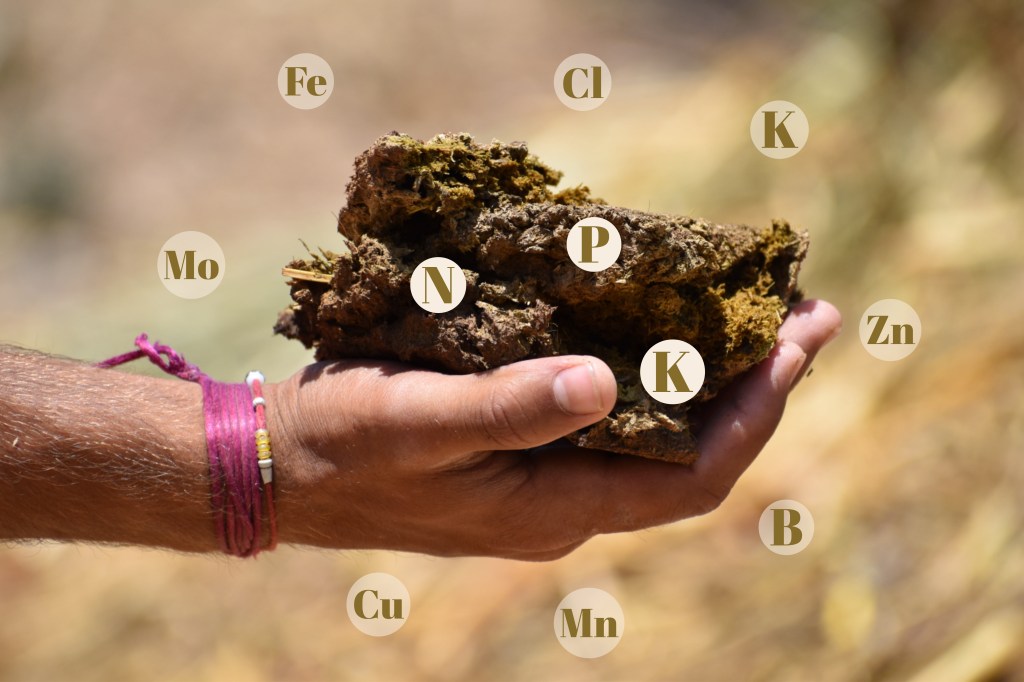
Early morning food production.
It might not look like it’s connected to the markets but it is.
Market analysis presented on this site, helps steer actions needed to separate from (or reduce reliance on) the system.
Properly executed, trading is one avenue to provide income that’s necessary to eliminate the need for a corporate employer (not advice, not a recommendation).
Market analysis also helps identify what’s likely to come next.
But, I digress.
Getting back to the coop; four eggs a day … equates to over two dozen a week. Reliance on the grocery store (at least for eggs) has effectively been eliminated.
About a year’s worth of feed has been stockpiled.
Let’s put it a little differently; a year’s worth of feed has been ‘stacked’.
Personally, I like gold and silver as much as the next guy.
However, those in charge of this collapse have already stated, food will be used as the leverage weapon.
But hey, we shouldn’t have to worry about any of that, because, ‘The future’s so bright …’
Note: Posts on this site are for education purposes only. They provide one firm’s insight on the markets. Not investment advice. See additional disclaimer here.
Adverse moves in gold (GLD) like we have right now, especially after months of incessant hype, puts those who bought into the narrative on the wrong side; stunned, unable to move.
There’s a small chance, this could be a shakeout before going higher. Anything can happen.
However, if we look at the chart of GLD, it’s a grim situation for the bulls.
Gold (GLD)
Daily chart, GLD:
This wasn’t just a one-day push above resistance and then reversal.
GLD, spent a Fibonacci 8-Days struggling to break out before this morning’s collapse.
Stunned bulls may think it’s a buying opportunity. If so, there’s likely to be some kind of underside test of resistance.
However, that’s not guaranteed. Moves like this tend to offer no relief and just grind their way lower.
Positioning:
At this juncture, we’ve got a nasty adverse move; putting the short position (DUST) well in the green (not advice, not a recommendation).
Any upward test of GLD, and the miners, GDX, GDXJ, is likely to reveal new support/resistance boundaries and possibly trend-lines.
If so, we’ll have something to monitor for a potential exit signal.
Note: Posts on this site are for education purposes only. They provide one firm’s insight on the markets. Not investment advice. See additional disclaimer here.
This trade could still fall apart for some unknown reason.
If it looks like the bulls are somehow re-gaining control, it will show up in the price action and we’ll exit accordingly (not advice, not a recommendation).
Stay Tuned
Note: Posts on this site are for education purposes only. They provide one firm’s insight on the markets. Not investment advice. See additional disclaimer here.