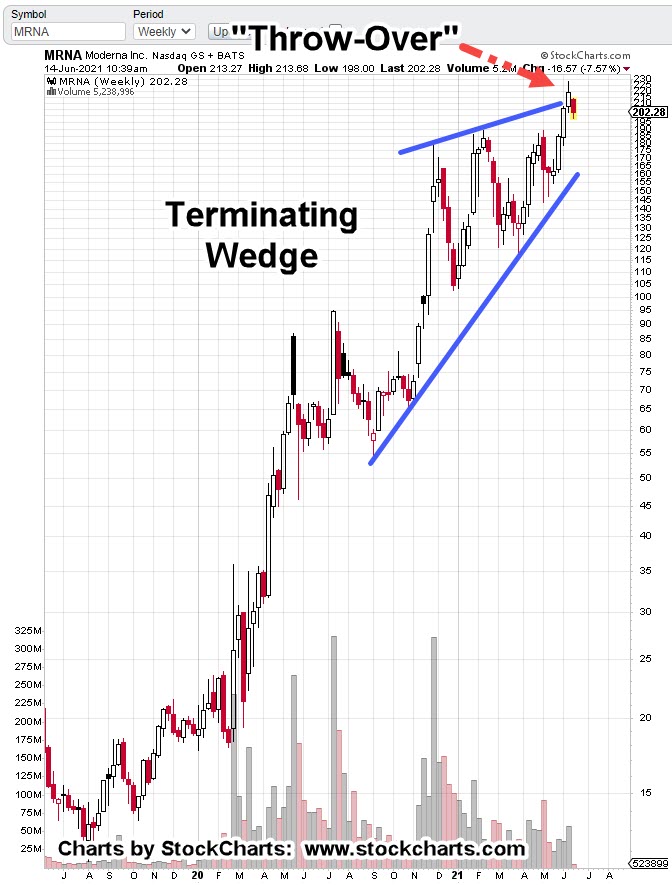
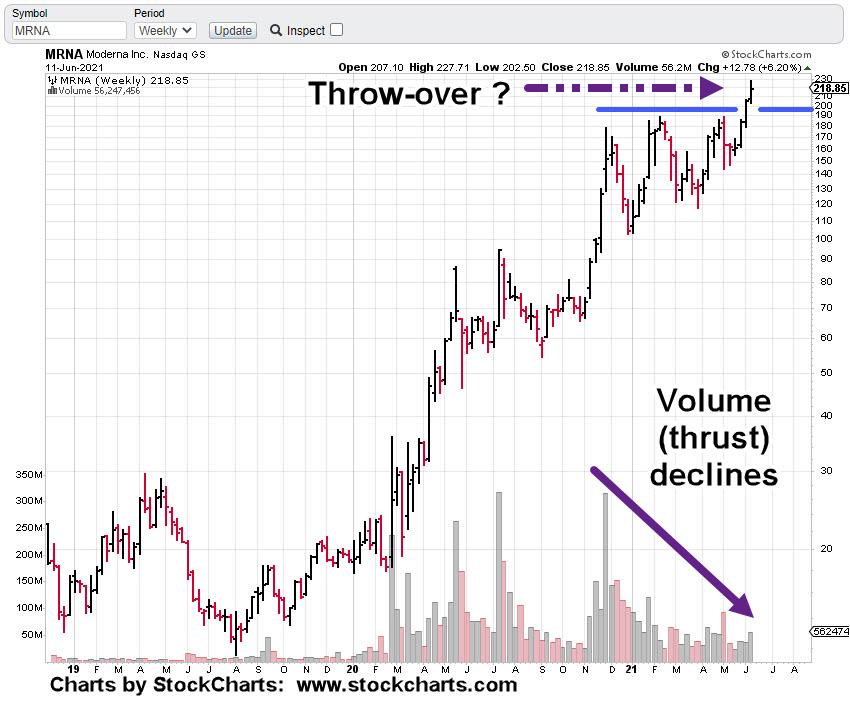
In a situation that’s straight out of any typical trading text: ‘When a market goes into a throw-over and then enters back into the range, it’s a classical analysis sell signal’ (not advice, not a recommendation).
That’s where Moderna (MRNA) is now.
Moderna’s the ‘chief cook and bottle washer‘ for the world-wide kabuki theater. So, we’re using it as a proxy for the biotech sector as a whole.
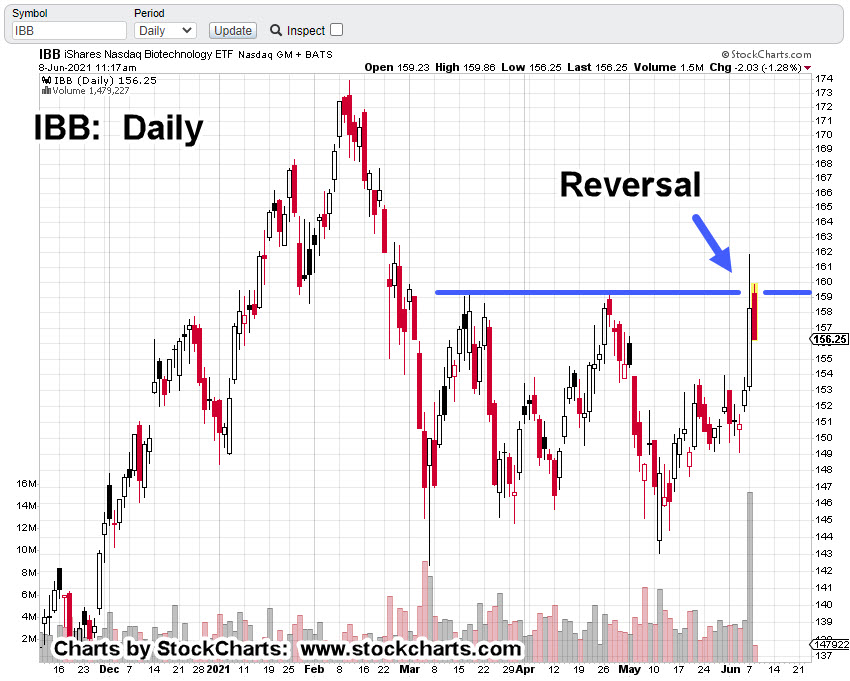
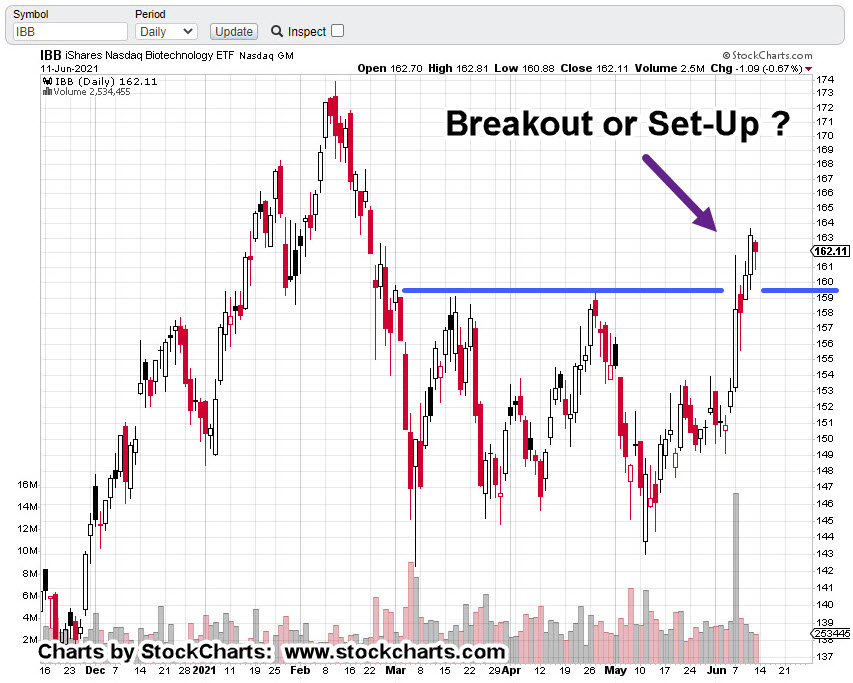
Separately, biotech index IBB, is retracing but has not posted a new daily low.
Inverse SPBIO fund LABD, has formed an hourly reversal bar and looks to be forming a daily reversal bar. As of this update, it has yet to post a new daily high.
Note: Posts on this site are for education purposes only. They provide one firm’s insight on the markets. Not investment advice. See additional disclaimer here.
Starting with the (unmarked) weekly chart of IBB below, we see the current upside breakout.
We’re going to invert the chart and label the ‘resistance’ as ‘support’.
Inverting charts is a technique discovered years ago in a long since forgotten trading text; possibly Dr. Elder’s
The ‘inverting exercise’ is to help eliminate chart bias.
For example: If you see bullish no matter which way you turn the chart … there’s a preconditioned bias that’s affecting decisions.
On to the inverted chart:
What we see above, is a typical Wyckoff spring set-up.
Price action has decisively penetrated support (resistance on the regular chart) and is now eroding.
The distance of the trading range is shown as the dashed line.
Look at the near perfect symmetry.
Putting the range bar at the top of the trading range gives a measured move … right into resistance (support) of the next range.
Price typically moves down, two or three times as fast, as it moves up.
That’s why the professional speculators (throughout trading history) prefer down markets. If there are profits, they show up a lot faster.
Fundamentals:
Enormous pressure continues to build against the sector. You have to wonder what’s it’s going to take for the big break.
Just out last night, was this report from ZeroHedge. The CDC is having an emergency meeting to discuss ‘heart inflammation’ problems with the injections.
Let’s start there with a ‘safe’ topic and not discuss things like ‘dead within 15-minutes’ of injection.
Or maybe this one: A bloke gets himself injected and nearly kills two people with his truck a few minutes later.
The date on the video is June 11th. People are still getting this thing even with so much adverse reaction (death) information available?
The two narrating have a good point. What happens when a pilot is on final approach in bad weather, when he suddenly goes into an ‘event’.
Note: Posts on this site are for education purposes only. They provide one firm’s insight on the markets. Not investment advice. See additional disclaimer here.
Looking at the weekly close chart, we can see the wide range.
In addition, there’s a significant bullish divergence that (technically) gives the dollar, UUP, enough energy to test the top of that range; a potential that’s completely opposite the current narrative.
A this juncture, silver, gold and the miners are still correlated.
Yesterday, a potential top and reversal in miners GDX, was identified. Today, it appears to be hovering and looking unsure of its direction.
GDX has not posted a new daily high or low as of this update.
A sustained dollar rally (along with the bond market?) would be unexpected given what seems to be apoplectic hyperinflation ranting.
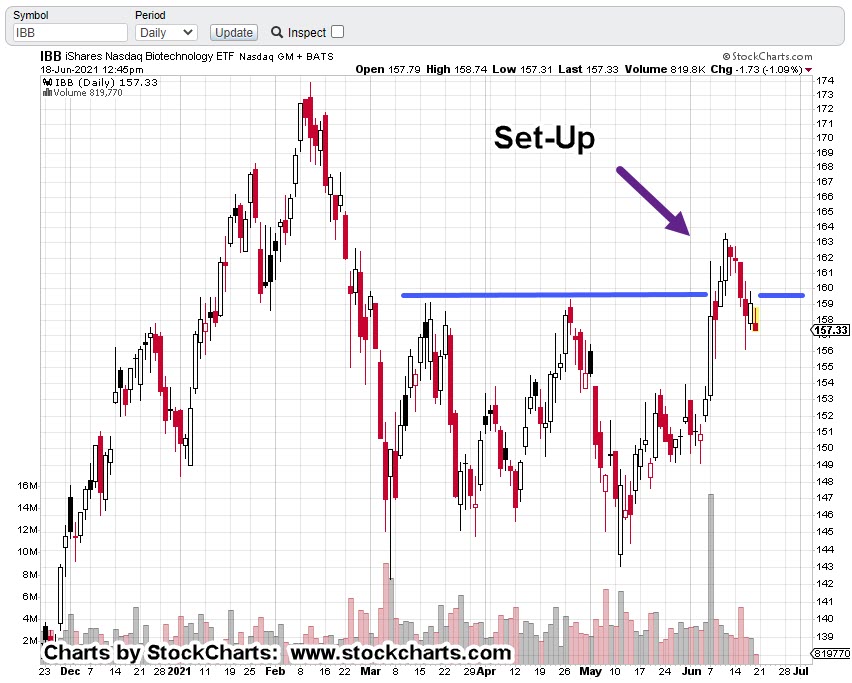
Separately, in biotech, the market (IBB) has stalled to the upside in a higher than expected test. Inverse fund LABD, made a new daily low and it too, has stalled.
Downward thrust energy on LABD is dissipating.
Technical update for biotech, planned for tomorrow … market permitting.
Note: Posts on this site are for education purposes only. They provide one firm’s insight on the markets. Not investment advice. See additional disclaimer here.
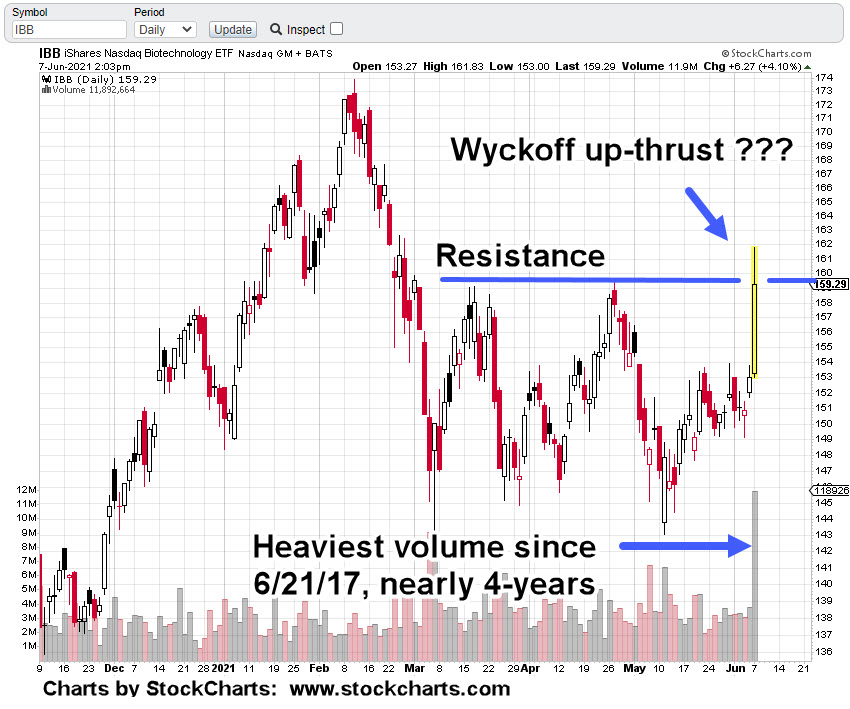
It’s about 80-minuts before the close and already, IBB’s printed more single day volume than in the past four years.
There must have been a huge number of stops at the resistance area for price action to launch so decisively.
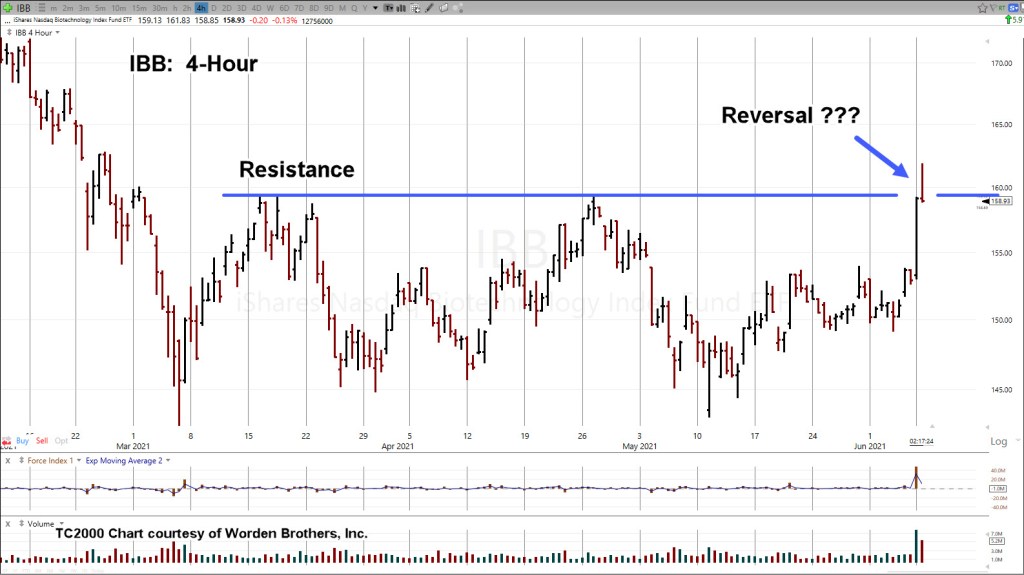
Now, as we get near the close we’ll see if it was just short covering, or if there’s really some kind of demand to hold and move prices higher.
The 4-Hour chart (below) shows a potential reversal as we head into the closing hour.
It’s the trader’s discretion on how to interpret and position (if warranted) in this environment. This site does not make recommendations.
However, based on the technical and fundamental data provided over the past year, we’re expecting at some point, a complete collapse of the sector; bottoming-out sometime in mid to late October, this year; not advice, not a recommendation.
If IBB continues to push decisively upward from here, meaning, tomorrow’s session is follow-through action, it will most likely (but not fore sure) invalidate the ‘collapse’ scenario.
We’re at the danger point
One of many other factors helping the bearish assessment is the release of this report:
Note: Posts on this site are for education purposes only. They provide one firm’s insight on the markets. Not investment advice. See additional disclaimer here.
Well, none almost, other than to be reminded the powers that be have absolute contempt for those that aren’t in their global club.
You have to wonder, what’s next? Maybe it’s time for the (fake, or real) alien invasion.
Maybe we’ll have a few more ‘planned’ cyber attacks … who knows?
Meanwhile, back at the ranch, it’s more than a bit interesting the biotech sector with its quarterly reversal, weak 23.6% retrace, and now continuing downside (so far), is not a major topic of discussion.
This morning, Moderna’s (MRNA) attempting a breakout. It won’t look so good if it can’t close higher for the day.
The last update showed MRNA, insiders bailing out.
SPBIO looks to be establishing or confirming a downside trend-line. More on that if/when there’s confirmation.
Stay Tuned
Note: Posts on this site are for education purposes only. They provide one firm’s insight on the markets. Not investment advice. See additional disclaimer here.
Then, way back to “Reminiscences“, published in 1923.
As a reminder, we’re looking at biotech (SPBIO) from the perspective of being short the market.
The primary vehicle for that short, is highly leveraged inverse fund, LABD.
The last update gave a hint at the desired timeframe.
If the markets are in the process of reversing, ultimately going to the long awaited (since 2009), final draw-down (i.e. crash), then a likely bottom would occur where they (almost) always occur; during the third week of October.
In a nutshell, that’s the time frame.
Conversely, price action is the final arbiter. If biotech winds up effectively saying ‘not now’, well then, it has the final say.
Back to ‘Entries & Exits’.
One of the traders highlighted in the book (in addition to Weis), was William Doane; former Head Technician for Fidelity.
His timeframe is much longer than the typical market participant. He, like Weis are looking at monthly, quarterly and yearly charts.
That fact in and of itself, provides an edge.
One of the main take-aways from his section was (paraphrasing):
‘The first correction is the hardest. If you can get through that, it’s typically smooth sailing from then on’.
The biotech short via LABD (not advice, not a recommendation) may be at that point now. Painful to watch but necessary.
Next, we go to ‘Reminiscences’.
Those who have read the book, know all about ‘Turkey’; Mr. Partridge.
As the book states, he was much older than the rest who frequented the brokerage. Also, he did not appear to be that active in the markets (thus minimizing his transactions). He was interested in the big move.
The admonition from Partridge, was: ‘Don’t lose your position’. Don’t exit out, expecting a pull-back … that ultimately never comes.
So, we have two examples; three if you include Weis that begin from the very long time-frames and work inward.
Now, on to the market:
The long term, Quarterly analysis has already been done; linked here.
The chart in the link, is from last quarter and since then, (during this quarter), we’ve made new lows.
On the fundamental side, evidence is building by the day on what the ‘speck’ protection is all about.
If you’re really interested in the big picture, here’s a link to a five-plus hour presentation that spells it all out.
Momentum indicators MACD, on the Monthly and Weekly remain in a downtrend.
Using IBB, as the proxy for Quarterly momentum (not enough data for SPBIO), the indicator is flat.
Momentum’s in favor of (maintaining) a short position; not advice, not a recommendation.
The monthly chart of SPBIO (inverted), has price action coming back to former resistance (now support). This is normal market behavior.
Recall, that on the downside, if there is some kind of ‘event’, markets can slice through apparent support levels with ease.
With that in mind, on the inverted chart above, the next major ‘resistance’ level may or may not be of consequence.
Summary:
Each trading week is important.
However, next week will likely a pivotal one; providing more information on whether to maintain short or exit and stand aside; not advice, not a recommendation.
Stay Tuned
Note: Posts on this site are for education purposes only. They provide one firm’s insight on the markets. Not investment advice. See additional disclaimer here.
Even in his trading video, the late David Weis remarks … ‘I have a preference for down markets …’
Profits come nearly twice as fast and the bottom is easier to detect.
With that in mind, the daily chart of inverse biotech fund LABD, has been noted showing both emotions:
Extreme fear shows up as spikes at the trend line. Also noticeable, the spikes are widely spaced.
Greed on the other hand, is spaced closer and harder to detect. Remember, we’re looking at the inverse (LABD); fear and greed locations are swapped.
Moving on to the set-up, the Wyckoff spring:
Considering the current situation … i.e. valuations, margin debt, retail participation extremes, the above forecast is a modest one.
A potential doubling in value (measured move).
The expectation is for LABD to contact the upper trading range somewhere around 27.50 (not advice, not a recommendation).
If it does and then breaks to the upside, a standard measured move (trading range distance, magenta lines) would target the 40-area.
At this juncture, the market (SPBIO) is giving no overt indication of imminent collapse.
This is how markets work.
If we do get the expected wipeout, be prepared for the usual suspects to come out and say ‘No one saw it coming.’
Stay Tuned
Note: Posts on this site are for education purposes only. They provide one firm’s insight on the markets. Not investment advice. See additional disclaimer here.