Gold Miners: Now, It’s Obvious

It Was Never A Bull Market

The bottom’s falling out of the equity markets and the miners are going right along with them.

For long-time users of this site, this lack of a sustainable bull market in the mining indices was identified long ago.

Fifteen months ago, we had the following post. Let’s review and give it an update:

‘What’s wrong with this picture?’

The Charts:

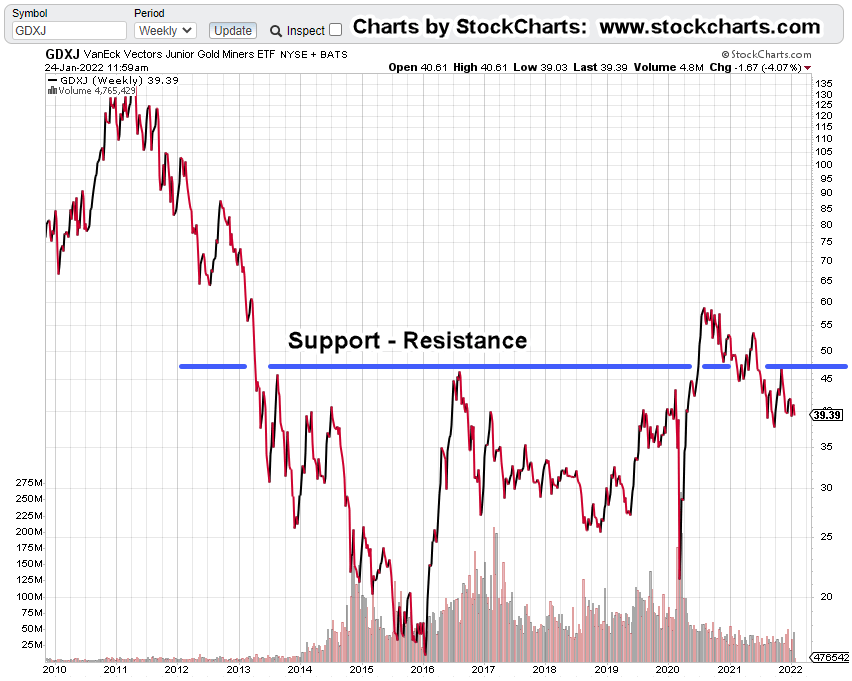
First off, we’ll re-post the weekly close chart of Junior Miners, GDXJ as it was then (October 25th, 2020):

The following quotes were also part of that report:

“One way to look at it is, the junior sector does not believe gold (and silver) prices can be sustained at current levels.”

“Or, if they are sustained, there must be something else at work that would prevent them form obtaining a substantial profit.”

Now we know, nearly a year and a half later, that “something else at work”, is what we call The Speck and the Speck-Effect.

Not only that, energy (and money) that’s being diverted to solve non-problems (covered in the last post) may be having an effect as well.

Let’s not forget supply chain problems with no end in sight.

If there ever was a case for Wyckoff analysis, this is it.

Reading price action, making calculated (intuitive) decisions will keep one away from what by now, has become useless prattle from the mainstream sources.

Remember ‘blue skies ahead’?. Seems like it was almost yesterday … oh, wait. 🙂

This garbage-in, garbage-out, is not exclusive to just the financial media.

As Dr. Vernon Colman points out in his video (linked here), it seems to be pervasive in all types of media world-wide.

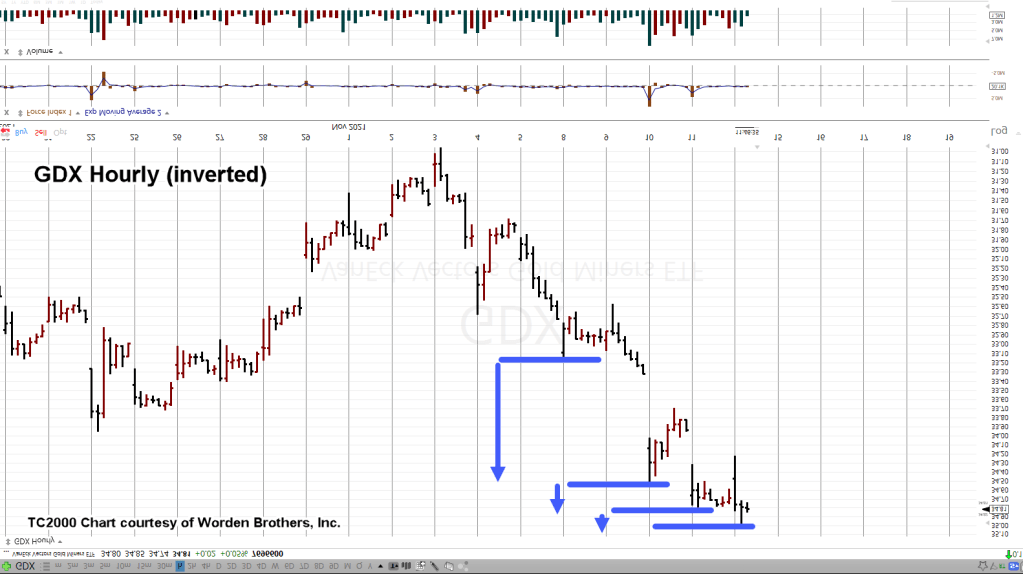
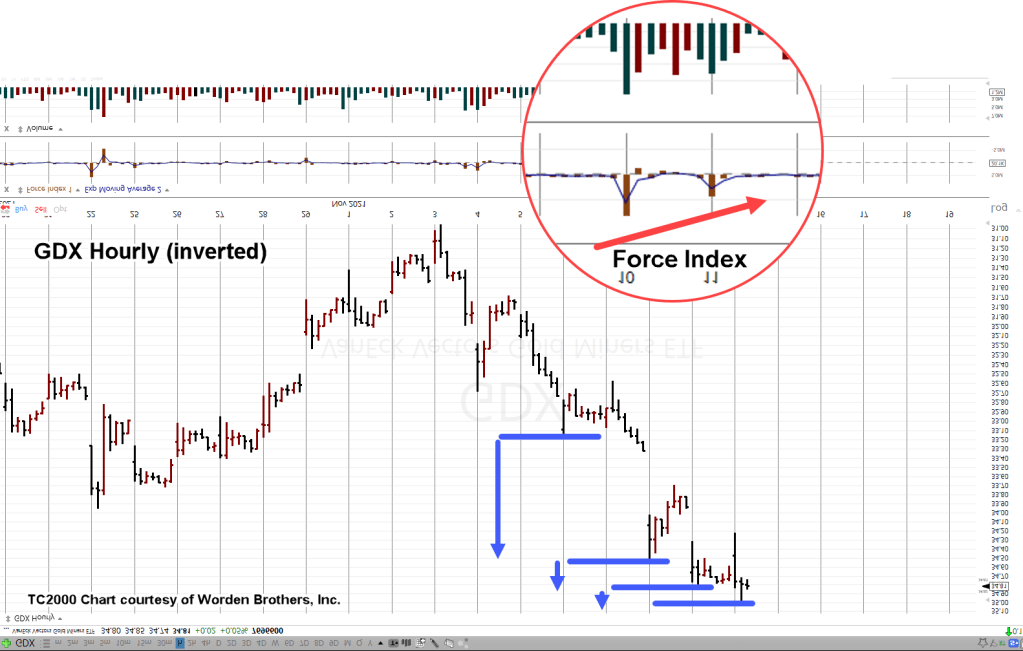
Junior Miners GDXJ, At Present:

Here’s how the weekly close of the Junior Miners looks today (approximately, mid-session):

Downside Trading Channel(s)

We’ll stay with the weekly GDXJ but zoom in and mark it up:

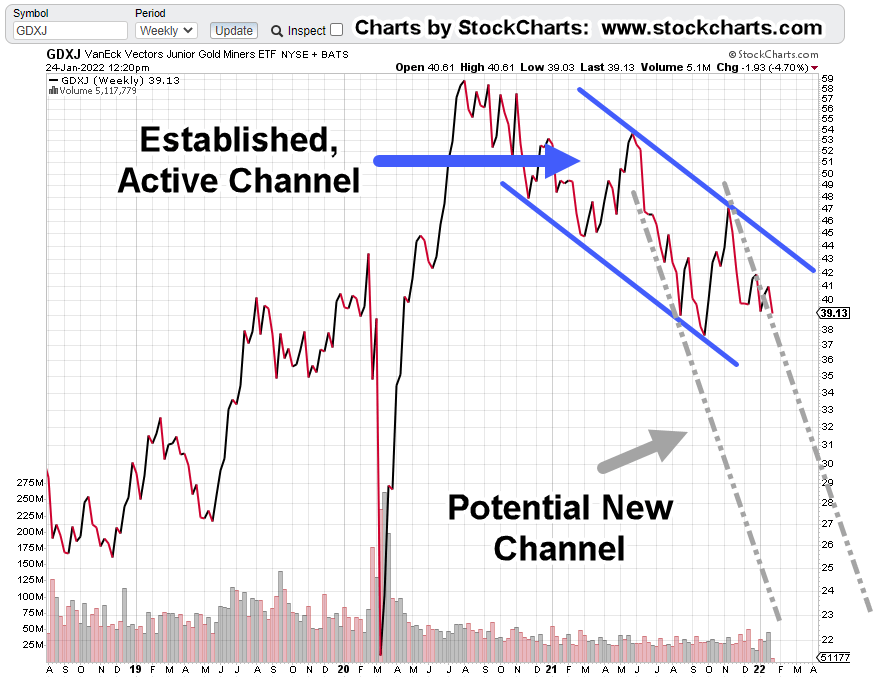
GDXJ, has been in a well-established down-channel, beginning around late November of 2020.

As shown with the grey dashed-line, there’s a possibility of a new more aggressive channel.

The chart below shows the potential right-side trend line is currently being ‘straddled’ by price action; this can happen when the equity or index is unsure there’s been a change.

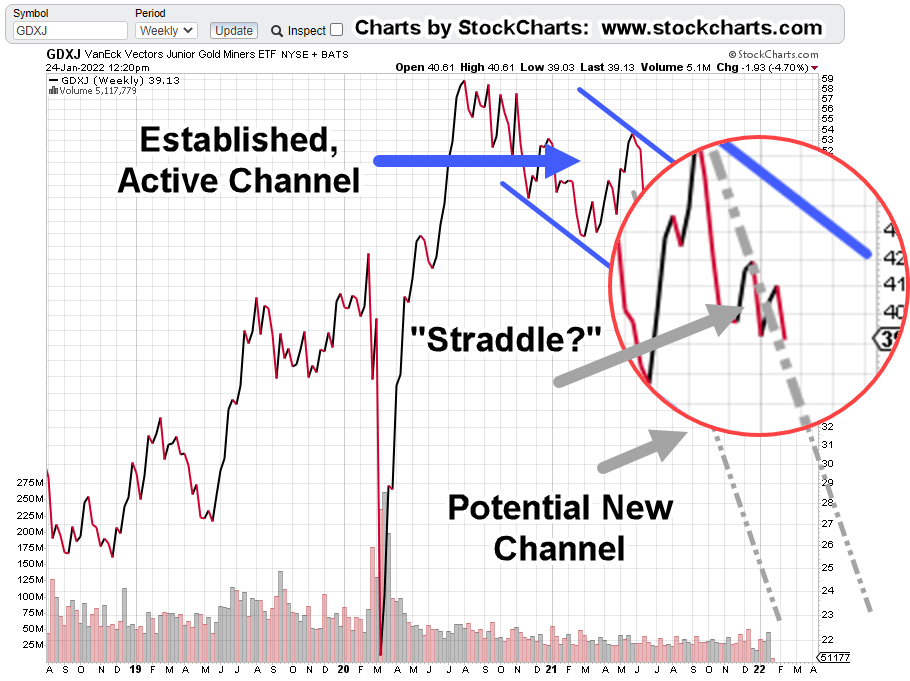
If GDXJ really has pivoted more aggressively to the downside, price action will ‘get itself into the channel’ by accelerating sharply lower.

Where’s It Headed?

For this update, we’re going to use the P&F projections for GDXJ. Fibonacci projections (which have a similar target) may be covered in tomorrow’s update … price action depending:

Downside projection is for a drop of approximately – 35% to -50%, from current levels (not advice, not a recommendation).

Summary:

As always, anything can happen. The markets could be rescued yet one more time.

However, at this juncture we’re at least in the established down channel shown above. Price action will let us know if there’s been a decisive acceleration to the downside (grey dashed-line).

Remaining short GDXJ via JDST; labeled as JDST-22-01 (not advice, not a recommendation).

Stay Tuned

Charts by StockCharts

Note:  Posts on this site are for education purposes only.  They provide one firm’s insight on the markets.  Not investment advice.  See additional disclaimer here.

The Danger Point®, trade mark: No. 6,505,279

Volatility Event: Newmont Mining

Alignment Of The Bears

“Volatility Is Good”

Volatility cauterizes the emotions. It reveals the market extremes and shows each player’s hand; bulls and bears.

With the market just opened we’re going to look at gold’s last man standing: Newmont Mining.

‘Last man standing’ because, except for two equities far down in Senior Miner’s GDX, no one is anywhere near their mid-November highs.

The take on this: The gold market’s thinning out and ready to reverse.

A really big move

It’s easy to get lost and hypnotized with the day-to-day action. However, by pulling back, one sees the potential for a massive short (the market) opportunity (not advice, not a recommendation).

Implosion Effects: Broker Platforms Go Inoperative

Over and again, nearly each time there’s a big down move in the markets, where the Dow may lose 1,000 points or more, brokerage platforms seize up.

It happens so often; it’s probably best to incorporate it into one’s trading approach.

That’s one of the reasons, if not the main reason to work the short side (not advice, not a recommendation).

Newmont’s Short Clues

The volatility has exposed everybody’s hand on both side of the trade. That’s the good part.

We’ll touch on each technical event separately, starting with the unmarked daily chart:

First off, markets that have wide, high-volume bars, tend to come back and test that bar. We see it below:

Next, price action’s got itself into a terminating wedge; a potential bearish reversal pattern:

Then, we have today as Fibonacci Day 34, from the December 2nd, reversal low.

As this post is being created, NEM just made a new daily high; potentially culminating its wedge terminating move.

Big Fish, Little Hook

As Dr. Elder has said concerning stop placement, ‘You can’t catch a big fish with a little hook’.

So, we have GLD, GDX and GDXJ, in a November bull trap (up-thrust), with what looks like two-months of price action to come back and test.

If that assessment’s correct and it took two months just for a test, whatever happens next, may be on the order of years to resolve itself.

From a trade standpoint, it looks like today’s low in JDST, current open position, JDST-22-01, may be a good place for a stop (not advice, not a recommendation).

Newmont, Reversing

After Newmont posted a new daily high, it’s currently trading below yesterday’s close.

Deflation Pivot-Point

We have the usual hysteria in the gold market but this time, deflationary forces may be overtaking the manic gold bulls.

Case in point:

Existing home sales look like they’re rolling over. All kinds of excuses being made about lack of inventory and the imaginary ‘Speck’ with its new variant.

The one thing not imaginary about The Speck, is this report about what’s really going on.

Massive ‘depopulation’, is deflationary.

Stay Tuned

Charts by StockCharts

Note:  Posts on this site are for education purposes only.  They provide one firm’s insight on the markets.  Not investment advice.  See additional disclaimer here.

The Danger Point®, trade mark: No. 6,505,279

Gold Test ?

Updating Now; Not Waiting For Tomorrow

If this is a test of the mid-November up-thrust, things may happen quickly from here on out; with that in mind, it’s important to get it all (technical data) out in the open.

The gold (GLD) chart is similar to the GDX that was discussed in the prior update.

It could be a test of the bull trap from last November.

If that’s indeed the case, and price action reverses lower from here, the downdraft could be more than significant.

Position Change

Instead of lightening-up on the DUST-21-01 position as stated, that position was modified.

The DUST-21-01 was closed out. Then, a position in JDST opened immediately; currently labeled as JDST-22-01, with nearly the same position size.

The gold market appears to be thinning out.

We want to pick the weakest part of the sector for downside potential (not advice, not a recommendation).

The Junior Miners. GDXJ, have been lagging the Seniors GDX, for some time.

Today appeared to be a good opportunity, with everything at extremes, to make the change (not advice, not a recommendation).

Stay Tuned

Charts by StockCharts

Note:  Posts on this site are for education purposes only.  They provide one firm’s insight on the markets.  Not investment advice.  See additional disclaimer here.

The Danger Point®, trade mark: No. 6,505,279

Inflation, Off The Chart ?

Or … Massive Supply Restriction

Use the miss-information and propaganda to your advantage.

The following items are just a partial list of recent inflation, so-called ‘news’.

$3,000 Gold Imminent

Gold & Dollar Soar, CPI Surge

Consumer Prices Soaring …

Gold & Crypto Surge

Transitory” Debate Is Over

That last one … is that like “The science is settled”?

To be fair, there is some truth in the articles. Prices are indeed rising. All types of costs are going up like food, gasoline and on.

Supply Restriction:

Here’s a strange bit of information from an unlikely source.

It turns out that copper (mining) supplies are being restricted in Minnesota. Go to time stamp 2:52, at this link and listen to the next 30-seconds.

Sure, it’s a data point of one but then again, what about all the talk of shutting down sources of oil production?

On it goes. This is supply restriction, not inflation.

It depends on what the definition of ‘inflation’ is.

Here we have one of the usual suspects parroting the now-accepted (but likely incorrect) definition of inflation. Go to time stamp 1:23.

I’m sticking with Robert Prechter Jr.’s definition of inflation and that is: Expansion of credit that causes increased spending that in turn causes demand to rise and then prices rise in turn.

Do we have expansion of credit now … or the destruction (or, soon to be) of credit? That’s called deflation.

Dollar … Still Not Dead

The dollar of course, is the wild-card.

Everybody’s expecting a collapse but darned if that’s just not happening. Actually, the opposite is taking place.

Now, all of a sudden it’s a “Contrarian Trade”. You can’t make this stuff up.

We’re coming up on the one-year anniversary of this post.

It postulated there was potential for a significant, medium-to-long term reversal in the dollar.

Getting The Picture

In a way, the dollar post and subsequent ZeroHedge one-year-later recognition of the obvious, define what this site’s all about.

As stated in the ‘About’ section, not every analysis works out. To borrow a quote from David Weis, ‘Sometimes I’m 100% wrong’.

Presented here are analysis, actions, course changes, attempting to maneuver through the largest economic and population collapse in world history.

The main focus is not to increase followership … although that is happening.

As the follower numbers increase, it’s a good sign that more are becoming aware of how manipulated and controlled is the entire narrative.

One way to separate from the effect of the falsehoods, is to become proficient at reading price action. As David Weis used to say, ‘What’s the market saying about itself?’

Which brings us to the current juncture. Gold

Gold, At A Crossroads ?

The current assessment of gold (i.e. bearish or reversal potential) is similar to the dollar from a year ago.

Different from the dollar, are the momentum (MACD, etc.) indicators … which are currently pointing higher.

In the dollar, there was a bullish weekly MACD divergence helping us along.

Not so with gold (GLD).

What we do have, and what the linked list above provides, is a look into a type of mass hysteria.

The ‘pegging the meter‘ article that came out late Friday caused only a blip higher in GLD and GDX.

If we’re at max persistent inflation already, is there any more upside left?

Stay Tuned

Note:  Posts on this site are for education purposes only.  They provide one firm’s insight on the markets.  Not investment advice.  See additional disclaimer here.

The Danger Point®, trade mark: No. 6,505,279

Gold, In Mid-Air

We’ve Been Here Before

CME

As we’ll see in the charts below, gold (GLD) has pushed above resistance three times in the past.

Each time, GLD reversed.

Two of those had GLD print new post, 8/6/20, lows.

The average decline was -11.3%.

During that time, miners GDX, GDXJ, took the brunt of the action.

The last GLD draw-down (6/1/21 – 8/10/21), was about -10.2%, while GDX got whacked top-to-bottom with -28.2%.

At this juncture, miner’s downside price action looks to be leveraged by about 3:1, when compared with gold.

Gold (GLD) Analysis:

The un-marked chart:

The marked chart has the past three up-thrusts above resistance (magenta arrows) and our current potential; the orange arrow.

Note the typical distance price action traveled above the blue line resistance levels.

If GLD does not move any higher from this point, its current distance above resistance is typical when using the past three moves for reference.

Danger Point:

In the markets, anything can happen.

Price action in GLD and miners, GDX, GDXJ are each at their own danger points.

Counter-intuitively, this is where the risk of being wrong is least (not advice, not a recommendation).

Senior Miners, GDX:

Taking the hourly chart of GDX and inverting it, gives us a chart similar to inverse fund DUST but without the tracking (bias) errors.

The inverted hourly chart:

Net downward price action is narrowing; less and less downward progress with each thrust.

This is an indicator we may be nearing the end of the move.

Helping that assessment along, is the next chart. The circled area shows Force Index is also dissipating.

Today’s session thus far, has essentially no more thrust energy when compared to the last two sessions.

Summary:

Price action in DUST, has gone a little farther (lower) than desired.

However, the analysis above tells us there’s nothing, yet, that would indicate an exit of the short position (not advice, not a recommendation).

One has to remember who’s on the other side of this trade; that is, the bull side.

The general public has been led to believe inflation is rampant. The media and various YouTube personalities have whipped them into an inflation frenzy.

Its become some kind of psychosis

Costs are going higher. That part is true.

The reason they’re higher, or at least a different perspective, is available to everyone via Uneducated Economist and Steven Van Metre just to name two.

As Van Metre said about a year ago concerning the actions by the Fed (paraphrasing),

‘Do you think the Fed is going to educate the public and tell them Quantitative Easing is actually deflationary?

No, they will allow the public to have the false belief their (Fed) actions have the opposite effect.

Just a reminder of what the guys above are really all about; Some additional info is here.

Stay Tuned

Charts by StockCharts

Note:  Posts on this site are for education purposes only.  They provide one firm’s insight on the markets.  Not investment advice.  See additional disclaimer here.

The Danger Point®, trade mark: No. 6,505,279

Gold (GDX) Bulls … Time To Hide?

Late Session

GDX Breakdown, Draws Nigh?

We’re not there yet and anything can happen in the meantime.

However, Senior Miner’s GDX, price action has moved lower during this session as expected.

Today has offered up one more clue for the bears provided GDX closes lower.

That is, we may have a channel confirmation:

Fibonacci time sequences are not necessarily always at price extremes. As shown above, they can define the width of a trading channel as well.

If this short (sell) set-up fails (GDX moves higher), we now have a definitive stop area for inverse fund DUST (not advice, not a recommendation); somewhere around: DUST 19.80 – 20.00.

Steven Van Metre in his last update, gave data on how the dollar is in a rally and nearing breakout position.

So far, there’s still a negative correlation between the dollar, gold, and gold miners.

Stay Tuned

Charts by StockCharts

Note:  Posts on this site are for education purposes only.  They provide one firm’s insight on the markets.  Not investment advice.  See additional disclaimer here.

Livermore, Wyckoff, & Loeb

Buffett’s not on the list

After thirty-four years of researching the markets, focus has narrowed to three masters from the early 1900s; providing a solid framework for addressing the markets of today.

More detail on these masters can be found at this link.

Summarizing their knowledge as follows:

Strategy, Tactics, & Focus

This update demonstrates how those tenets are being implemented.

Strategy:

In Livermore’s fictional autobiography (Reminiscences), he muddled around for years before identifying his niche.

That is:

‘What’s going to (or what’s likely to) happen in a big way.’

That insight has been used to identify the biotech sector as ripe for complete (and well deserved) implosion; more so than any other sector in the market.

For many months, the case continues to build for collapse.

Here’s just one more brick in the wall; providing even more support for implosion.

Tactics:

Wyckoff committed his entire professional life to decoding the market and its moves.

He is (as far as available data shows) the father of technical analysis.

Terms like ‘support’, ‘resistance’, ‘accumulation’, ‘distribution’, did not exist before is treatise, “Studies In Tape Reading”, published in 1910.

His bottom line:

Price is moved by a force of its own; having nothing to do (in a causal way) with fundamentals:

‘What is the market saying about itself.’

The biotech sector SPBIO, is tag-teaming with gold miners GDX (and GDXJ), for downside leadership.

SPBIO finished the week down -27.5%, from its February 9th (2021) high; running a close second to GDX, which finished the week down – 27.6%, from its August 5th (2020) high.

From a speed-of-decline standpoint, biotech’s in the lead.

Focus:

Loeb’s brutal admonition was: ‘The naïve, lazy, mediocre, ignorant and the incompetent “diversify”.

His follow-on corollary was: ‘Real market opportunities are few. If one is discovered, it must be used to its maximum extent.’

Loeb’s assessment of those in the market, is not much different from Wyckoff’s:

“The average man never makes a success of Tape Reading.

Right you are! The average man seldom makes a success of anything.” (emphasis is Wyckoff’s).

From the above list, ignorance can be fixed through determination, study, tenacity and the never-ending search for (market) truth.

The others, not so much.

Using Loeb’s tenet, that is, ‘focus’, we’ve taken it and have gone short and continue to go short (not advice, not a recommendation), the biotech sector via LABD.

Summary:

There’s no guarantee the short trade will work out; yielding a significant gain.

Any number of things can happen:

Internet outage, power outage, terrorist attack, supply chain and transportation shut-downs … literally, anything.

However, being short (from a personal standpoint) is better than wringing one’s hands, cowering in fear, looking to the (bought and paid for) financial media to provide direction on what to do in this unstable environment.

Epilogue:

By using the life’s work of Livermore, Wyckoff & Loeb, its been determined, being short biotech (and possibly the mining sector) is the appropriate market stance.

With the caveat that even now, one might need to exit the trade; it still appears at this juncture, the on-going short (not advice, not a recommendation) is the most focused profit opportunity given the current environment.

Stay Tuned

Note:  Posts on this site are for education purposes only.  They provide one firm’s insight on the markets.  Not investment advice.  See additional disclaimer here.

Miners (GDXJ): What’s Next?

It’s possible during the last session gold (GLD) received a final mortal wound to the hyperinflation argument.

Price action in the December contract (GCZ20) dropped over 100 points in a matter of hours.

A retrace is expected … it’s just part of market behavior. 

However, even as gold edges higher, the Junior Miner’s, don’t seem too eager to follow suit. 

Price action in GDXJ has risen just slightly with JDST down 0.50% in pre-market.

The dollar (UUP) has reversed as expected.  It’s got a long way to go higher for any kind of test on wide, high volume action.  Dollar higher, gold typically, lower.

The short position in the Dow (DXD) has retraced somewhat in the early hours. 

As it stands now, the retrace is about 1/3rd of the overall gain thus far; perfectly acceptable.

The focus for the firm’s trading at this point is on the Dow and related markets.  If the position is increased at these levels (and the analysis proves to be incorrect), it could be stopped out the same day.

So we’ll wait to add … for now.

Separately, it should be noted that every single market assessment in the previous update was correct:

GDXJ in up-thrust reversal condition … check

GDXJ finished at high on Friday, Monday’s typically down … check

Gold retraced to 50%, lower price action expected … check

Dollar in its own reversal set-up … check

Dollar up, gold down … check

All that list means, is at this juncture the markets are being correctly interpreted. 

Those interpretations are being done intuitively and without indicators.

Intuition can be skewed by events unrelated to the markets.  For now, it’s operating correctly and we’re going to focus on the Dow.

Note:  Posts on this site are for education purposes only.  They provide one firm’s insight on the markets.  Not investment advice.  See additional disclaimer here.

Market Top?

Was that it?.  Did we see the all time high in the markets, Monday?

The short answer of course, it’s not known. 

The longer answer is, to go short the market at this point (Monday’s session) was a low risk entry; not advice, not a recommendation.

The inverse chart of the Dow, DXD (above) shows our initial entry.  We’re green at the end of the day and have hard stop, GTC, at 13.32.

Tomorrow’s open could be a gap-lower for the Dow, that spends the rest of the session attempting to retrace higher.  If so and depending on the behavior of that price action, it may provide an opportunity to add to the position.

Separately, the gold and related GDXJ, JDST had such sharp moves during Monday’s session that JDST was exited completely and yielded a gain of about 12%.

Gold is likely to retrace higher and possibly offer another low risk (short) position in the miners via JDST.

The trading actions are being directed by the market. It would be nice to have a slower more well behaved situation. However, that’s not the case and the trading response matches the market (price action) dictates.

Charts by StockCharts

Note:  Posts on this site are for education purposes only.  They provide one firm’s insight on the markets.  Not investment advice.  See additional disclaimer here.

Hyperinflation: Hit Hard

The regular session is still thirty minutes away and already gold’s had it’s largest down-swing since August 11th.

Bulls must be stunned.  It’s not supposed to be this way.

Of course, the financial press has to come up with some kind of ‘reason’, so there’re off plying their trade. 

At this juncture, before the open, December gold is down about 4%. 

The dollar is slightly higher as forecast but bonds … TLT, down a whopping 2% in pre-market. 

How can bonds be down (rates up) with the dollar higher and gold lower?

The question itself, is an error.

It’s not ‘why’ that’s important, it’s ‘what’.  Asking why keeps one searching for the wrong answer.  It’s exactly what the media and those manipulating the markets want.

The trail of why goes on forever and leads nowhere.  The why is constantly changing second by second, minute by minute. 

Asking ‘what’ is a different story; what is the gold market doing?  Now, that’s a question.

The gold market is down hard; Very hard.  Shocked bulls, married to their ‘hyperinflation’ narrative, will have to see it as a buying opportunity.

Expect gold to retrace somewhat during this session.  However, the damage has been done. Gold (GLD) is below well established support levels … now resistance areas.

In related markets, the Junior Mining Index, GDXJ is down -5.75% in the pre-market session.  Correspondingly, the inverse fund JDST, is up a stiff 11.5%.

As stated in this update (not advice, not a recommendation), the position in JDST was re-established during Friday’s session. 

Obviously, we’re keeping that position for now and will monitor price action to determine a new stop location.

Note:  Posts on this site are for education purposes only.  They provide one firm’s insight on the markets.  Not investment advice.  See additional disclaimer here.