“At this juncture, it’s not unreasonable to say bonds (TLT) are at The Danger Point®”
It’s now five trading days later and five successive lower closes on TLT.
Wyckoff analysis provided the edge to surmise, the next probable direction for bonds was down.
Now that rates are back on the upswing, the interesting part (get your popcorn ready) is how, or what, the Fed is going to do at the next meeting … Tick, Tock. 🙂
Long Bond Proxy TLT, Daily
If bonds continue lower, it’s going to get more than a little interesting.
At the minimum, one would have advance warning, rates may not be lowered and/or, if they are, that move could be quickly reversed (not advice, not a recommendation).
Note: Posts on this site are for education purposes only. They provide one firm’s insight on the markets. Not investment advice. See additional disclaimer here.
The Cliff Notes version of what’s happening with the SOXX, is this:
NVDA, has not posted a new daily high.
However, the SOXX, pushed to a marginal new daily high, stopped out the short position and now appears to be in collapse (not advice, not a recommendation).
The new daily high for the SOXX, counts as a Wyckoff Up-Thrust and reversal to the downside.
That’s where we are now.
Positioning:
The amateur never gets back in once stopped out (per Dr. Elder). I have long since passed that mental block; repositioned short again (not advice, not a recommendation).
Trade is labeled as SOXS-23-14 … charts to follow.
Note: Posts on this site are for education purposes only. They provide one firm’s insight on the markets. Not investment advice. See additional disclaimer here.
‘The truth has no defense against the man determined to believe a lie.’
Unknown
It’s been proven many times on this site and by others more notable (i.e. Prechter), the Fed is not a leader.
They are followers; essentially reacting (not responding) to what the bond market is telling them.
Done Deal? … Not Yet
The financial press acts like a rate cut is a done deal.
However, when looking at the chart (i.e., the real leader), long bond proxy TLT, it makes perfect sense the Fed would propose a cut at the September 17 – 18, meeting.
It’s what happens between now and then, that’s important.
For clues as to what that ‘then’ could be, we go to the bond market itself.
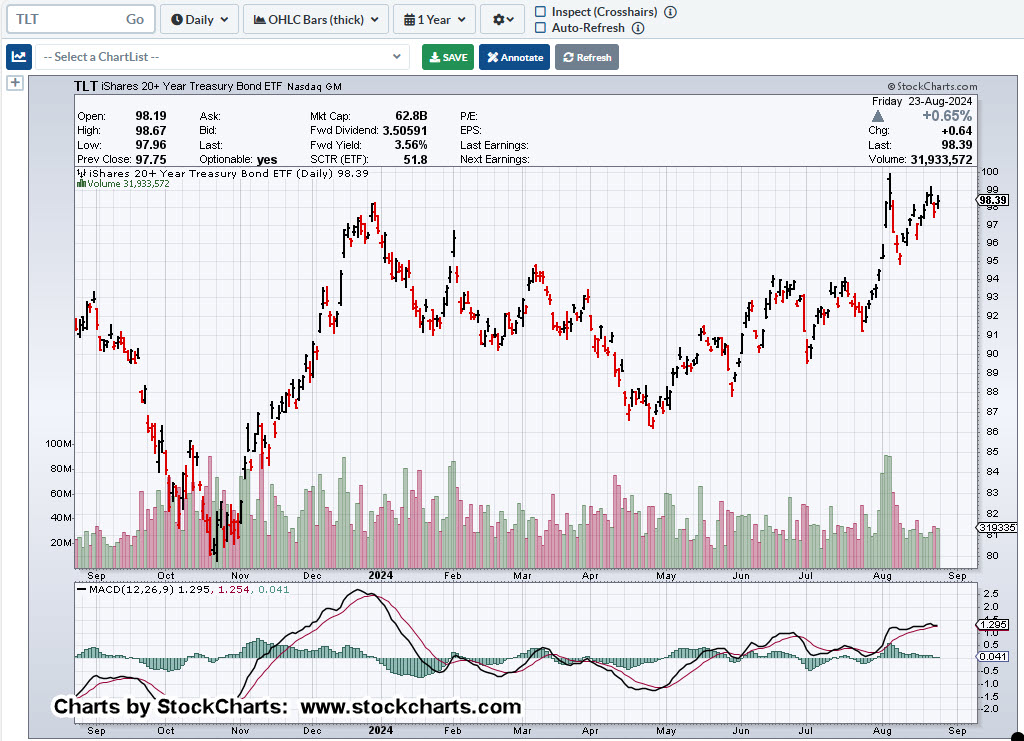
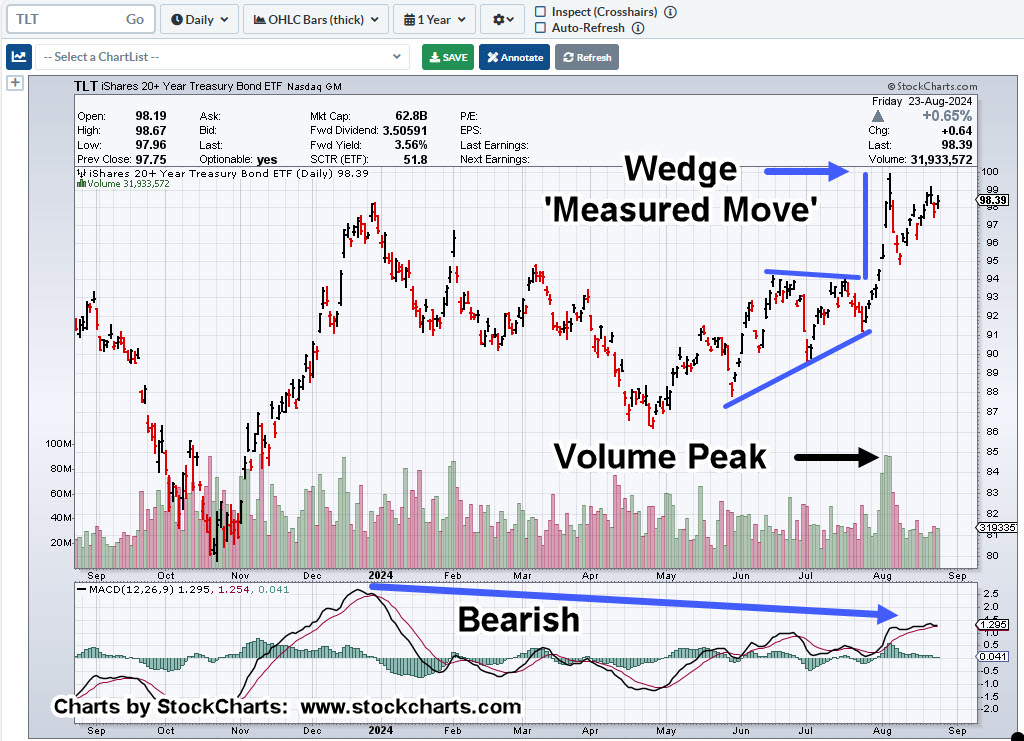
Long Bond Proxy, TLT, Daily
“What do you see?”
There’s a lot going on in this chart; the mark-up (below) is divided into two.
First, is the targeted measured move (that’s been met) out of the wedge formation (not advice, not a recommendation).
Next, we’re also in a Wyckoff Up-Thrust condition which may have been tested on declining volume, this past week (not advice, not a recommendation).
At this juncture, it’s not unreasonable to say bonds (TLT) are at The Danger Point®
It would appear, the weight of a feather could move prices either way.
The interesting part will be what comes next; Sunday overnight Futures open, is about nine-hours away …
Note: Posts on this site are for education purposes only. They provide one firm’s insight on the markets. Not investment advice. See additional disclaimer here.
Note: Posts on this site are for education purposes only. They provide one firm’s insight on the markets. Not investment advice. See additional disclaimer here.
The public thinks rates are coming down. It’s the ‘credible threat’ as Uneducated Economist puts it. The Fed ‘threatens’ to lower rates, and it ‘happens’, sort of.
Actually, rates aren’t lower, but the market has distorted itself, as if they were.
So, let’s get past the narratives and go straight to the truth, price action in the bond market.
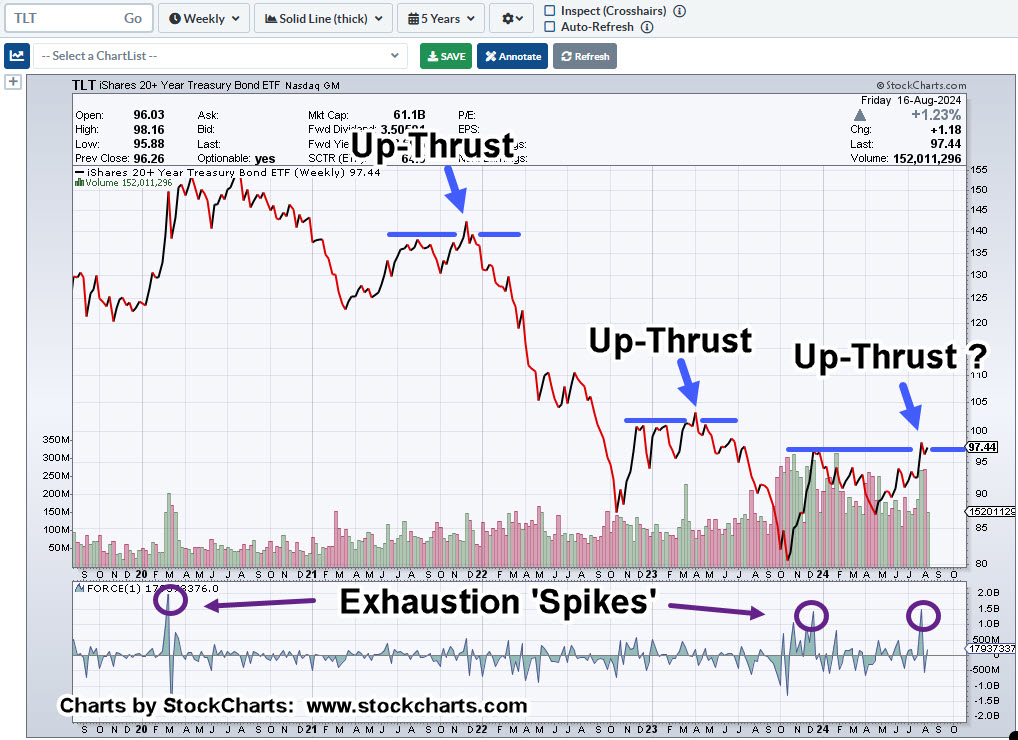
Long Bonds, TLT, Weekly Close
As my mentor Daivd Weis used to say: “What do you see?”
I’ve already marked-up the chart and I see one Wyckoff Up-Thrust, reversal, after another (not advice, not a recommendation).
That, along with exhaustion spikes in Force Index, at or near significant reversals.
The ‘Scary’ Part
Wyckoff analysis is not only price action, it’s volume as well.
Look at the volume in TLT, over the past year.
Massive inflow and what has price done? It’s gone essentially nowhere.
Wyckoff called this ‘Effort vs. Reward’. Lots of effort with little (net) reward.
Add to that, a potential exhaustion spike in Force Index (far right side, purple circle).
Note: Posts on this site are for education purposes only. They provide one firm’s insight on the markets. Not investment advice. See additional disclaimer here.
Those monitoring this site are witnessing the search (for the short entry) in real time.
As said in the prior update, just because Fibonacci lines up, both in time and distance, does not guarantee anything.
From a Wyckoff perspective, as a result of Wednesday’s XBI price action penetrating the prior days’ low, and then stopping dead, there was a probability of a (minor) spring … which we got the very next day.
By the way, that upward move (yesterday) carried the XBI, near another Fibonacci retrace level: 61.8%.
As a result, the LABD-24-17, was exited with about a 3.6% loss (not advice, not a recommendation).
Now, on to the action at hand.
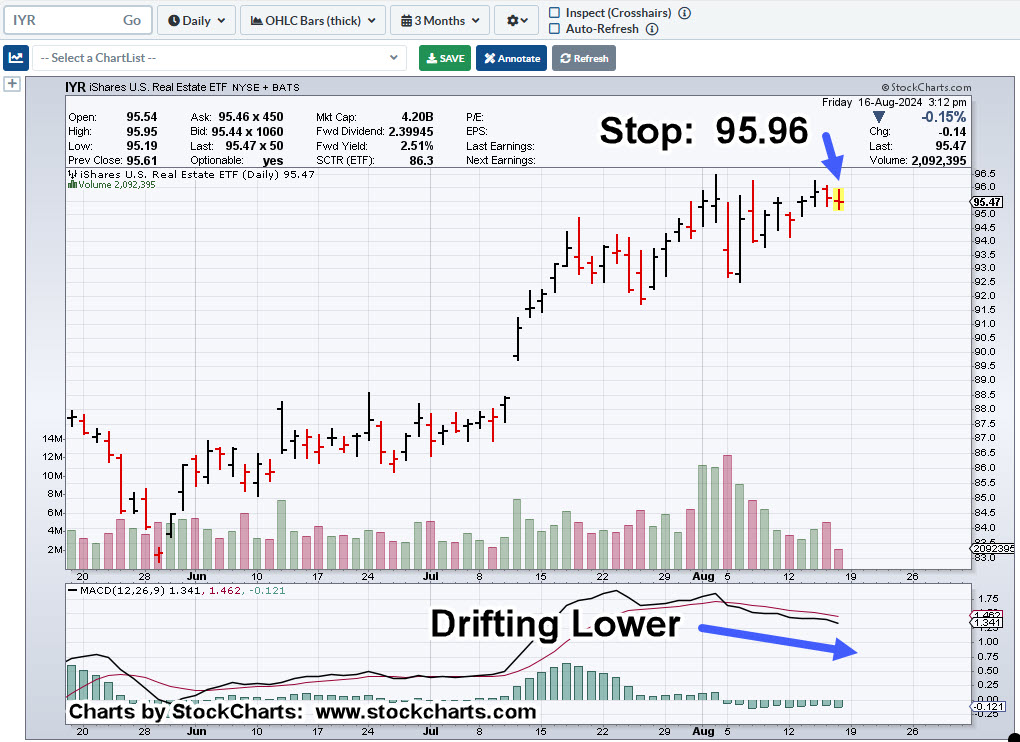
Real Estate IYR, Daily
Depending how price action progresses, we’ll go into more detail on the technical condition.
Today printed a new daily low and we have an MACD (bearish) crossover still in effect.
Trade action was to go short via DRV with a representative stop (for DRV) one tick above the IYR high: 95.96 (not advice, not a recommendation).
Admittedly, it’s a tight stop and that’s the point.
If IYR turns and starts to exhibit buoyancy, we don’t want to hang around.
Note: Posts on this site are for education purposes only. They provide one firm’s insight on the markets. Not investment advice. See additional disclaimer here.
That’s hardly the hundred years or so, one would infer without digging deeper.
The Bond Model
Let’s not forget, bonds had a similar ‘maximum short‘ condition back in 2020.
Back then (like now), the ‘max-short’ was supposed to result in some kind of history making squeeze.
The result? It never happened.
Instead, bonds collapsed, rates launched higher and here we are today.
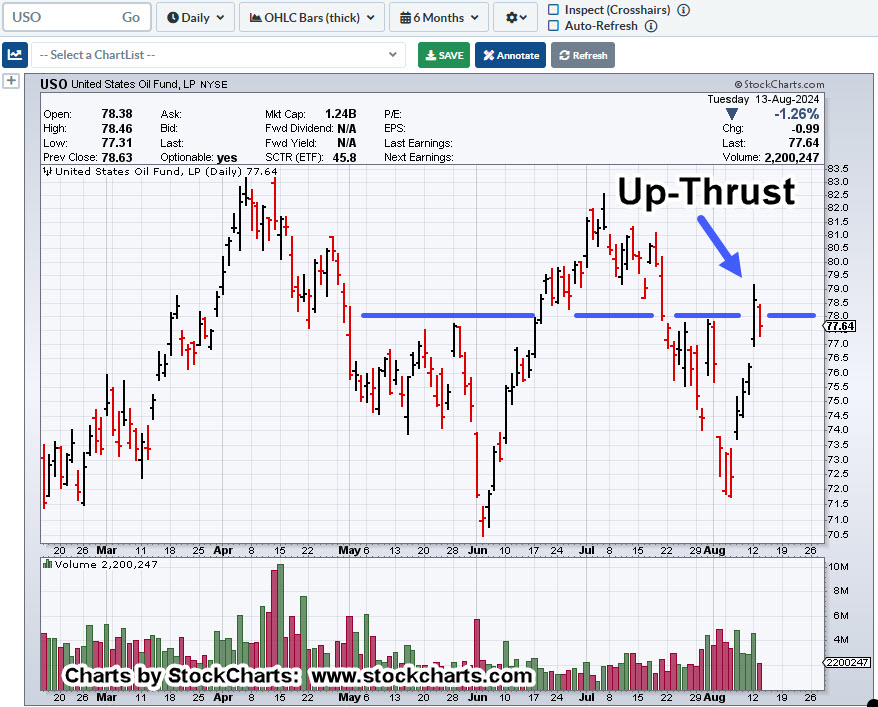
With that, let’s look at oil proxy, USO.
U.S. Oil Fund, USO, Daily
As of today’s action, it’s not looking too good for the bulls (not advice, not a recommendation).
It’s somewhat self-explanatory.
Price action is in Wyckoff ‘up-thrust’ position and with today’s reversal, appears to be confirming (not advice, not a recommendation).
As the earlier post stated, I’m already short the sector, DRIP-24-01, with a definitive stop defined as yesterday’s XOP high (not advice, not a recommendation).
If the ‘max short’ for oil really is the pre-cursor to an upward squeeze, we may be about to find out very soon.
Note: Posts on this site are for education purposes only. They provide one firm’s insight on the markets. Not investment advice. See additional disclaimer here.
Every day, the tape prints one more clue to the next probable direction.
The next probable direction.
Part of an experienced speculator’s pre-market prep is to know from the prior session, the ‘correct’ answer for the current session.
That is, if a set-up has materialized, then subsequent price action will have a specific or variation of a specific pattern.
If the pattern posts on the tape, we have the ‘right’ answer. If not, probabilities are saying ‘no’ at this point.
Of course, the hard part and according to Wyckoff, it laterally takes many years of observing and working with price action to know what to expect.
Real Estate, ‘Wrong’
This morning’s session in real estate, IYR did not post the ‘right’ answer from a short standpoint. A lower open and lower print was the expectation.
Therefore, DRV-24-02, was exited with just over a 2%, loss (not advice, not a recommendation).
However, oil and gas XOP, gave the ‘right’ answer.
Oil & Gas XOP, Daily
The circled price action is what we’re looking for (not advice, not a recommendation).
There’s a lot going on with this chart.
If XOP continues lower and short, DRIP-24-01, is not stopped out or exited, we’ll re-visit this action with further updates (not advice, not a recommendation).
Note: Posts on this site are for education purposes only. They provide one firm’s insight on the markets. Not investment advice. See additional disclaimer herexop
The daily chart of biotech XBI, may be showing us early signals of a trend as well as trading channel.
Back in the day, when being mentored by David Weis, he would typically start the session by putting up a chart on his computer (with me logged in remotely) and then ask:
“What do you see?”
More importantly, he did not ask, what I ‘thought’ or what the Fed was doing, or any other mainstream form of distraction. No, it was always “What do you see?”
So, we’ll do the same.
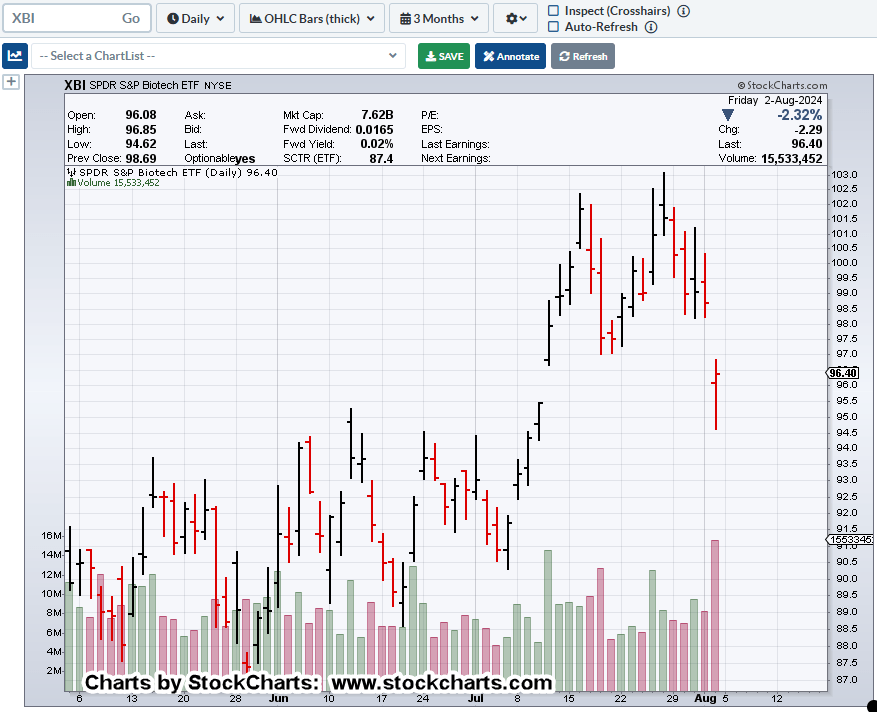
Biotech XBI, Daily
We’re moving in close with the (un-marked) 3-month, daily; what do you see?
Two things should be noticed almost instantly.
Frist: Heavy volume at the last session this past Friday.
Second: Price action (the close) is hanging in ‘mid-air’ with the next support level over two-points away, near 94.0.
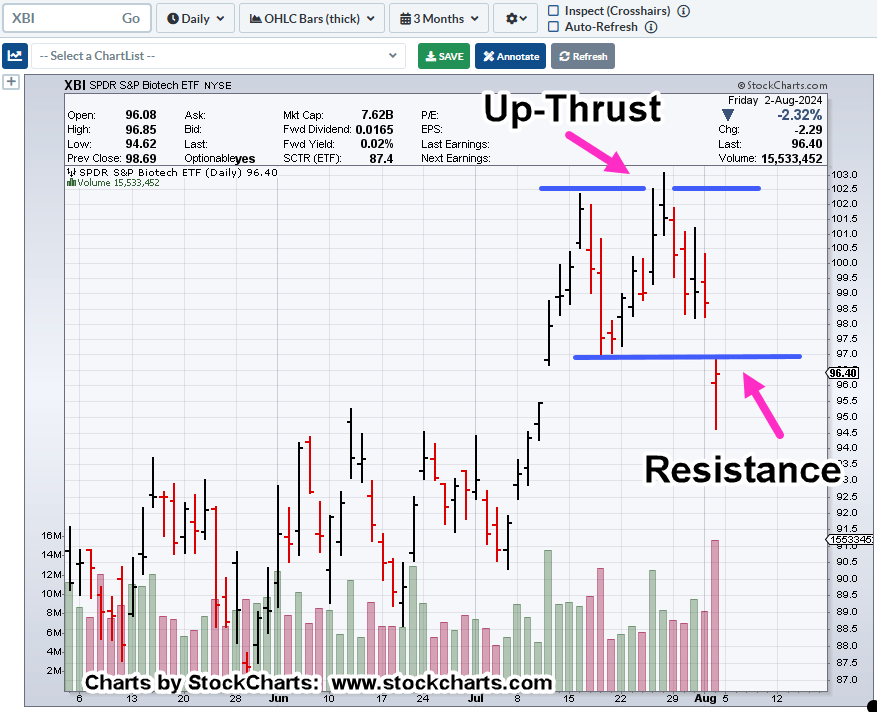
Now, for the marked-up charts.
We’re using the ‘reverse’ trendline technique, presented in the Weis video to determine a potential right side trendline (black dashed line).
Next, we have the Up-Thrust on the daily which is also the right side of the ‘double top,’ shown on the weekly.
Taking both timeframes together, implies a significant inflection point (not advice, not a recommendation).
Anything can happen and the market could recover at the next session.
We’re below support (now resistance) and therefore, technically, in Wyckoff ‘spring’ position.
However, probabilities indicate we’ve had a downside pivot of some significance. That, along with heavy volume at Friday’s session would imply follow through at the next session (not advice, not a recommendation).
Note: Posts on this site are for education purposes only. They provide one firm’s insight on the markets. Not investment advice. See additional disclaimer here.
‘When the tide goes out, that’s when you find out who’s been swimming naked’.
Or, to put it another way:
‘Everybody’s a genius in a bull market’.
Well, ladies and gentlemen, here we are.
We’re about to witness what method’s best suited to handle typical ‘price destruction’ behavior of a bear market (here and here) along with possible chaos in commodities.
That challenge also includes this site of course.
Bear Market Behavior
If we’re really entering a bear market, prices typically do not go straight down unless there’s an outright crash.
No …Bear markets are all about what’s called ‘price destruction’.
That is, price action whipsaws a near infinite number of times; getting into (a short) position for the downside or (long for) an upside squeeze is incredibly difficult.
The most recent example of this was the volatile whipsaws in 3X leveraged inverse fund, SOXS:
Swings over +/- 20%, back-to-back in days if not hours.
With that said, we’re looking at biotech XBI, to see if there’s a chance of it being ‘well-behaved’ during a decline (not advice, not a recommendation).
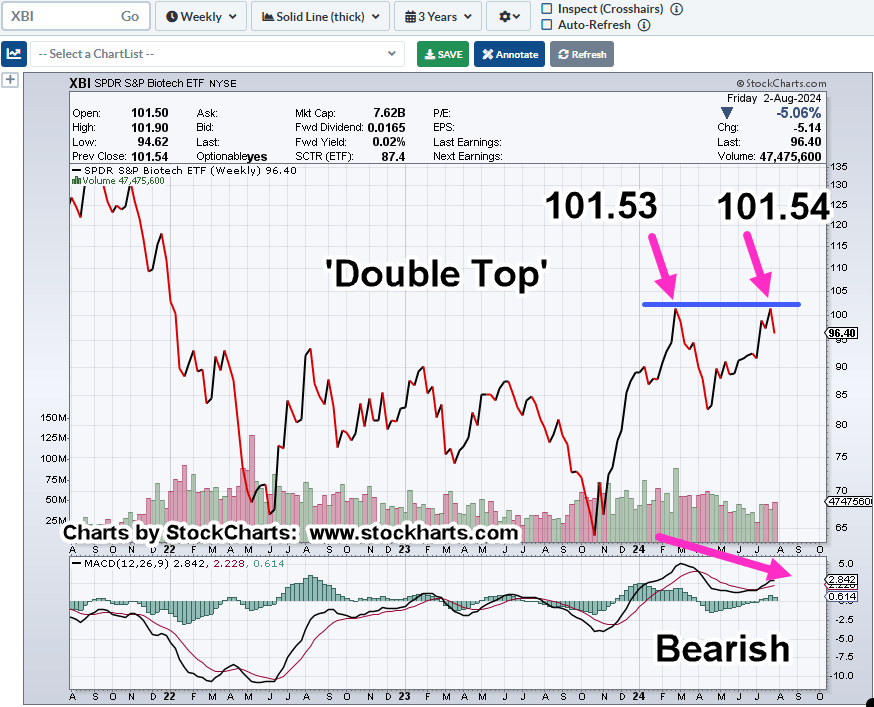
Biotech XBI, Weekly
On a weekly close basis, we’ve had a double top.
Using the MACD, it shows momentum weakened on the leg up to the second top.
Watching price action (the tape) of XBI late Friday, near the close, it gave the appearance of short covering.
Upward spikes that appeared to be labored.
If that’s true, then a lower open at the next session would be the expectation (not advice, not a recommendation).
Taking Action
As the disclaimer states, this site is ‘not certified’ by the SEC and does not, cannot provide any advice.
What it can do, is infer the actions being taken.
With that said, this update shows the ‘category’ side bar with LABD-24-16, thus inferring a short position via LABD.
That’s the firm’s identifier used for spreadsheet tracking; the 16th biotech short via LABD, for the year.
Never Too Early, To Trend
In the next update, we’ll discuss how even in the early stages of (potential) XBI reversal, we may already have a trendline.
Note: Posts on this site are for education purposes only. They provide one firm’s insight on the markets. Not investment advice. See additional disclaimer here.