The Usual Suspects

Special Edition … ‘The Dam Is About To Break’

We have a crescendo of events.

No. 1

Corruption At The Highest Levels

Hearings on Capitol Hill on what we call ‘The Speck’ (to avoid censorship) and “corruption at the highest levels”.

Those of us who are awake, already know about the corruption … it’s just nice to see it hitting the mainstream.

No. 2

Cowards, To Brave ? … Probably Not

Max Igan in this video seems to think those who have been brainwashed into murdering their own children, will all of a sudden become brave and wake-up.

No, an alternate (more likely) view is, those who have been duped, fooled, the cowards, or just plain stupid, will likely turn their anger, not to the perpetrators … but to those who are even now, being referred to as ‘purebloods’.

In his own video, at time stamp 10:30, he shows the type of behavior that may go to a whole new level.

Does anyone think these people are going to become more sane, when they find out the truth of the injections?

No. 3

Greedy Implosion ?

Another Stew Peters broadcast where the guest, Karen Kingston has sifted through legal contracts, patent application and patent abstract documents.

She may have found a chink in the armor.

Looks like in the haste for profits, one manufacturer of ‘Speck’ protection may have done so outside the umbrella of lawsuit ‘immunity’.

No. 4

Robinhood, Swimming Naked ?

It’s happening fast.

When the (economic) tide goes out, that’s when we see who’s left their swimsuit behind.

HOOD stock price may need to brace for impact … at zero.

No. 5

Bear Markets … The Great Equalizer

Everybody’s a genius in a bull market.

When the trend turns South, that’s the opportunity for one’s market skills to stand apart from the ‘genius’ crowd.

As this article says, ‘bear markets are tough’.

Indeed. We can see how tough (and profitable) they are from Livermore’s attempt to short the market during The Panic of 1907.

As stated in Reminiscences, the story goes that he recognized a huge market break coming but started shorting too early … in 1906, as the market continued to rally.

Eventually, those rallies completely depleted his capital. He went broke.

The book goes on to say he began trading again later on but does not say how he got another capital stake; just that his credit was good at the brokerage office of ‘Ed Harding’.

We have to go to Wyckoff’s text from 1910, to find out that Livermore hocked his car for $5,000 and may have used that to re-establish his trading account.

After that, his trading errors corrected, he eventually covered his short positions at the bottom of the panic, October 24th of 1907, with over one million in profits (around 30 million in today’s dollars).

No. 6

T-Mobile: Set To Implode By April

Is dumb going to get smart? Like in No. 2, above, the answer is probably not.

T-Mobile is set for implosion by April.

No. 7

What’s The Motive ?

If you ever watch ‘Forensic Files’ or similar broadcasts, the police and the lawyers are always looking for the motive to commit the crime.

Well, here it is.

No. 8

And Then, There’s This …

Activist Post in this article is naming names.

Data and artifacts are piling up to dam-break levels.

There’s a virtual army of citizen journalism working to discover and sift through databases and documents.

No. 9

The Parting Shot:

What does any of this have to do with the markets?

Well …

Get your popcorn ready, ’cause Kansas is going bye, bye ….

Stay Tuned

Note:  Posts on this site are for education purposes only.  They provide one firm’s insight on the markets.  Not investment advice.  See additional disclaimer here.

The Danger Point®, trade mark: No. 6,505,279

Depopulation, is Deflationary

‘Safe And Effective’

Independent sources confirming, Americans are now dying at unprecedented rates.

This article just out from Activist Post, contains two (possibly three) sources, each confirming the numbers.

One of the earliest posts that discussed mass depopulation, is linked here. Line-item No. 1, starts it off.

Murder For Hire

This post from September last year, discussed the ‘Elephant in the room’.

“That elephant is, we’re at the front end of a potential mass genocide event (that’s already underway).”

Now, here is verifiable proof of just one avenue for ‘deflation’; i.e. demand is literally going to die-off.

This on-going tragedy or ‘plan’ depending on the source is not going to end anytime soon. In fact, we’re still at the front end of what will last for decades.

The medical establishments in the ‘proof’ link above, know exactly what they’re doing; their actions affect millions, if not billions, world-wide.

Fundamentals Of The Matter

This time, the fundamentals do matter.

By now, we all know the backdrop for the entire population world-wide, is ‘shortage’.

Shortage of almost everything.

However, one thing’s not short; stupidity.

We seem to be full up on that. Anecdotal evidence from a trip to the local Target had people still getting in line, apparently of their own free will, for injections.

At this juncture the results are starting to pile up.

One local school is so short-staffed from ‘illness’ (i.e. potential adverse effects), it closed this week; planned to re-open this coming Monday.

Dead Paradigm: ‘Money Management’

Schools are a microcosm of the entire population.

If schools are closing, what’s going on in the other industries? Just for argument, we’ll keep our focus on the ‘wealth management’ sector.

A quick check of a randomly selected ‘partnered research firm’ that has $1-Trillion in assets, 19,000 financial professionals, partnered with 800 institutions, shows in their market commentary, it’s nothing but, ‘blue skies ahead’.

With stats like that, one can surmise: This Is The Herd

The herd sees nothing but blue skies. All is well.

The Netflix implosion could be used to paint market potential as a whole (not advice, not a recommendation): Down over 20%, instantly.

Dan, from i-Allegedly, with his thousands of contacts, has repeatedly stated, the old way of doing business is not coming back: It’s over.

If you’re running a juggernaut of 19,000 ‘professionals’, how fast are you going to be able to change course if/when the market implodes?

New Paradigm: ‘Centralized Management’

You can almost feel it.

That may be the likely outcome of the potential wealth management implosion (not advice, not a recommendation).

That’s if the markets can even survive.

At time stamp 20:49, in this link, Dan may have given us the model for the entire commercial structure, post apocalypse.

After the small and medium businesses have been destroyed, it’s time for a centralized approach.

After it’s all over, if you’re ‘certified’, the centralized method may be all that’s left (not advice, not a recommendation).

Throw in the requirement to be fully ‘injected’ to be part of a centralized firm and voila!, It will become even more centralized as the management population naturally decreases (rapidly).

Taking that to its logical conclusion, as the ranks of certified managers decreases, the only ‘managers’ left will be those who are exempt; the government employees, i.e., the final solution.

There’s more than one way to confiscate an IRA (not advice, not a recommendation).

The War Room

As the ‘About‘ page has stated, we’re in a war; a financial war.

The rules of the game have changed.

The old way of gathering assets, making sure you don’t lose too much money or posting small gains, intentionally keeping clients blissfully ignorant (by spouting garbage like ‘due diligence’), is over.

What’s needed now, at least for starters, is straight talk and the truth; or as much of it that’s currently known.

So far, what is known is this:

Results of mass-injections are starting to show. The largest die-off in recorded (by insurance firm’s) history.

Shortages of everything and especially the food supply (search on this site for keyword, Genesis 41).

All market bubbles appear to be deflating simultaneously; gold miners and biotech leading the way.

The typical money management firm, if they’re nimble enough will begin to ‘minimize losses on the way down’.

They only know, or can only work in one direction: Up

After meeting with a reputable manager ($100s of millions under management) and asking him if he works the downside, the response was: ‘The clientele can’t handle the volatility’.

So, the answer is no.

The fastest, potentially most profitable direction, the direction that trading professionals prefer, i.e., ‘down’, is not worked by a typical firm. They wait for the upside.

What’s The Market Saying?

Wyckoff analysis focuses strictly on what the market’s saying about itself.

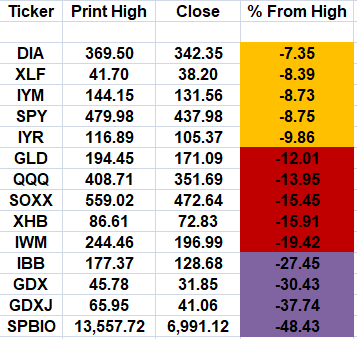
Looking at the table above, that market clearly shows, gold miners and biotech leading the way down; potentially going much lower and each for their own reasons.

On deck for tomorrow, a technical look at gold and the miners; what may be in store for continued downside action.

We’ll discuss Newmont’s apparent reversal; Juniors as the weakest sector, along with P&F and Fibonacci projections.

Stay Tuned

Note:  Posts on this site are for education purposes only.  They provide one firm’s insight on the markets.  Not investment advice.  See additional disclaimer here.

The Danger Point®, trade mark: No. 6,505,279

Front Running The News

‘Out In Front, By A Year’

A pattern begins to emerge.

That is, the strategies and research presented on this site are leading actual news events by about twelve months.

Example No. 1: The Dollar Rally

The dollar rally potential (when first recognized) was presented in this post over a year ago.

Since then, about 10 – 11 months later, ZeroHedge picked it up only after it had become a full-blown reversal.

The dollar has continued to rally and is currently (after breaking support), in Wyckoff ‘spring position’.

Example No. 2: The Food Supply & ‘Inflation’

One of the earliest posts discussing the intentional destruction of the food supply, is linked here.

From that update, we had:

“The entire U.S. agricultural food supply infrastructure is being systematically dismantled.”

Those statements looked hyperbolic at the time.

Obviously, at this point, it’s becoming common knowledge; at least for anyone that’s listening.

Example No. 3: The ‘Speck Effect’

In what may have seemed like a brutal rant, has now become fact.

This rendition of ‘The Night Before Christmas’, posted over a year ago, had no links to support the intuitive assessment of what was to come.

That post has now been updated with the facts.

Warning Note:

Obviously, not everyone injected, is a coward.

Children are rightly terrified. Let’s be realistic.

However, the idiot parents and enabling Doctors and Pharmacists are (eventually) likely, as Dr. Vernon Coleman puts it, to be arrested and tried/convicted for either murder or attempted murder.

Summary

There are other research examples like gold and the gold miners but the three above, cover the picture fairly well.

From the data presented, it’s apparent at least two things are happening simultaneously.

No. 1: Strategic Analysis

World, market, and local (within the U.S.) events are researched and analyzed for potential impact.

No. 2: Market (Wyckoff) Analysis

Those events from No.1, are then linked to market action if any. Potential opportunities are identified.

The Path Forward:

This update is a very brief description of the site’s go-forward objectives.

What’s here, is a long-term (documented) track record of situational awareness; coupled with reading price action which in turn, is used as a case for market positioning.

Stay Tuned

Note:  Posts on this site are for education purposes only.  They provide one firm’s insight on the markets.  Not investment advice.  See additional disclaimer here.

The Danger Point®, trade mark: No. 6,505,279

Gold … $1,300/oz, Or Lower ?

From Stacking, To Panicking

It may go down as the biggest strategic ‘stacking’ blunder ever:

The consumer’s maxed-out, food supply chain’s being systematically destroyed and now, gold’s set to down-draft nearly 20% … just for starters.

For those still thinking it’s all about inflation, how about this personal anecdote (skip to Analysis, Gold (GLD), if not interested).

Anecdote:

A recent trip to the local Ford dealer to obtain an engine part, specifically, a “Camshaft Synchronizer”, i.e., what used to be called a ‘distributor’, a very common part, resulted in this conversation.

Ford: ‘Ok, part number F8DZ-12A362-AA.

Don’t have it. It’s on back-order. We’ve got an order for 347 units, with no ETA‘.

This part’s used on V-6 production engines going back decades. It happens to be a weak point in the design. When it goes out, the engine quits.

With literally millions of these engines on the road, how can there be no repair parts available?

None of the retail dealers in town had one either; not AutoZone, not O’Reilly’s, nobody.

Another Ford dealer located 50-miles away, had one unit and so the order was able to be filled.

If your car/truck is dead-in-the-water, how much would you be willing to pay to get it back on the road?

Imagine if there’s some gearhead Bubba out there who’s stockpiled a thousand of these things … how much could he charge for them?

Now, that’s what I call ‘Stacking’. 🙂

Controlled demolition of the supply chain: Not inflation.

Which brings us back to gold (GLD).

Analysis, Gold (GLD)

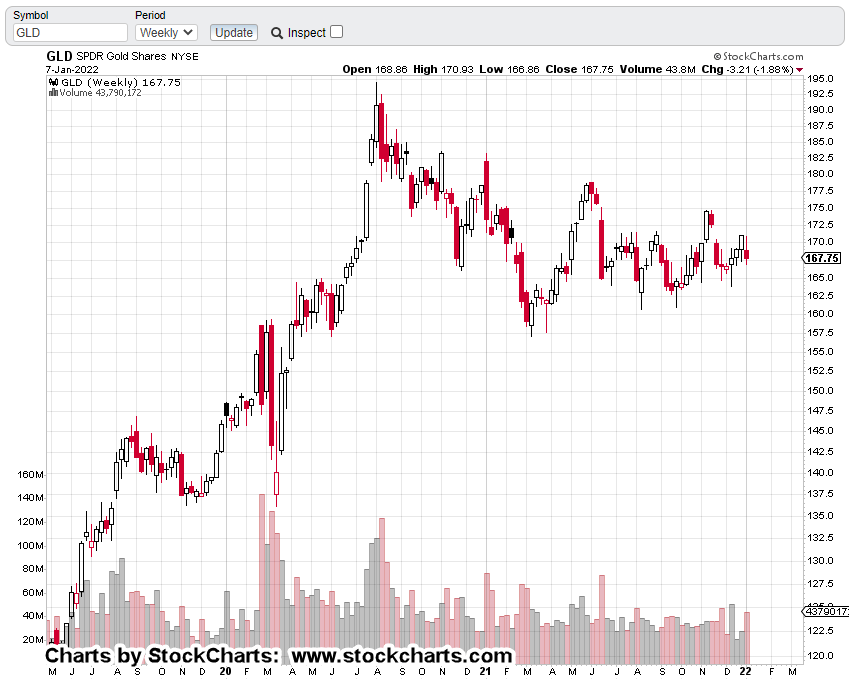
Weekly chart of GLD below and then inverted.

Inverted with projection.

Old Time Projection Method: The P&F Chart

Since it was Wyckoff analysis that helped us plan and spot the gold reversal, we’ll use a method equally as old to project where GLD could go (not advice, not a recommendation).

The P&F Chart.

Using the two methods above, we’ve got a combined projection in the range from GLD: 119 – 140; a decline in the vicinity of: -16.50%, to -28.96%

Is anyone even remotely prepared for this?

Important Caveat

There’s been no wedge breakout … yet. So, the projection’s a little ahead of itself.

What we do have, is a miner’s market that doesn’t look like it’s waiting around for gold.

For the miners, other factors could be coming into play; not the least of which is massive corporate stupidity.

Remember this post?

If your management’s focused on solving problems that aren’t even real … how can they ever hope to run a complicated and dangerous mining business?

Gold Steady, Miners Down

Yet another scenario, is that gold could remain steady or even rise and yet the miner’s collapse.

How can that be?

Let’s remember where a good chunk of gold is being produced: Australia and Canada.

We’re not going to get into what’s going on in these two countries except to say, they’re not exactly outfitting themselves for continued sucess: quite the opposite.

How long will it be before we hear about mines being shut down as a result of staffing shortages.

Stay Tuned

Charts by StockCharts

Note:  Posts on this site are for education purposes only.  They provide one firm’s insight on the markets.  Not investment advice.  See additional disclaimer here.

The Danger Point®, trade mark: No. 6,505,279

And Then, There Was One …

Newmont Pushes To Extreme

When a profitable position begins to erode, the questions begin.

Is it just a correction or a full-blown reversal; how do you know?

Of course, nothing is ever known for absolute sure.

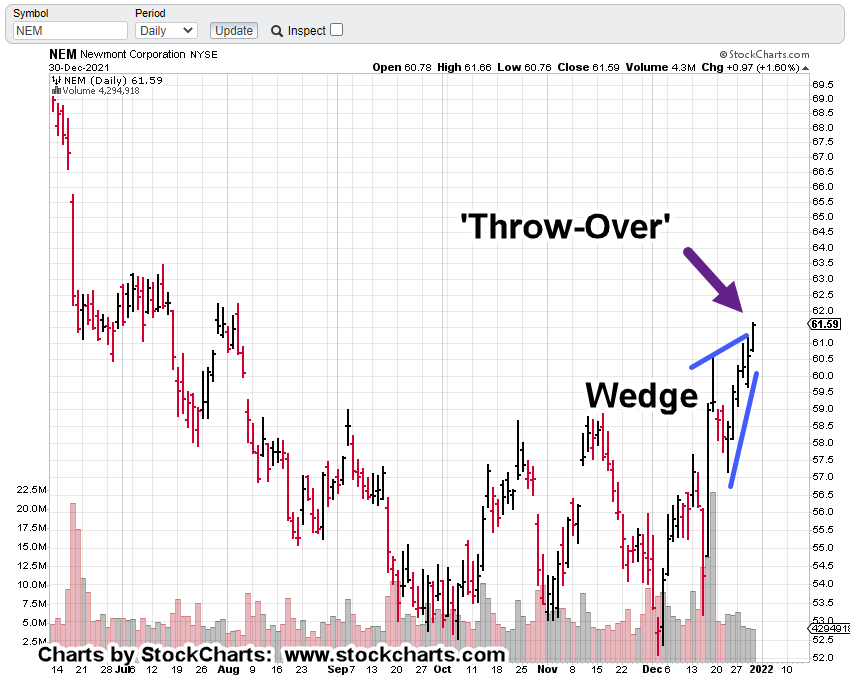
However, in the case of the current trade DUST-21-01, which is a short position on GDX (not advice not a recommendation), the market’s exhibiting what looks like terminal (reversal) behavior.

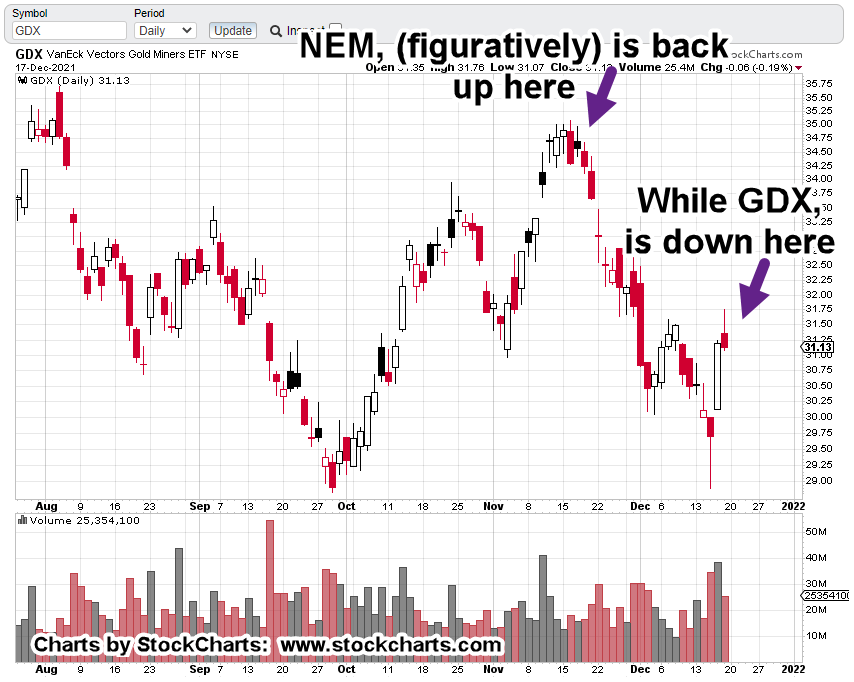
Of all the thirty-one equities in the Senior Miners GDX, only one is above its mid-November highs: Newmont Mining.

Newmont, NEM

With Newmont getting all the attention, the view is the entire market is ‘thinning-out’.

In addition, price action in Newmont tends to suggest it’s exhibiting terminal behavior.

Daily chart below.

It looks like NEM has just ‘thrown-over’ its wedge pattern. Typically, the last gasp before reversal.

Zooming-in

Summary

With markets reaching new all-time highs yet again, the gold miners are showing they’re not invited to the party.

From a Wyckoff standpoint and for bear markets, the focus is on the laggards … not the ones at the top (not advice, not a recommendation).

Unless the dynamic of GDX changes, and others in the index push past their mid-November highs, this market continues to look ready for reversal.

Stay Tuned

Charts by StockCharts

Note:  Posts on this site are for education purposes only.  They provide one firm’s insight on the markets.  Not investment advice.  See additional disclaimer here.

The Danger Point®, trade mark: No. 6,505,279

Newmont: At The Crossroads

Time To Decide

In the markets, sometimes a decision is quick. Sometimes, it takes days or longer.

Back in mid-November, it took eight days above resistance before the market decided enough gold bulls had been trapped; then headed lower.

As we’ll see below, we’re at another decision point.

Newmont (NEM) Daily Close

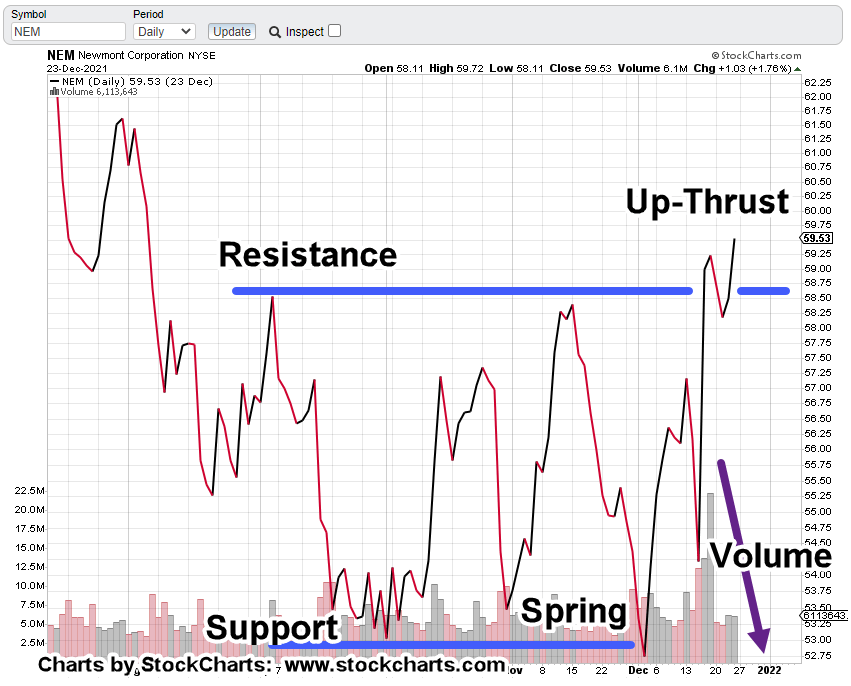
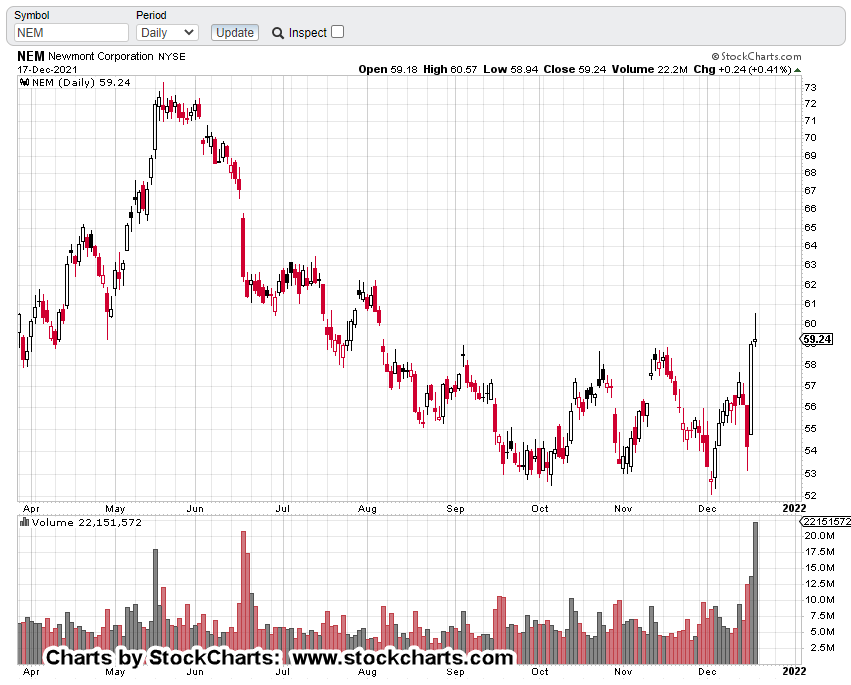
The un-marked chart gives the impression that Newmont’s headed higher. It even looks like there’s been a test of its breakout above the 58.00 area.

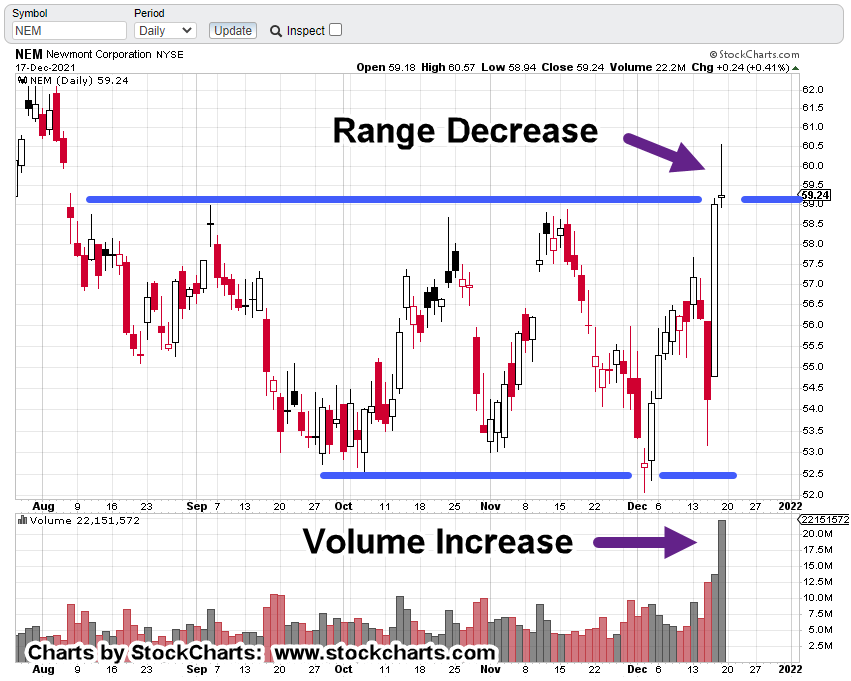
Let’s start marking-up this chart Wyckoff style to see what’s really happening.

For sure, price action has pushed above the 58.00-level.

In so doing, its gone from ‘Spring to Up-thrust’; a potentially bearish (reversal) set-up.

Adding to a bearish view, volume has declined significantly.

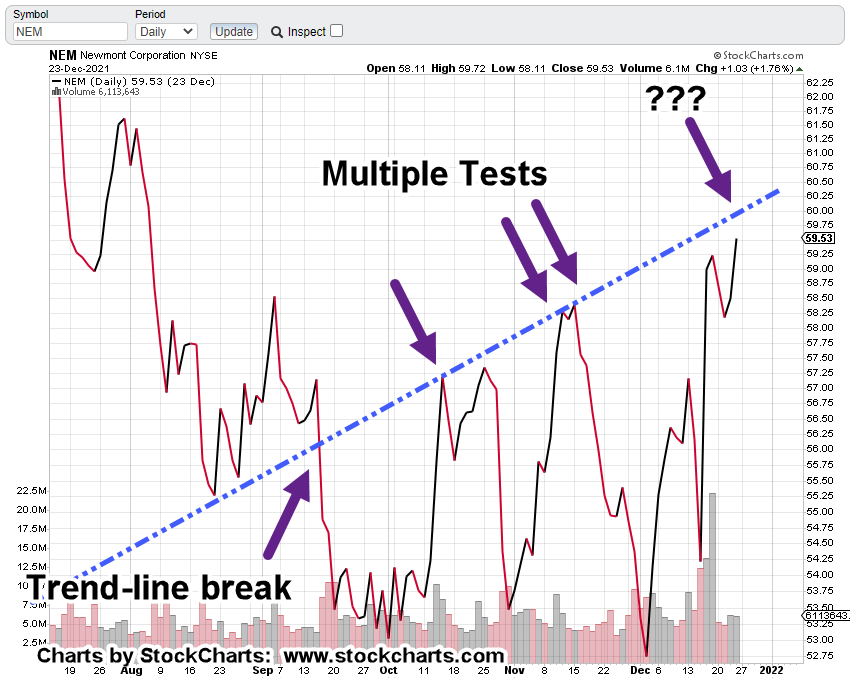
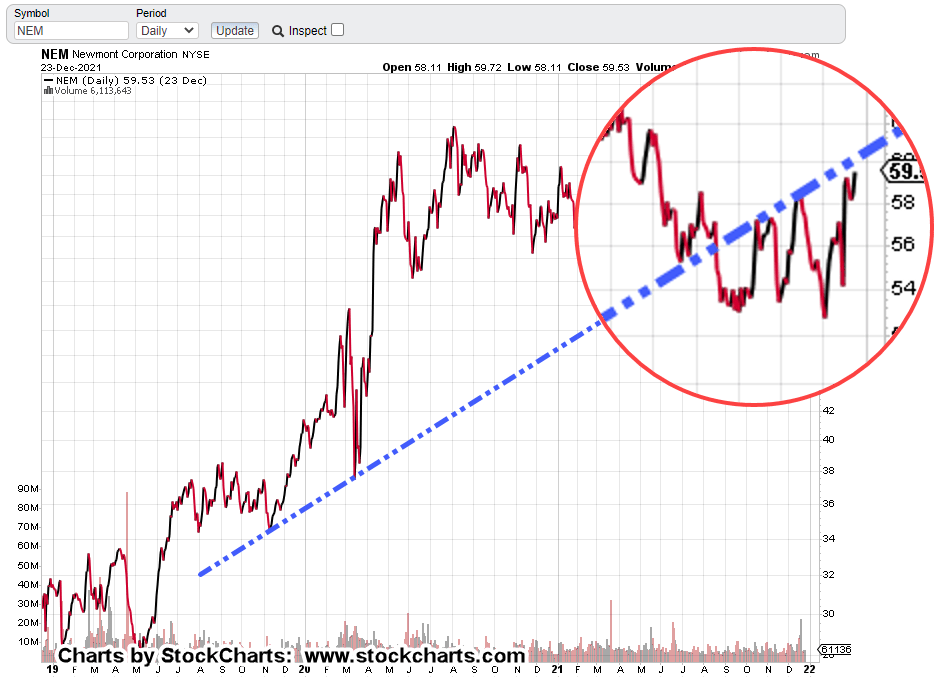
However, that’s not all. We’ve got some kind of trendline break with multiple tests as well.

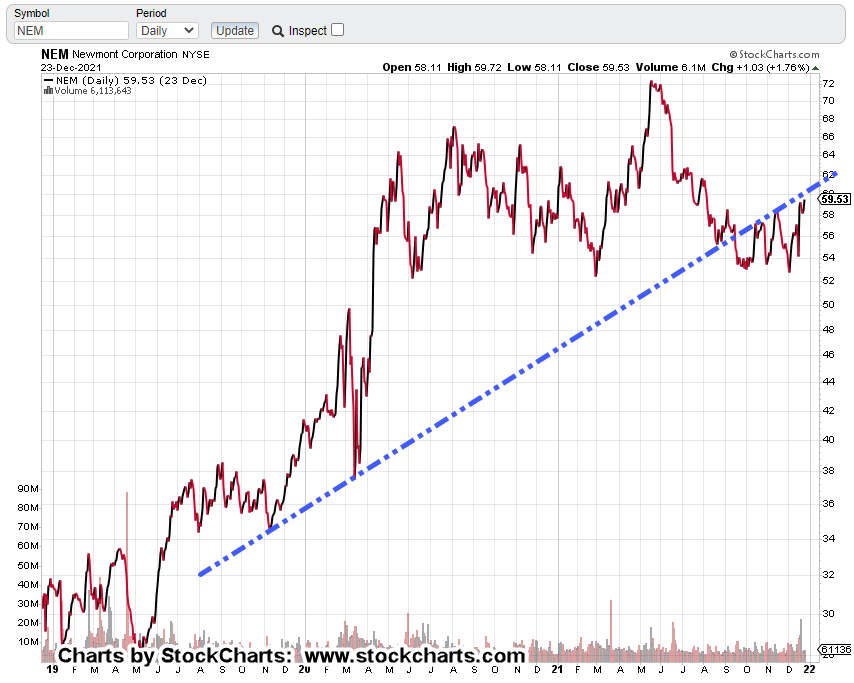
Pulling farther out, we see that trendline has been around for some time.

Getting closer-in on that longer term chart shows the congestion of testing action.

Summary:

Newmont’s got itself into an up-thrust (potential reversal) while testing the underside trendline.

That trendline goes all the way back to late 2019.

Out of thirty-one (31) equities in the GDX, only Newmont’s at its mid-November highs.

All others are lower.

This market’s thinning-out.

Unless the dynamic changes, money is exiting the lower cap equities completely and/or, being pumped into Newmont; a classic bearish harbinger.

Obviously, this can go on for a while.

However, Newmont’s already at the crossroads; Underside test and up-thrust.

Stay Tuned

Charts by StockCharts

Note:  Posts on this site are for education purposes only.  They provide one firm’s insight on the markets.  Not investment advice.  See additional disclaimer here.

The Danger Point®, trade mark: No. 6,505,279
Talking Turkey

Lessons From Mr. Partridge

From Reminiscences of a Stock Operator, ‘Turkey’, aka Mr. Partridge, was much older than the rest.

The rumor in the broker’s office was that he was rich.

Even so, he was not contributing to heavy commissions (i.e. day and swing trading) as far as Livermore could tell.

The other thing was, that he never offered advice.

If a stock tip worked out, he would thank the tipster … if not, you never knew if he took a position or not.

Losing The Position & Psychological Impact

Turkey’s ‘losing the position’ remarks impacted Livermore the most. He recognized that Partridge wasn’t some old duffer; he was an astute speculator.

Losing the position: Not the same as holding a loser.

Maintaining a profitable position during a correction while at the same time, recognizing a big move could be in the works, requires (mental) strength; let the market itself say when to get in and out.

This link has Prechter’s ‘missing out’ story on big gains.

Continuing on with Turkey.

In the book, he said he ‘paid a high price for his tuition’ and does not want to incur a second fee.

Attempting to ‘play’ the market in and out then repeat, by definition, leaves one out of the big move.

It’s not the move itself; it’s the recognition that fiddling with the position and losing it, has resulted in a lost opportunity that will never come back.

The psychological damage is immense.

It’s worse than taking major loss. Watching a move take off without you when you had planned for months (or years) for the set-up, may have left no way to recover.

Which brings us to the market at hand.

Gold (GLD):

This site is not advice, and it does not make market ‘calls’.

Presented here, are posts documenting how Wyckoff analysis is being used to spot market set-ups.

Those set-ups have shown themselves over time to be potentially profitable (not advice, not a recommendation).

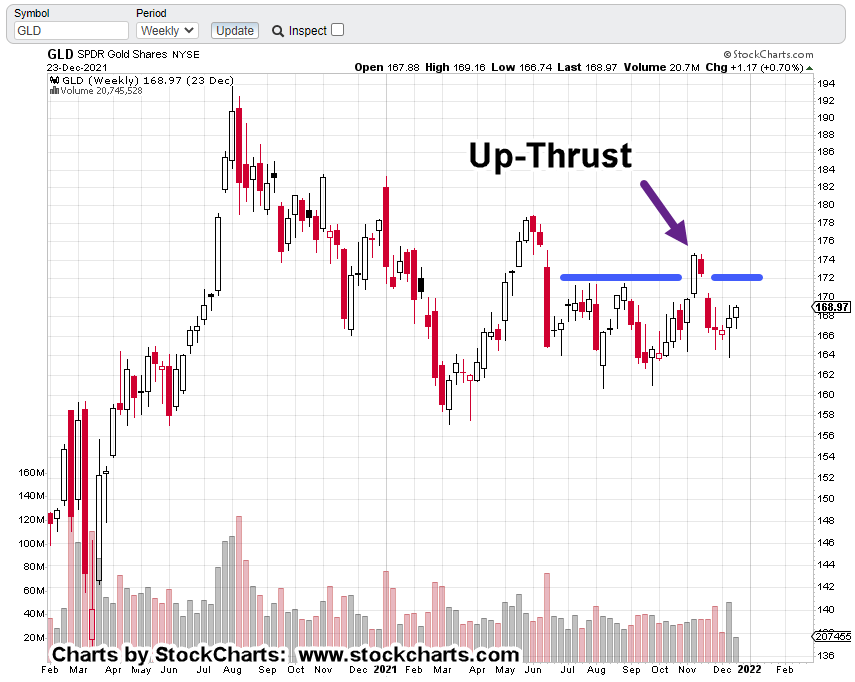
The weekly chart of gold (GLD) shows the up-thrust that was months in the making.

We’re going to invert the chart and so, the ‘up-thrust’ now becomes a ‘spring’.

Note:

Back in the day, when I wasted time posting on SeekingAlpha, I would get numerous complaints about ‘inverting the chart’.

They wanted it spoon-fed and did not have the mental plasticity to look at situations from the opposite perspective.

The ‘inverting the chart’ came from none other than Dr. Elder, himself … discussed in Trading For A Living or Come Into My Trading Room if memory serves.

The main interest on the ‘Alpha’ site seems to be pontificating about how sharp your pencil is; how close you can come to guess what earnings (or some other meaningless fundamental) will be at the next release.

I have not been back in years … they’re probably out there still arguing … only this time, the banter may be about which “masks” are most effective. 🙂

But I digress.

Months To ‘Spring’, Weeks To ‘Test’:

The inverted chart of GLD shows it took months for price action to penetrate support and create a spring condition.

Since then, we’ve had a move higher and now lower coming back near support.

Is this a test or a failure of the move?

It was a short week. However, it may still provide actionable data. For example, range of GLD, GDX and NEM, all narrowed. Volume contracted as well.

The inference is, thrust energy is weakening and thus weights the probabilities to a ‘test’ and not a ‘failure’.

Deflation Pivot:

Interestingly, we’re starting the see the consumer has finally reached the limit of their spending. Price are staring to edge lower as reported here and here by Economic Ninja.

Another data point, a bit esoteric, is ammunition. Pices are starting to taper off as well. Most notable is 22-LR.

A couple of months ago, 22-LR was about 0.10 per round (bullet). Looking at this site, we see the cheapest price has dropped to .080/round.

That does not look like much but it’s a 20% decline.

Summary:

Everyone has their own time frame and market approach.

Taking a cue from Turkey, referenced above, I would rather sit through a correction, incur the erosion of profit than exit and ‘click my heels’ as Prechter puts it; then watch the original position move for a huge gain without me aboard (not advice, not a recommendation).

We’re likely to find out very soon if this is a major pivot lower or if somehow, gold (GLD) bulls gain control and drive prices higher.

Stay Tuned

Charts by StockCharts

Note:  Posts on this site are for education purposes only.  They provide one firm’s insight on the markets.  Not investment advice.  See additional disclaimer here.

The Danger Point®, trade mark: No. 6,505,279

Newmont Holds The Key

‘Last Man Standing’

Founded by William Boyce Thompson in 1916, Newmont (NEM) was around over a century ago during Livermore and Wyckoff’s day.

Thompson is center in the photo with President, Warren G. Harding at left.

Wyckoff and Thompson were interconnected.

In Wyckoff’s autobiography, he writes about working for Thompson’s firm (Thompson, Towle & Co.) in 1910.

During that time, he describes no fewer than two stock ‘manipulation’ schemes; one by renowned James R. Keene and the other by Thompson himself during a deal-gone-bad with the Guggenheims.

Also in 1910, Wyckoff published his seminal work: Studies In Tape Reading. If there’s any one book to read concerning how markets work, ‘Studies ..’ is that book.

Wyckoff had first-hand exposure into market operations by the wealthy and super wealthy. More importantly, he saw how those transactions showed themselves on the tape.

Last check, a first edition ‘Studies’ went for around $3,500. A quick search as of this post, turns up nothing currently available.

For those who complain ‘it’s rigged’, to that we can say, ‘it’s always been rigged’.

Determine what those ‘rigging’, are trying to accomplish and you may have a trade.

Now, to the market at hand: Newmont Mining.

It’s the key; the largest cap equity in the Senior Mining Index (GDX).

Newmont, NEM

The daily chart:

For those who have been with this site for a while, you may instantly see the set-up: Spring to Up-Thrust.

The marked-up chart makes it clear.

Moving in a little closer for additional clues:

We can see from the volume itself, there were a huge number of transactions this past Friday.

NEM penetrated long established resistance.

In so doing, it set off a massive number of orders: Buy orders, sell orders, sell-short.

Senior Mining Index: GDX

The other part of the story and the one that weights it to the bears:

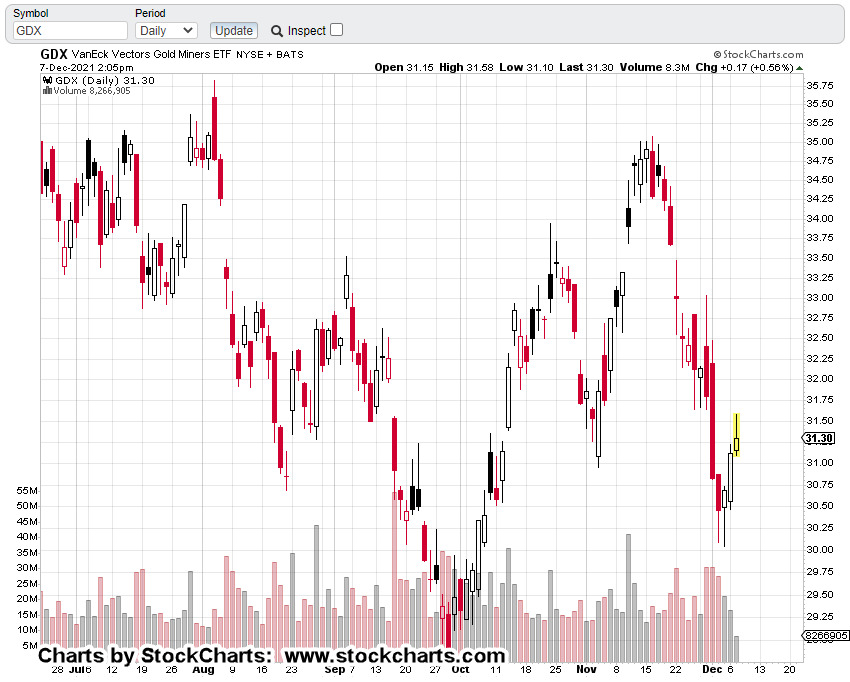
While NEM, is at multi-month highs, senior miners GDX, is nowhere near its highs.

Daily chart, GDX:

What does that mean?

It means the market is ‘thinning-out’

The professionals and maybe some investors alike, are abandoning the non-performing lesser cap equities; pouring funds into the last man standing NEM, in hopes that it will keep moving higher.

It’s desperation and signals market weakness.

As always, anything can happen and bulls may somehow take control.

However, from the charts themselves, hyper-stretched major indices coupled with insiders bailing out the most in history, uneducated ‘retail’ willingly stepping up to hold the bag, it does not look good for any bulls … gold or otherwise.

Summary:

We could find ourselves in a situation similar to the oil market in mid-2014 where it spontaneously deflated for eighteen months … nary a blip higher all the way down.

With that, we’re maintaining short via DUST (not advice, not a recommendation).

Stay Tuned

Charts by StockCharts

Note:  Posts on this site are for education purposes only.  They provide one firm’s insight on the markets.  Not investment advice.  See additional disclaimer here.

The Danger Point®, trade mark: No. 6,505,279

Inflation … Hot or Not ?

Monetary Does Not Equal Asset

If there ever was a CPI report to completely break the ‘inflation’ narrative, this was it.

Several articles, here, here, and here, all saying essentially the same thing … skyrocketing ‘inflation’.

If that really was true, why is the 5,000-year-old hedge against inflation (gold) not responding … and even worse, heading lower?

That’s because, it’s all rigged, man !! (cue, Tommy Chong).

Well, it has always been rigged.

Both Wyckoff and Livermore talked about that ‘rigging’ way back in 1921, when Wyckoff interviewed Livermore about his trading methods. Later, in 1922, a series of articles on Livermore was published in Wyckoff’s ‘Magazine of Wall Street’ (a forerunner to Barron’s).

The point is, we’re not interested in who is doing the rigging. That’s what the press tries to find out (a waste of time). The real question is, what are those ‘rigging’ trying to accomplish?

Answer that, and you may have a potential trade set-up.

We’ve got supply chain, controlled-demolition with corresponding asset price inflation; the kicker is, gold and the dollar, say we’re in some kind of monetary deflation.

Senior Miners, GDX Confirming Trend

Price action in the gold market and the miners confirm that (deflation) assessment … for now.

Zoom-in on trend line contacts.

Summary

Based on the articles linked above, if there ever was a data-set release that would launch gold (and the miners) higher, today would be the day … right?

Both Wyckoff and Livermore did not concern themselves with what ‘should’ be happening. They were focused on what ‘is’ happening.

Gold and the miners are (and have been) moving lower.

As yesterday’s post said, we’ll remain short (not advice, not a recommendation) until the market itself says to exit.

Stay Tuned

Charts by StockCharts

Note:  Posts on this site are for education purposes only.  They provide one firm’s insight on the markets.  Not investment advice.  See additional disclaimer here.

The Danger Point®, trade mark: No. 6,505,279
Gold Miners … Test & Reverse

Any Buying Support Left ?

Not if you look at the volume profile.

Steven Van Metre, in his Sunday Night Charts (time stamp 12:20), shows the precarious situation of GDX.

There’re about 90-minutes left to go in this session.

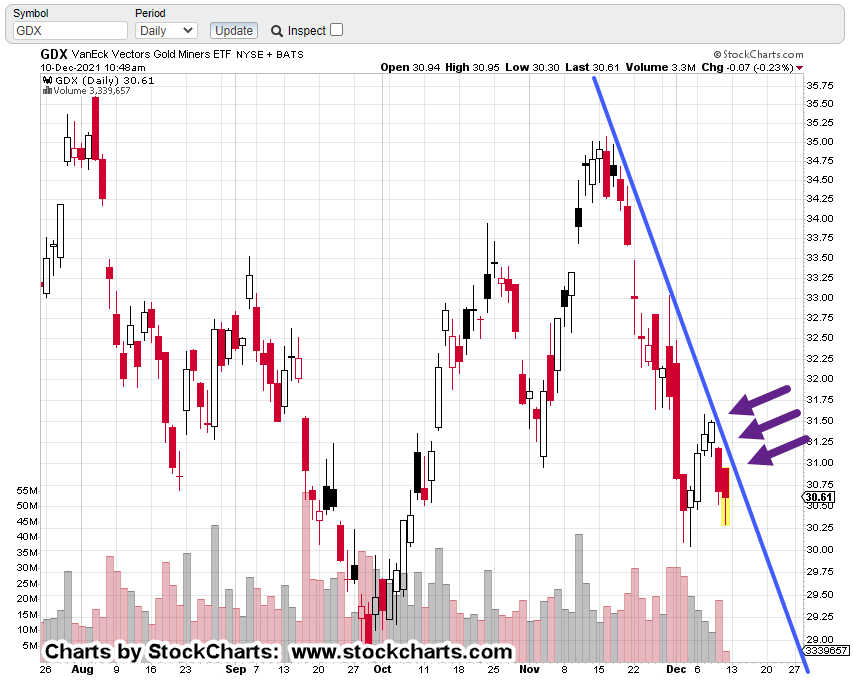
It looks like GDX is/has tested underside resistance and down-trend simultaneously. For GDX to break higher, it would have to get through that resistance.

As always, anything can happen but we need to remind ourselves, the gold bulls are already trapped … having bought at the mid-November breakout.

If still holding, they’re now deep in the red.

Under such conditions, each down move serves to set the (bear) hook even more.

If we use this just released article from ZeroHedge, we’re nowhere near any kind of capitulation and upside reversal.

Senior Miners, GDX

The un-marked daily chart

And now …

With zoom

We’re at a confluence of resistance; the downtrend and the underside of price action.

Let’s keep in mind, the overall markets (S&P, Dow, Nasdaq) are still oscillating around their all-time highs. Volatility has increased as the trend appears to be changing.

Gold and the miners are nowhere near all-time highs.

A century ago, Wyckoff showed how to spot markets that would decline the fastest and farthest under bear market conditions (not advice, not a recommendation).

It’s not the high-flyer we’re looking for … no, it’s the laggard.

That’s the one to pick.

It’s already weak and once the buoyancy of the general market evaporates, the bottom may fall out.

Stay Tuned

Charts by StockCharts

Note:  Posts on this site are for education purposes only.  They provide one firm’s insight on the markets.  Not investment advice.  See additional disclaimer here.

The Danger Point®, trade mark: No. 6,505,279