Note: Posts on this site are for education purposes only. They provide one firm’s insight on the markets. Not investment advice. See additional disclaimer here.
Note: Posts on this site are for education purposes only. They provide one firm’s insight on the markets. Not investment advice. See additional disclaimer here.
Warren Buffett has a massive cash hoard; now, famous short-seller Michael Burry is calling it quits, links here, here and here.
The last time this type of news happened in a big way, was right around the Nasdaq peak in 2000 (not advice not a recommendation).
Back then, ‘old-timers’ with forty-years in the business, were throwing up their hands, throwing in the towel and retiring; the market ‘did not make sense anymore’.
NVDA, CVNA & Biotech
With Nvidia posting a new low today, the analysis shown here, is proving to be accurate thus far (not advice, not a recommendation)
Additionally, Carvana posted an up-thrust (reversal) as presented in this post (not advice, not a recommendation).
Next up, is biotech, XBI.
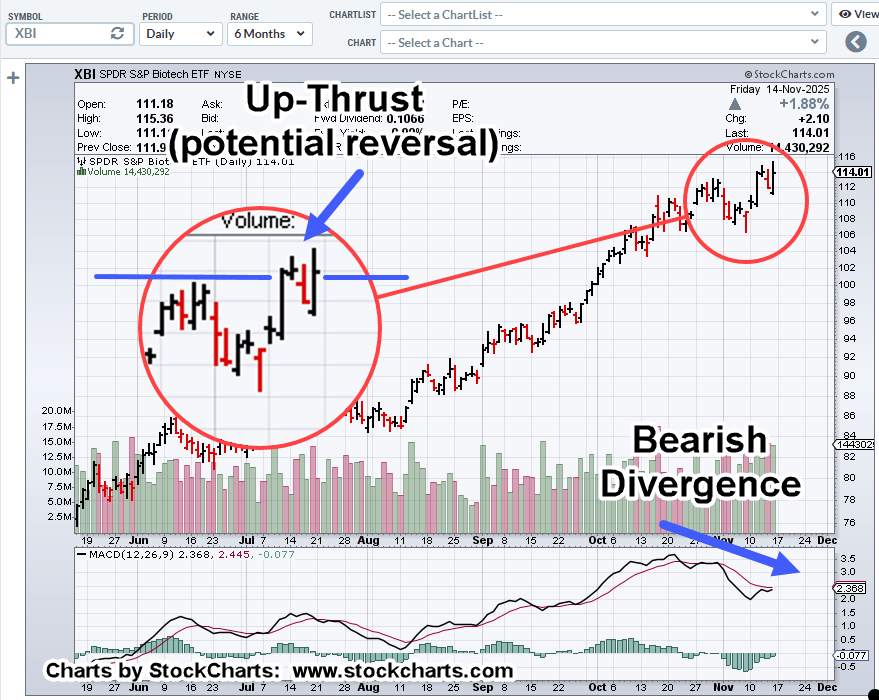
Biotech XBI, Hourly
We’re in up-thrust condition (potential reversal) have a ‘sign of supply’ and now testing the upside.
Note: The ‘test’ has exceeded the previous high. Although rare, it can happen.
So, is it a test or a continuation of an upside breakout?
The rest of the markets seem to be in a similar condition.
Carvana just posted a new daily high (as of 11:25 a.m., EST), possibly taking out the (early) shorts.
Let’s see if it manages to close above that 332.33, level discussed in this post (not advice, to a recommendation).
Note: Posts on this site are for education purposes only. They provide one firm’s insight on the markets. Not investment advice. See additional disclaimer here.
Note: Posts on this site are for education purposes only. They provide one firm’s insight on the markets. Not investment advice. See additional disclaimer here.
Note: Posts on this site are for education purposes only. They provide one firm’s insight on the markets. Not investment advice. See additional disclaimer here.
Note: Posts on this site are for education purposes only. They provide one firm’s insight on the markets. Not investment advice. See additional disclaimer here.
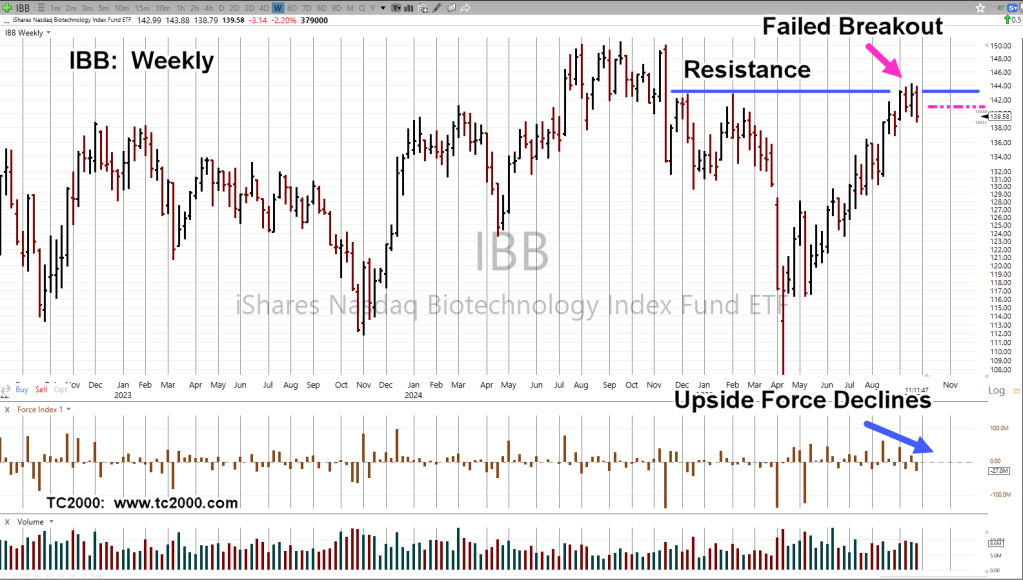
Both biotech funds, IBB, and XBI, are now in an up-thrust (potential reversal) condition.
In each case, the ETFs have pushed through a long-established trading range, straight into resistance.
The last update focused on less liquid IBB, because it was not known if heavily traded XBI, would push through its trading range (being the weaker of the two).
Since that initial update, both indices are now above their trading range.
Of course, what happens next is the question.
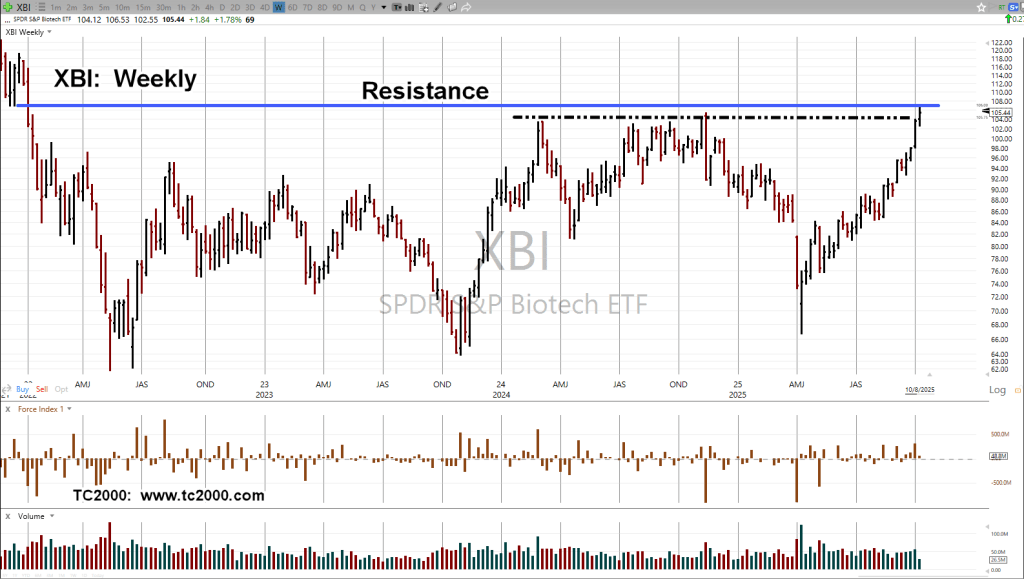
Biotech XBI, Weekly
The blue line is long established resistance.
The black dashed line is the top of the trading range and the up-thrust condition.
At this point anything can happen.
XBI, could reverse immediately or grind its way along, dissipate momentum, or even move higher.
We’re at the point where the risk of being wrong on a short position is least (not advice, not a recommendation).
Note: Posts on this site are for education purposes only. They provide one firm’s insight on the markets. Not investment advice. See additional disclaimer here.
The last update, presented a case for the SOXX top, a proxy for A.I.
Note: If the SOXX, has made its final high, it’s still very early in the reversal:
Wyckoff said a century ago, ‘It’s as if the weight of a feather can move the market in either direction’.
That’s where we are now.
For biotech (IBB, XBI), different forces are at work.
Biotech IBB, Weekly
The 38.2%, retrace from 9/19 high, to 9/25 low, is in the vicinity of 140.90 (magenta dashed line).
Fridays are typically biased to the upside.
There’s a possibility IBB, may test (upward) throughout the session, heading to (at or near) 38%, by the end of the day (not advice, not a recommendation).
Note: Posts on this site are for education purposes only. They provide one firm’s insight on the markets. Not investment advice. See additional disclaimer here.
Note: Posts on this site are for education purposes only. They provide one firm’s insight on the markets. Not investment advice. See additional disclaimer here.
The graphic at left, is a segment of biotech tracking ETF, XBI.
Note how it exhibits a repeating pattern of spring-to-up-thrust (S & U).
Today is also Fibonacci ‘Day 5’, from the ‘S’ labeled low.
As seen with gold GLD, slightly higher, not correcting immediately, anything can happen.
However, with XBI, we’re in a multi-year downtrend that may be finishing its countertrend move, ready to up-thrust and reverse lower (not advice, not a recommendation).
Note: Posts on this site are for education purposes only. They provide one firm’s insight on the markets. Not investment advice. See additional disclaimer here.