There are sure to be plenty of post-mortems over the weekend; usual suspects giving us their assessment on what’s already happened. 🙂
Sometimes the question, is not ‘what’s happened’, but ‘what has not happened’.
That’s where the opportunity may lie.
Market Implosion
Over the past week, there were wide price bars, with action unstable in all major indices (ETFs): DIA, IBB, IWM, IYM, IYR, QQQ, SOXX, SPBIO, SPY, XLF, and XOP.
However, what did not implode (completely), are the car dealerships; specifically, CarMax and Carvana.
For this update, we’ll look at CarMax.
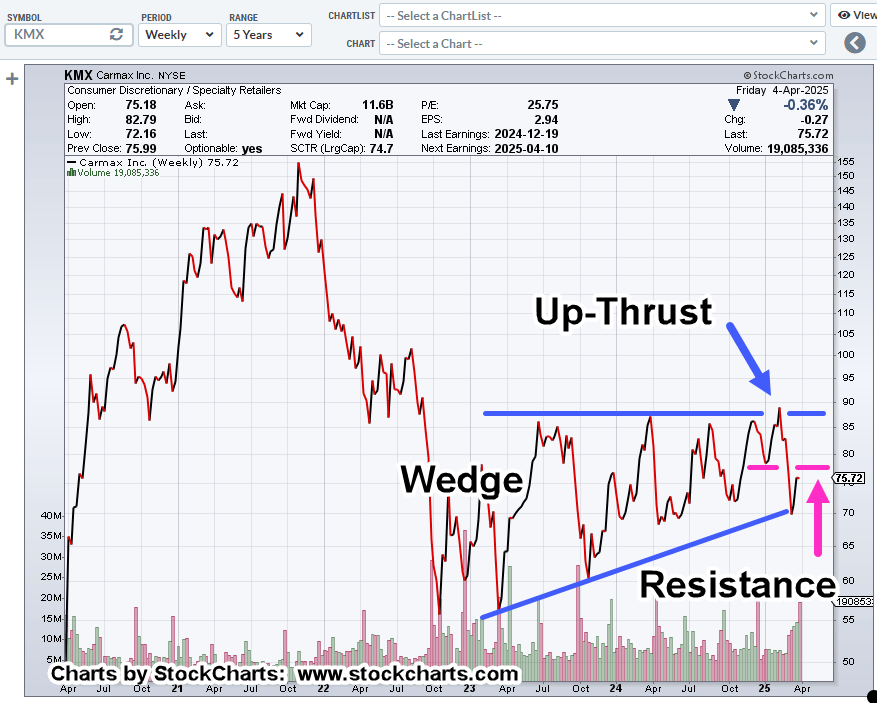
CarMax, KMX, Weekly Close
On a close basis, KMX, has bounced off the lower wedge boundary and is near the resistance area (magenta line).
Price action could be positively biased in the coming week as a result of ‘tax refund’ car buying (not advice, not a recommendation)
Note: Posts on this site are for education purposes only. They provide one firm’s insight on the markets. Not investment advice. See additional disclaimer here.
We’ve gone form “Not Happening” to this morning’s action; ‘maybe it’s happening?’
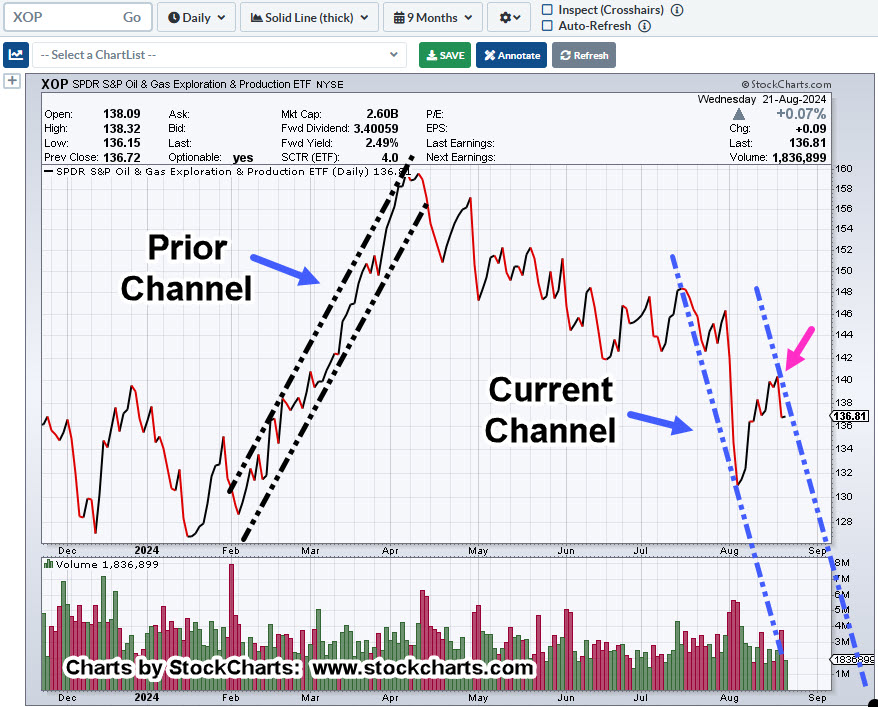
As was done with Oil & Gas exploration XOP, we’ll now take a look at the oil patch itself and proxy, USO.
Oil tracking Fund, USO, Close
“What do you see?”
Marking up the chart.
We either have the ‘tradable bounce‘, or a potential contact point for the right-side channel line (not advice, not a recommendation).
The Fed announcement is just out, essentially accommodating a rate cut in September.
There was talk of some ‘cooling’ in the market (Ya think?).
With that, demand for oil seems like it would take a hit putting it lightly (not advice, not a recommendation).
Positioning.
The market itself is telling us where to go and what to do.
The important item for the day; what is the market not doing? Specifically, the Semiconductors, SOXX.
The SOXX, has not made a new (daily) high (at least, not yet) after the Fed’s announcement; it can even be seen as the ‘proverbial gut-check’, a la David Weis.
With that, all other positions have been closed save the short in the semiconductors via inverse fund SOXS (not advice, not a recommendation).
Danger Ahead
The ‘rate cut’ has yet to happen and September is a long way away.
It can’t be re-iterated enough how dangerous is this environment; prices stretched via a narrative that’s false (not advice, not a recommendation).
Note: Posts on this site are for education purposes only. They provide one firm’s insight on the markets. Not investment advice. See additional disclaimer here.
Weren’t we supposed be forming some kind of ‘tradable bottom’ because the sellers were accumulating?
That kind of bottom-think may have worked under more ‘normal’ conditions.
However, it should be obvious to all (with some still clueless), we’re not in normal conditions.
Hedge funds dumping oil, giving a heads-up, demand collapse is either coming or is already here.
Great Depression 2.0
Presented many times on this site (click sidebar ‘Great Depression 2.0’, for a list of posts) that we’ve likely gone straight past ‘recession’, into depression (not advice, not a recommendation).
If that’s even remotely true, we should see demand collapse in heavy duty areas of the economy like trucking, right along with job implosions.
Note: Posts on this site are for education purposes only. They provide one firm’s insight on the markets. Not investment advice. See additional disclaimer here.
That’s hardly the hundred years or so, one would infer without digging deeper.
The Bond Model
Let’s not forget, bonds had a similar ‘maximum short‘ condition back in 2020.
Back then (like now), the ‘max-short’ was supposed to result in some kind of history making squeeze.
The result? It never happened.
Instead, bonds collapsed, rates launched higher and here we are today.
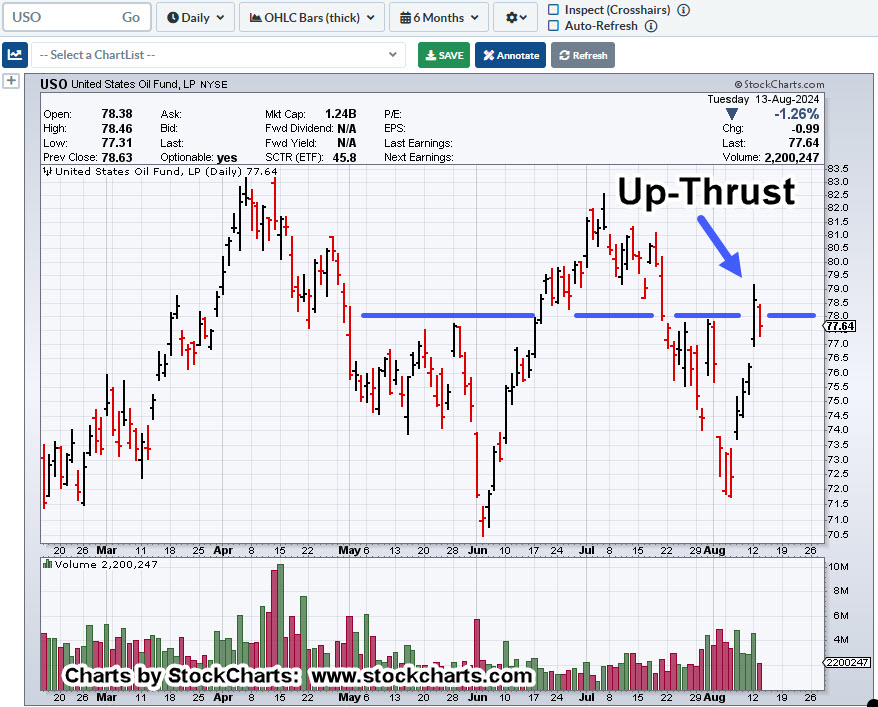
With that, let’s look at oil proxy, USO.
U.S. Oil Fund, USO, Daily
As of today’s action, it’s not looking too good for the bulls (not advice, not a recommendation).
It’s somewhat self-explanatory.
Price action is in Wyckoff ‘up-thrust’ position and with today’s reversal, appears to be confirming (not advice, not a recommendation).
As the earlier post stated, I’m already short the sector, DRIP-24-01, with a definitive stop defined as yesterday’s XOP high (not advice, not a recommendation).
If the ‘max short’ for oil really is the pre-cursor to an upward squeeze, we may be about to find out very soon.
Note: Posts on this site are for education purposes only. They provide one firm’s insight on the markets. Not investment advice. See additional disclaimer here.
Every day, the tape prints one more clue to the next probable direction.
The next probable direction.
Part of an experienced speculator’s pre-market prep is to know from the prior session, the ‘correct’ answer for the current session.
That is, if a set-up has materialized, then subsequent price action will have a specific or variation of a specific pattern.
If the pattern posts on the tape, we have the ‘right’ answer. If not, probabilities are saying ‘no’ at this point.
Of course, the hard part and according to Wyckoff, it laterally takes many years of observing and working with price action to know what to expect.
Real Estate, ‘Wrong’
This morning’s session in real estate, IYR did not post the ‘right’ answer from a short standpoint. A lower open and lower print was the expectation.
Therefore, DRV-24-02, was exited with just over a 2%, loss (not advice, not a recommendation).
However, oil and gas XOP, gave the ‘right’ answer.
Oil & Gas XOP, Daily
The circled price action is what we’re looking for (not advice, not a recommendation).
There’s a lot going on with this chart.
If XOP continues lower and short, DRIP-24-01, is not stopped out or exited, we’ll re-visit this action with further updates (not advice, not a recommendation).
Note: Posts on this site are for education purposes only. They provide one firm’s insight on the markets. Not investment advice. See additional disclaimer herexop
Monday was Fibonacci ‘Day 13’ from the January 4th, XOP, lows.
With about fifteen-minutes before the open, pre-market action in the XOP leveraged inverse fund DRIP, is trading slightly higher at 12.67.
So, was yesterday the day? Has XOP topped-out and now in the process of reversal?
As always with the markets, the price action itself, will show us the truth.
However, what can be stated with some confidence, is that we’re at a low-risk point for going short (not advice, not a recommendation).
‘Low-risk’, does NOT mean ‘no-risk’
XOP, New Low or New High
It’s somewhat straightforward at this point.
If XOP, posts a new daily low, it increases the probability of reversal. If it posts a new daily high, then price action is possibly on to new all-time highs.
Oil & Gas XOP, Daily Close
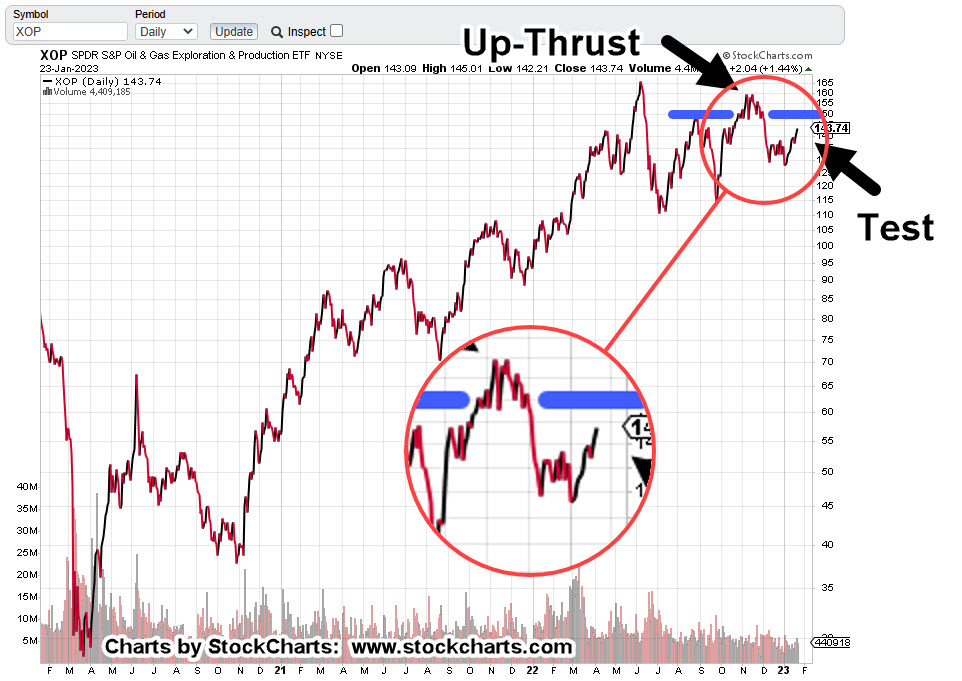
The daily chart shows the labored six weeks of rounded top that’s identified as ‘Up-Thrust’.
At present, XOP is testing the underside of that Up-Thrust.
The zoom version of the chart shows the amount of upside effort expended during the rounded top.
Price action spent over a month attempting to move higher, only to collapse into a downside reversal.
Now, we can see that wide price action area is being tested; not unlike the Newmont test as described here.
Note: Posts on this site are for education purposes only. They provide one firm’s insight on the markets. Not investment advice. See additional disclaimer here.
There was a larger than expected crude inventory build, as ‘the consumer is weaker than expected’.
The ‘consumer’ is not weaker than expected, they’re tapped out.
There’s real potential, events accelerate from here.
The reversal in the sector, XOP, was anticipated to happen on Friday, tomorrow.
At this point, it looks like it came early.
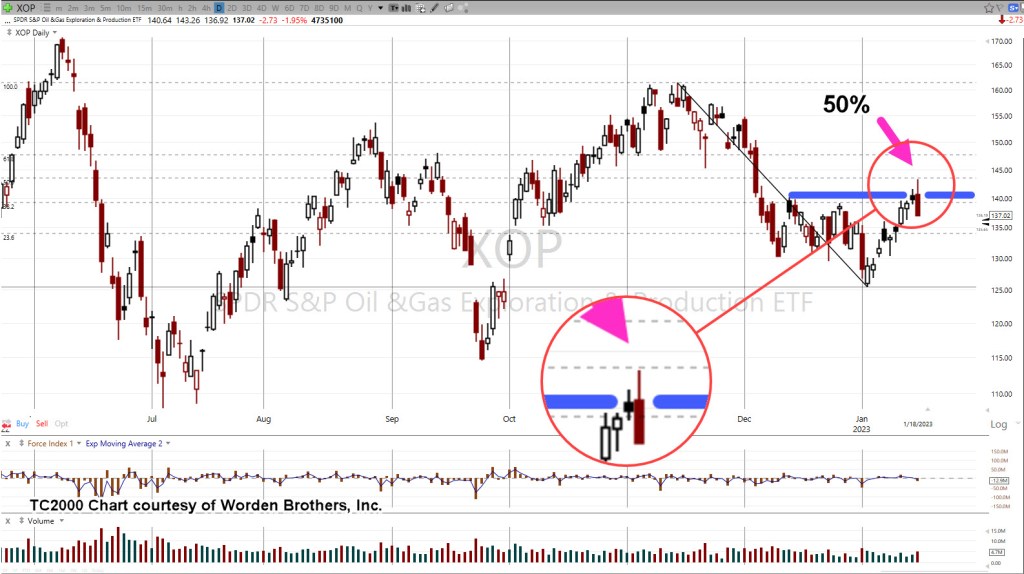
The daily chart of XOP, below shows a reversal at the Fibonacci 50%, retrace.
Oil & Gas XOP, Daily
The next chart zooms-in on the reversal.
We’re about fifteen-minutes before the regular session and set to open lower.
Look for the market to print lower, then attempt a rally as a test of the reversal.
That retrace, if it occurs, may be a low-risk area for a short via DRIP (not advice, not a recommendation).
If the anticipated test fails, and price action makes a new daily high (above yesterday’s print), it’s then likely the sector is on its way to all-time highs.
Note: Posts on this site are for education purposes only. They provide one firm’s insight on the markets. Not investment advice. See additional disclaimer here.
There was no Oil & Gas, XOP breakout, last Friday.
What did happen as shown on the chart below, was a test of resistance.
The market can certainly reverse from here. If so, it would be called a ‘double top’.
Those types of reversals are common; but from a trading perspective, that’s not what we are looking for (not advice, not a recommendation).
We’re looking for ‘trapped money’.
That means, as many market participants on the wrong side of the trade as possible so they are the ones that provide fuel for the downside.
Marsha … Marsha … Marsha
Just like The Brady Bunch and its chant of ‘Marsha’ … ‘Marsha’ … ‘Marsha’ … we have the public being led into a similar mantra; ‘Inflation’ … ‘Inflation’ … ‘Inflation’.
With that kind of single mindedness, who’s even looking for a downside reversal?
That does not mean a reversal is imminent … it just means the public is not looking for one; in itself, a requirement.
On to the charts
Oil & Gas XOP, Daily
We’ll re-post the original chart to show how price action has progressed.
This past Friday marked Fibonacci Day 8.
The next chart is how action looks now.
Included, is a forecast (not advice, not a recommendation) of where and how price action may proceed.
If it’s a double-top, we may have already reversed.
If not, Fibonacci Day 13, might be this coming Friday or next Monday.
It could be as early as Friday (actually, 12-days of price action) based on work done years ago.
That is, when an American Holiday occurs while the rest of the world’s markets remain open, that day of closed markets can (sometimes) effectively count as an actual trading day.
So, it’s this coming Friday, or Monday-next, that may be a set-up for reversal.
Note: Posts on this site are for education purposes only. They provide one firm’s insight on the markets. Not investment advice. See additional disclaimer here.
When Oil & Gas Sector XOP, pushed above last week’s high, it negated the breakdown scenario.
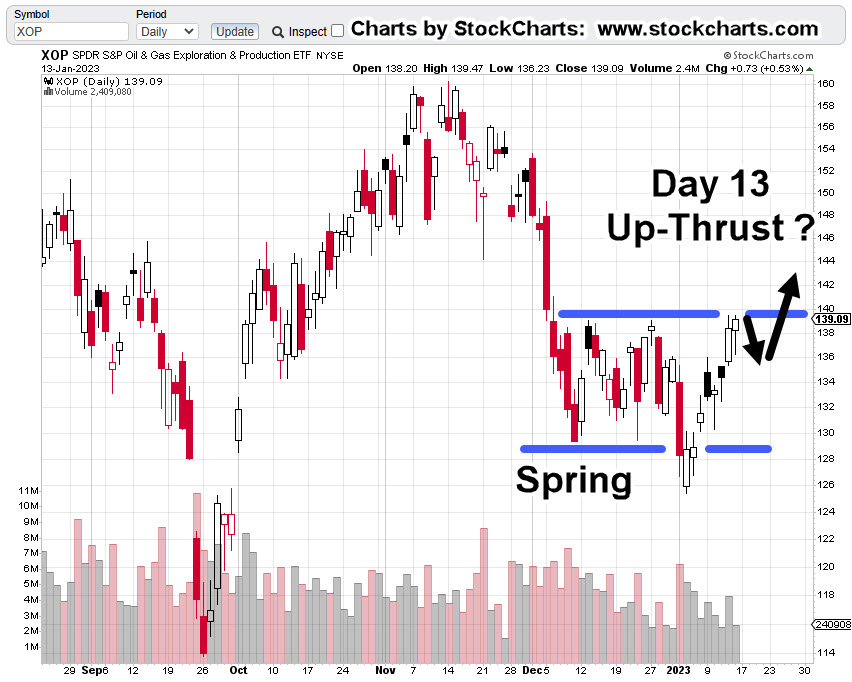
At the same time, it opened another potential opportunity that may set-up this coming Friday … The 13th.
We’ve shown over and again, markets tend to exhibit repeating patterns. Things like trading ranges, terminating wedges, breakouts and breakdowns, are not new.
However, there’s a lesser-known characteristic; the tendency for a market to go straight from a Wyckoff ‘spring’, into an ‘up-thrust’.
Currently, we’re about mid-way into the set-up as shown on the daily chart of XOP.
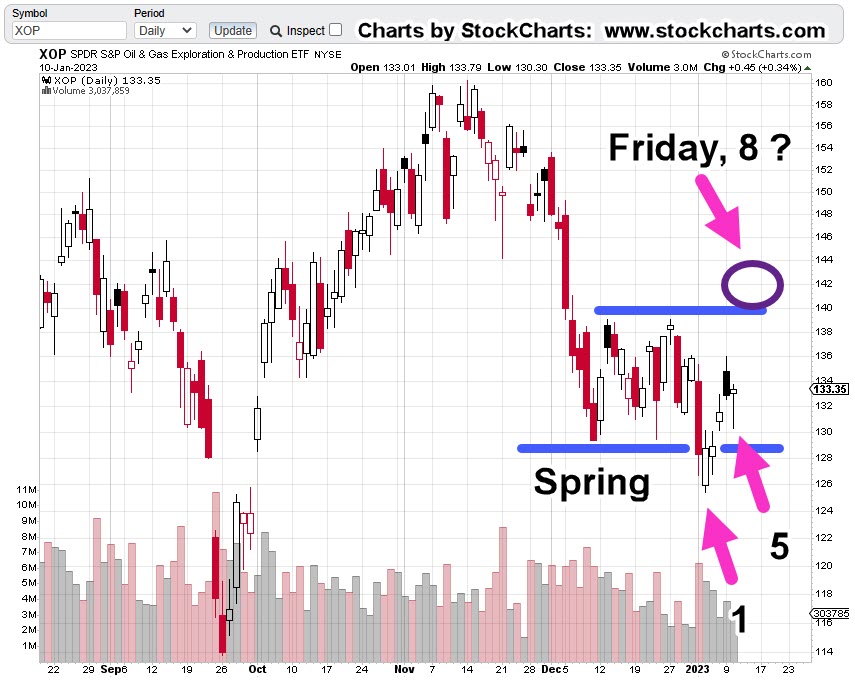
Oil & Gas XOP, Daily
Price action pushed below support (the spring set-up) and is now mid-way into that spring; potentially going straight into an up-thrust.
There was a reversal pivot on Fibonacci Day 5 (yesterday), which opens up the possibility of another time correlation at Fibonacci Day 8 … this coming Friday.
Before The Open
It’s about twenty-minutes before the regular open and XOP, is trading higher … further confirming we’re headed for a potential set-up and reversal (not advice, not a recommendation).
Note: Posts on this site are for education purposes only. They provide one firm’s insight on the markets. Not investment advice. See additional disclaimer here.
Since the lows last November, to the close this past Friday, gold (GLD) has moved higher by a decent but modest 15.4%.
Naturally, the opportunists are out telling us ‘We’ve been warned’, ‘this is it’, ‘it’s going to the moon’ … yet again.
With that backdrop, we’re going to look at the precious metals facts, not the hype.
‘Precious metals’ because there are only four that have ‘currency code’ classifications, i.e., are classified as an asset with ‘currency like’ monetary characteristics.
Way back over a century ago, Wyckoff discovered the key to understanding the next likely move of the markets was the study the market itself (not fundamentals).
Wyckoff essentially ‘locked himself in a room with just a stock ticker and phone line’.
That’s not saying ‘money printing’ has no effect. There are a lot of moving parts. Intentional destruction of the food supply is just one of those parts.
Old School Analysis
Hypothetically, if you dropped an ‘old-timer’ into the markets at this juncture (without him knowing the ‘hype’), and showed him all four charts of gold, silver, palladium, platinum, and asked ‘what’s happening?’
What’s his response?
After a brief look at the charts, he would likely say:
‘Gold’s move higher is not being confirmed by the other precious metals’.
Note that all four metals peaked together during the inflation spike of 1980.
Ergo: At this juncture, something’s wrong.
Either the other metals are going to ‘catch up’ to meet gold or gold is going to come down to meet the others.
That is of course, unless this time is different … somehow.
With that, we’ll look at the chart of gold to see what it’s saying about itself.
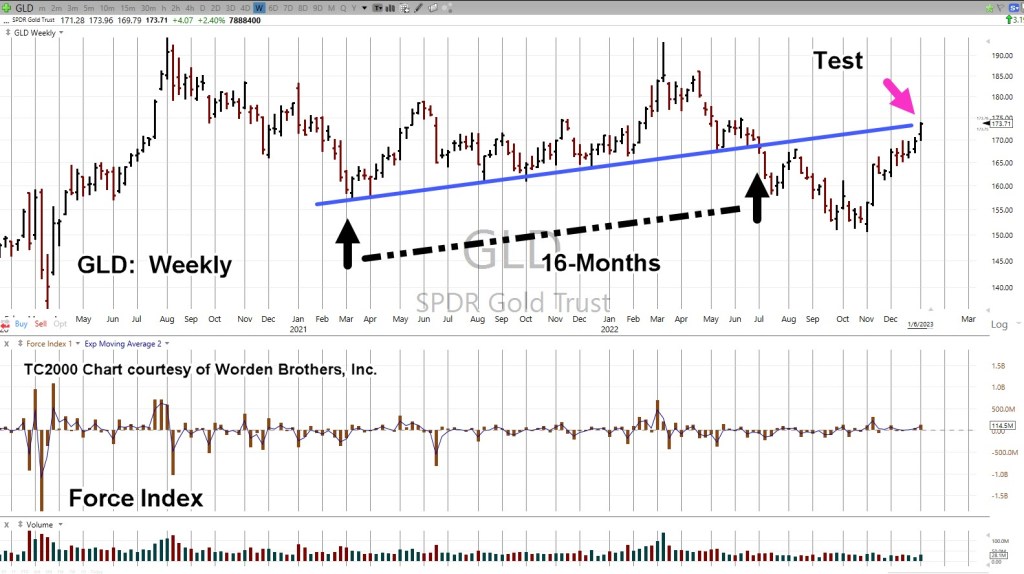
Gold GLD, Weekly
We’re starting with the unmarked chart.
Note: Elder’s Force Index scale is expanded to show the nuances of GLD, price action.
Next, we see we’re at a test of the trendline in place for 16-months before the downside breakout of July, last year.
Moving in closer, we have a wedge formation prior to the up-move last week.
Is this a breakout to the upside or a throw-over?
At this point, it’s unknown.
We can see that Force Index is below where price action entered the wedge during the week of November 11th.
Less force up into resistance (trendline), paints a slightly more bearish than bullish picture.
The ‘Why’ Comes Out
As if on cue and in classic Wyckoff style, we have a ‘why‘ for the move off the lows of last November.
Classic Wyckoff, because he said the ‘why’ of a move comes out after the fact.
There you have it; China buying gold last November and December.
During this move from the recent lows, it was certainly a trading opportunity for the bulls … but from a strategic standpoint, what happens next?
The Non-Confirmation
Non-confirmations can last a long time.
For example, the Oil & Gas sector XOP, declined for eight months, from April 2019 to January 2020, before the price of oil (USO) finally broke lower.
With the ZeroHedge article just released a few hours ago, we can expect at least a blip higher at the next GLD, open.
Note: Posts on this site are for education purposes only. They provide one firm’s insight on the markets. Not investment advice. See additional disclaimer here.