Oil Today … Gold Tomorrow

Commodities, Have Peaked

First, we’ll review oil; tomorrow, we’ll look at gold.

From an intuitive standpoint, you can almost feel it.

The oil and gas sector has launched to unsustainable highs.

Behemoths like Exxon (XOM) with its 63,000 employees have gone from below $30/share to above $110/share, an increase over 280%, in just two years.

In the history of the equity, going all the way back to 1984, that’s never happened.

Even in 1987, before the crash, XOM was up for the two-year period, a paltry 108%, by comparison.

Now, data is coming in nearly by the day about collapsing demand, layoffs accelerating, and inventories piling up.

The latest from Steven Van Metre, at time stamp 4:25, discusses just how fast the downdraft is, and will be.

Important Note:

Before we leave the Van Metre link above, at time stamp 8:50, the assertion is made of what the Fed will do when slower growth data comes in. i.e., interest rates will be halted or lowered.

Nassim Talib called this kind of thinking “Normalcy Bias”.

The opinion of this site is, it’s a trap. Thinking what happened last time, will happen this time.

Let’s mentally bookmark this post and come back six-months from now to see what happened.

We’re in uncharted territory and other agendas are at work.

Like ‘bread and circuses’, the ‘pivot’ discussion is a distraction … keeping the proletariat placated.

Demand Collapse

We’ve got demand collapsing on a daily basis right in front of our faces and yet, it’s a big mystery (to some).

What’s not known, is how the general population will react to undeniable truth when it finally hits, en masse.

We have a good hint of what’s in store as reported by Jerimiah Babe during the first minute of this report.

Moving on to the Oil & Gas Sector.

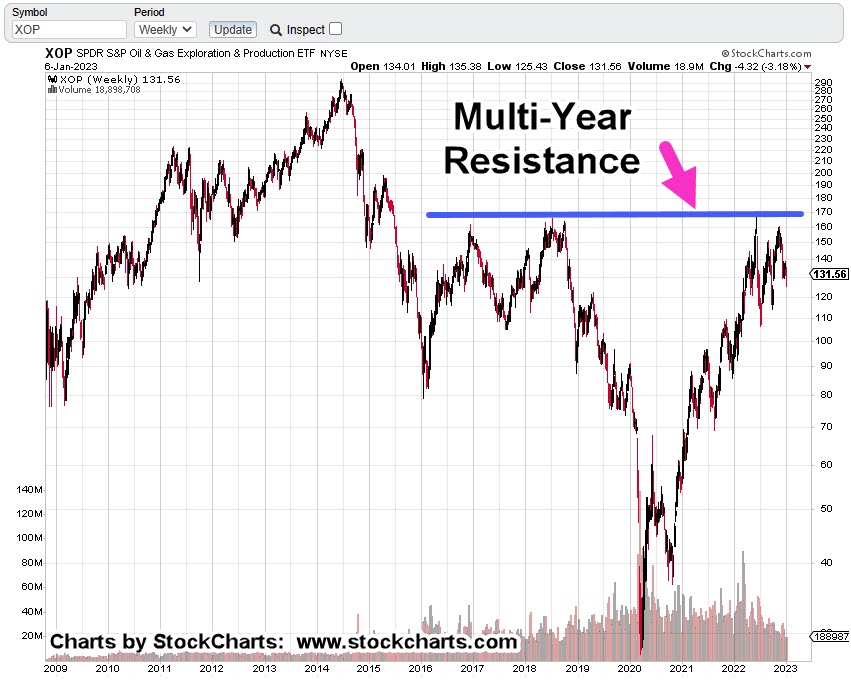
Oil & Gas XOP, Weekly

The weekly chart shows the multi-year resistance area that was tested (and rejected) back in mid-June, last year.
The next chart shows we also have a terminating wedge.

Price action has come back to the lower boundary; suggesting a breakdown is a probability.

If we get a breakdown, measured move support is identified at approximately -47%, below current levels.

Strategy & Trading

Obviously, the charts paint a bearish picture.

Over the past week, XOP was covered here and here.

The first link discussed how price action was very close to making a new daily high. That happened the next session (Friday) and indeed, it had Wyckoff ‘spring’ characteristics.

Price action moved higher and closed higher for the day, but it did not post a new weekly high … keeping the bearish case on the table.

A popular leveraged inverse fund is DRIP (not advice, not a recommendation).

At The Close

As this post comes to a close, a quick check on ZeroHedge turns up this: ‘Tipping Point‘

We’ve jumped over ‘recession’ and have gone straight into crisis and depression.

Stay Tuned

Charts by StockCharts

Note:  Posts on this site are for education purposes only.  They provide one firm’s insight on the markets.  Not investment advice.  See additional disclaimer here.

The Danger Point®, trade mark: No. 6,505,279

Another ‘Data Point’, Collapse

Baltic Dry Index

‘The longer the delay, the bigger the break.’

That was Jesse Livermore’s assessment of the market just before The Panic of 1907.

That Was, Then

Back then, it was money spent on The Boer War, tight financial conditions and extreme overvaluations.

Looks more and more, like today

It’s been this site’s opinion for about a year (now supported by data), that we’ve gone straight past recession, into economic collapse and depression.

And Now, This

Another data point confirming the ‘depression’ scenario is this, just out from ZeroHedge: The Baltic Dry Index had its largest one-day collapse on record.

As if to drive it home; demand is in free-fall as Amazon, just announced plans to fire 18,000 workers.

From a strategic standpoint, collapsing shipping demand means collapsing fuel demand.

Which brings us to the sector of the day, Oil & Gas

Oil & Gas Sector XOP, Weekly

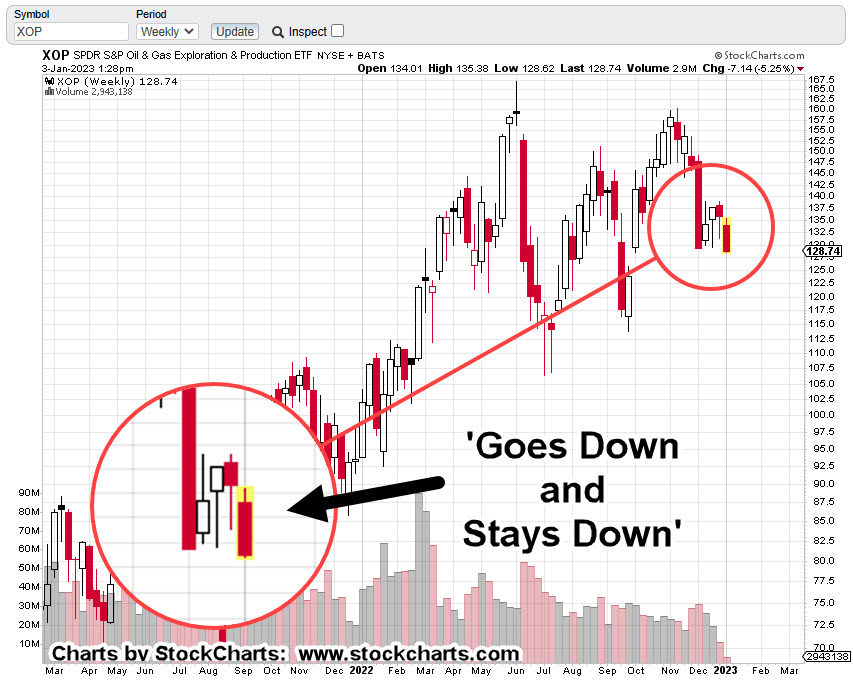
The last update, showed the weekly chart has reversed down and stayed down.

XOP is penetrating support, now at The Danger Point®.

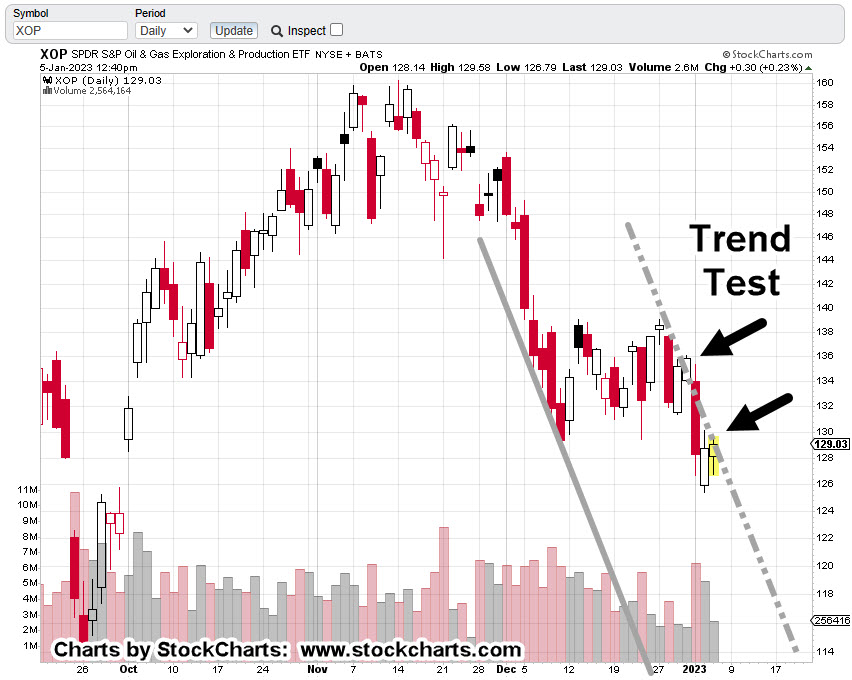
The daily chart has more detail; we’re hovering at support, testing the right side trendline (again).

Providing some (minor) upward bias for the day is this report on WTI (West Texas Intermediate).

Oil & Gas Sector XOP, Daily

It’s 1:31 p.m., EST and XOP, has not posted a new daily high (it’s very close).

Doing so, would weaken the downtrend case and point probabilities to a Wyckoff spring move higher.

Summary

Demand is rapidly collapsing on many fronts and the WTI report linked above uses the word ‘tepid’.

That may be completely inaccurate or misleading when considering the demand for shipping has seen its worst down-day, on record.

Stay Tuned

Charts by StockCharts

Note:  Posts on this site are for education purposes only.  They provide one firm’s insight on the markets.  Not investment advice.  See additional disclaimer here.

The Danger Point®, trade mark: No. 6,505,279

The 15-minute, ‘January Effect’

That’s All There Was

If we use the S&P as the proxy, it hardly even lasted that long.

Going back to just four days ago, we had this (emphasis added):

“It’s well known, stocks tend to rise in the first weeks of January. Tax loss selling is over and there’s typically some type of ‘relief’.

Don’t count on it this time (not advice, not a recommendation).”

Market Meets Expectations

It was expected on the first trading day of the year, the market would continue its downtrend.

After this morning’s 15-minute blip, that’s exactly what’s happening.

We’ve already discussed real estate IYR, (here, here and here) as well as the Q’s (here).

Now, there appears to be another sign of impending price collapse … the oil sector; specifically, Oil & Gas Index XOP.

As is typical, we’ll begin the analysis with the longer time frame, the weekly.

Oil & Gas Sector XOP, Weekly

There’s no secret to the chart below other than Livermore’s admonition for going short; that is, he finds a market that ‘goes down and stays down’ (not advice, not a recommendation).

The prior two down-drafts were quickly retraced; one in mid-July last year and one in September.

Not so, this time.

If we go to the daily, we have an ominous look where a downtrend could be validated.

Oil & Gas Sector XOP, Daily

The right-side trend is drawn as a dashed line, revealing the attempted breakout on the last two sessions in December.

Attempted trend line and channel breakouts are normal market behavior.

It’s clear in the case above, price action has quickly got itself back into the trading channel.

Summary

Of course, oil prices are not supposed to go down, right?

At this juncture, look at all the conflict and potential supply disruptions that are possible.

However, the price of oil and the price of the exploration/production equities are two separate things.

The price of oil could skyrocket further, and yet, the equites still collapse. Bear markets are all about price, wealth, and credit destruction.

Typical short positioning trade vehicles for this sector are DRIP (-2X) and DUG (-2X), or to short the XOP directly (not advice, not a recommendation).

Stay Tuned

Charts by StockCharts

Note:  Posts on this site are for education purposes only.  They provide one firm’s insight on the markets.  Not investment advice.  See additional disclaimer here.

The Danger Point®, trade mark: No. 6,505,279
Exxon: Higher, Still ?

Major Resistance At XOM: 69 – 70

XOM’s the largest cap in the sector. We’ll use it as the proxy.

Last update has us exiting a short via DUG (not advice, not a recommendation) and standing aside for now.

It’s no secret the overall markets are insane … possibly in some kind of massive blow-off, FOMO top.

At the same time, they look like they’re ‘thinning-out’; that is, only a few are participating in the upward launch.

It’s a bearish warning

Thinning-out, tends to happen at the end or near the end of bull markets.

Looking For The Short

The big money’s made on the downside with down moves being two or three times faster.

The Daily closing chart of XOM above shows it’ still grinding itself higher.

Trend lines below say the upside may be reaching a limit:

If we zoom-in, it looks like there’s significant resistance at the 69 – 70 area for XOM … if it gets that far.

Looking For The News

With the current instabilities, world events, food supply, energy supply, earthquakes, volcanoes, we could get some kind of upset to launch the oil sector higher.

It may not happen.

If it does, that could be the time to re-enter short (not advice, not a recommendation).

Stay Tuned

Charts by StockCharts

Note:  Posts on this site are for education purposes only.  They provide one firm’s insight on the markets.  Not investment advice.  See additional disclaimer here.

The Danger Point®, trade mark: No. 6,505,279

Oil: Froth At The Top

XOP Down, XOM Up

Oil sector proxy XOP, posted outside-down (key reversal) while Exxon (XOM) closed higher.

If we’re in the middle of a reversal, this is normal.

Parts of the sector are already heading lower while typically, the larger caps are the last to complete the change.

This interview with Carter Worth, even though it’s short at only two-minutes thirty seconds, paints not-so-good picture.

He says in a typical scenario that’s repeated twice since the late April ’20 lows, oil has declined by 16% – 20%.

When asked how the equities would do, he hesitates, then says ‘It’s not worth the risk [to be long]’.

It’s a polite way to say they’re likely to get whacked.

Moderna (MRNA)

By now, everybody’s heard the news on Moderna.

Trouble for Moderna was spotted a while back and discussed in this post … along with a prediction that class-action may be forthcoming.

Our stopwatch is still ticking.

Positions

The account positions are short Oil & Gas XOP, using DUG as the vehicle (not advice, not a recommendation).

So far, its been a lot of banging around without much progress either way. However, at this point, a new low for DUG, below today’s low would signal trouble for the short side.

Stay Tuned

Note:  Posts on this site are for education purposes only.  They provide one firm’s insight on the markets.  Not investment advice.  See additional disclaimer here.

The Danger Point®, trade mark: No. 6,505,279
Exxon Breaks Trendline

Sector Reversal Case Builds

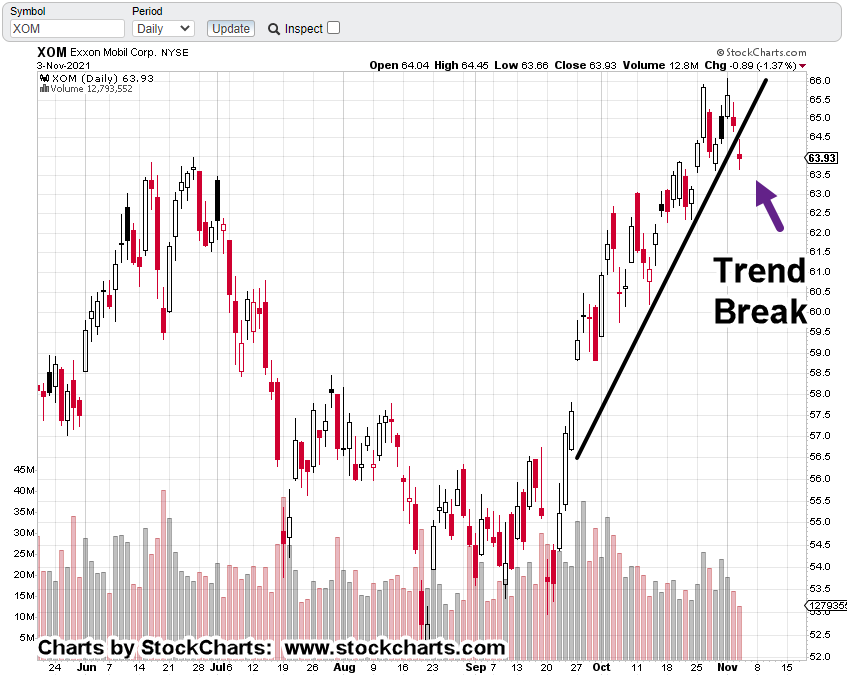
While the overall markets move higher, XOP continues lower and Exxon (XOM) just broke its trend-line to the downside.

XOM is the largest cap in the Oil & Gas Exploration Sector.

We’re using XOP as the proxy and DUG for leveraged inverse.

Over the next day or so, we could get an underside test of the break. However, it was not really dramatic.

With all eyes on other markets like S&P, Dow, Q’s and so on, XOM may just decide to drift on lower …

Positioning:

At this point, there’s nothing that says to cover shorts by exiting DUG (not advice, not a recommendation).

The trade is progressing. So, we’re going to leave it alone.

Stay Tuned

Charts by StockCharts

Note:  Posts on this site are for education purposes only.  They provide one firm’s insight on the markets.  Not investment advice.  See additional disclaimer here.

The Danger Point®, trade mark: No. 6,505,279

‘Stealth’ Reversal, Oil

XOP Lower Open, Signals Weakness

Nobody’s Looking

A higher XOP open would have probably been a short set-up (DUG) failure.

However, that’s not what happened.

The open was lower but then price action went on to post a new daily high above yesterday’s.

At this juncture, the short set-up is still valid (not advice, not a recommendation).

How can a new daily high be acceptable for a short position?

Repeating Set-Up:

Back in August this post was created to help document a market behavior that’s probably been repeating since the beginning.

My former mentor, David Weis used to call it ‘Spring to Up-thrust’, using Wyckoff’s terminology.

The fact the set-up’s been repeating for decades, if not a century or more, is definitive proof traditional valuations and fundamentals have nothing to do with actual price movement.

That’s a topic for another time.

XOP Analysis:

We’ll start with an un-marked XOP daily chart:

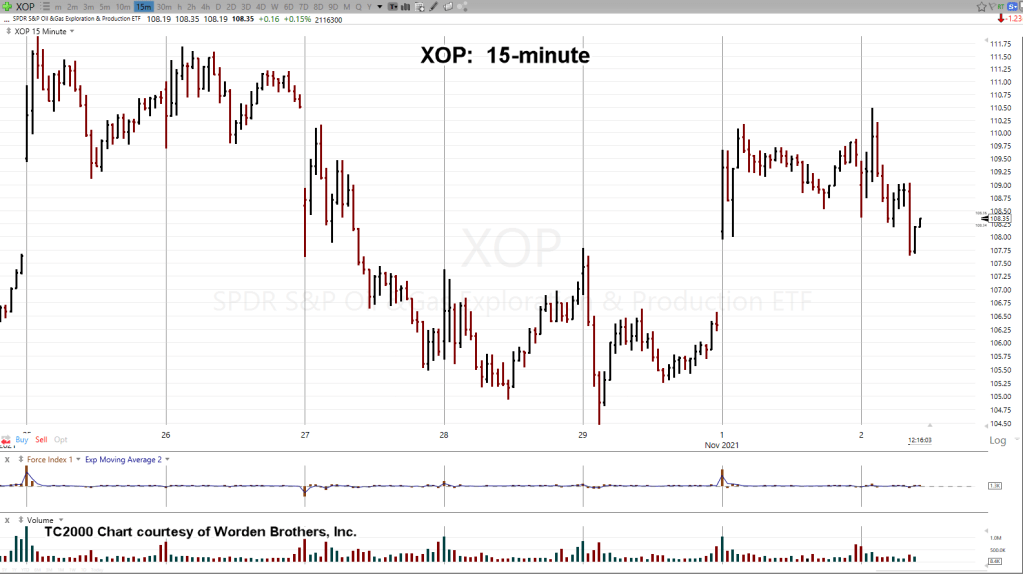
It doesn’t look like much is going on. So, let’s zoom into the far right side using the 15-minute, below:

Ok, what am I supposed to see?

Marking up the chart, we have the following:

Once we have the correct annotations, it’s obvious XOP just posted a ‘Spring to Up-thrust’.

True, it’s on a minor time frame like the 15-minute; however, it does give a clue XOP, could be in for a more significant and longer-term reversal (not advice, not a recommendation).

Positioning:

If XOP is somehow able to post another new daily high during this session or subsequent, most likely it would be time to exit our short position (via DUG, not advice, not a recommendation).

For now, the expectation’s for continued oscillation below today’s high … while XOP figures out if that’s all there is for the up-side.

Stay Tuned

Note:  Posts on this site are for education purposes only.  They provide one firm’s insight on the markets.  Not investment advice.  See additional disclaimer here.

The Danger Point®, trade mark: No. 6,505,279

Oil Sector Tests Reversal

Deep Test For XOP

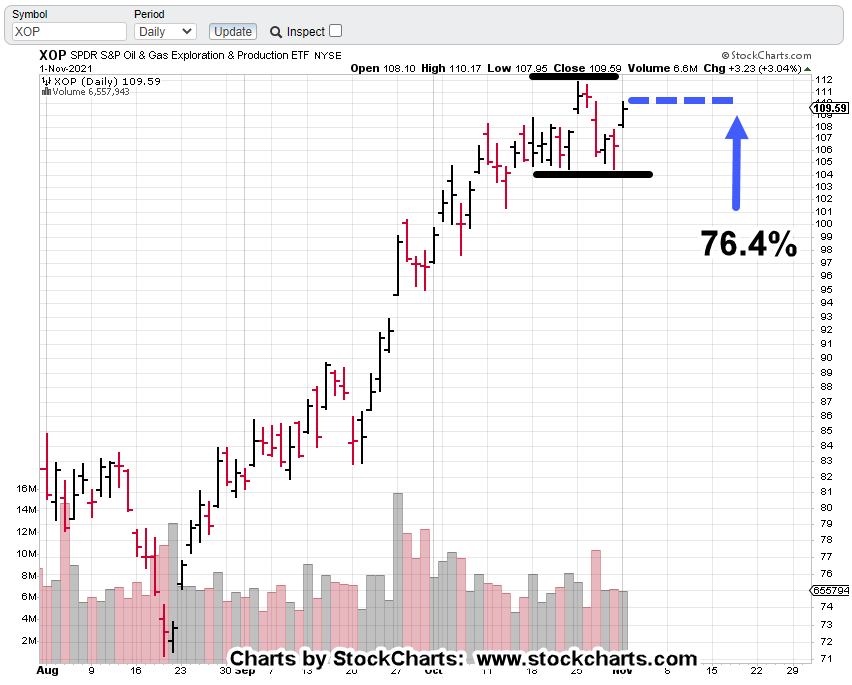
XOP is either in a deep test at the Fibonacci 76.4%, retrace level (distance between black lines), or it’s getting ready to post new recovery highs.

Volume was moderate with no overt indication either way.

A higher open at the next session would most likely indicate trouble for a short position (not advice, not a recommendation).

However, one has to realize we’re at extremes in price and most likely sentiment as well.

Looking at the weekly gives a better perspective:

Positioning:

We’re keeping the finger close to the sell button (for inverse DUG) but are not convinced the short set-up has been invalidated (not advice, not a recommendation).

Price action’s at a confluence of trend lines and resistance. Some type of trend confusion is to be expected.

Stay Tuned

Charts by StockCharts

Note:  Posts on this site are for education purposes only.  They provide one firm’s insight on the markets.  Not investment advice.  See additional disclaimer here.

The Danger Point®, trade mark: No. 6,505,279

Peak Oil ?

Will Demand Collapse Faster Than Supply Contracts ?

Is There A Biotech Connection ?

The Next Chess Move

Everyone’s good at telling you what the problem is; it’s a financial collapse !!!

No, Duh!

The hard part is, how to position for the unknown at least for those of us in the serfdom.

The so-called elites, the oligarchs know (or think they know) exactly what’s happening.

They move their chess players and we move ours. The goal is to position for (potential) profit with the caveat we all make it out on the other side.

Personal Anecdote (skip to XOP Analysis if not interested):

I have a close family member that’s been a school teacher for about twenty years. He/She is well known in the local town and has a significant number of connections.

Because the children being taught are typically small, ranging from kindergarten to fourth grade, those kids tend to reveal all that’s happening at home.

Their revelations include financial status (or lack of), political leanings as well as abuse that’s happening physically and sexually. It’s the real deal.

As an aside, any potential crimes are fully documented and reported.

The point here is, this contact has revealed that children, family members and extended family members are severely ill or dropping dead after receiving an ‘injection’.

However, the surviving family members are just too stupid (or afraid) to put it together; the injections are causing the deaths.

It’s some kind of mental block and/or mass hypnosis.

It’s wrenching and heartbreaking.

However, at the same time and this is where it gets harsh, for those of us in the faith, we know Biblical scripture tells us the Lord delights in hiding the truth.

One has to diligently seek out truth. It takes work and a prayerful form of neural plasticity; the ability to be mentally flexible.

Truth is not for the lazy, the incompetent, the coward.

Why should immutable truth come to a coward or idiot that does not diligently seek it?

New ‘Variant’:

The rapidly increasing deaths may be passed off by the mainstream media as some kind of new ‘variant’.

That ‘variant’ brings us to the market at hand; oil and oil exploration XOP and possible biotech connection.

XOP Analysis:

As with biotech SPBIO, and its leveraged inverse fund LABD, so too we have Oil & Gas Exploration XOP, and leveraged inverse fund DUG.

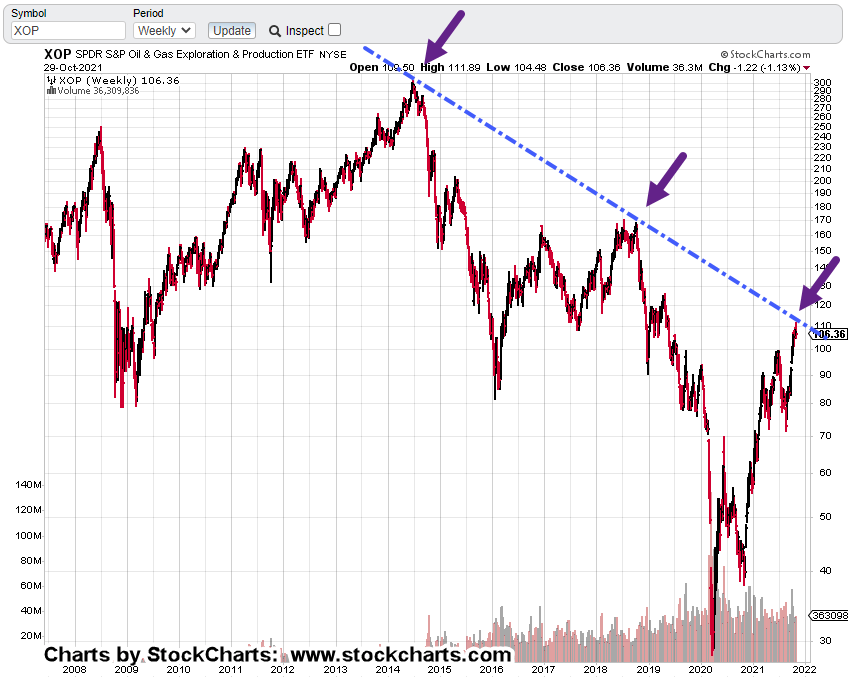
The long term un-marked, weekly chart of XOP:

Next, we have price action contacting a multi-year trendline:

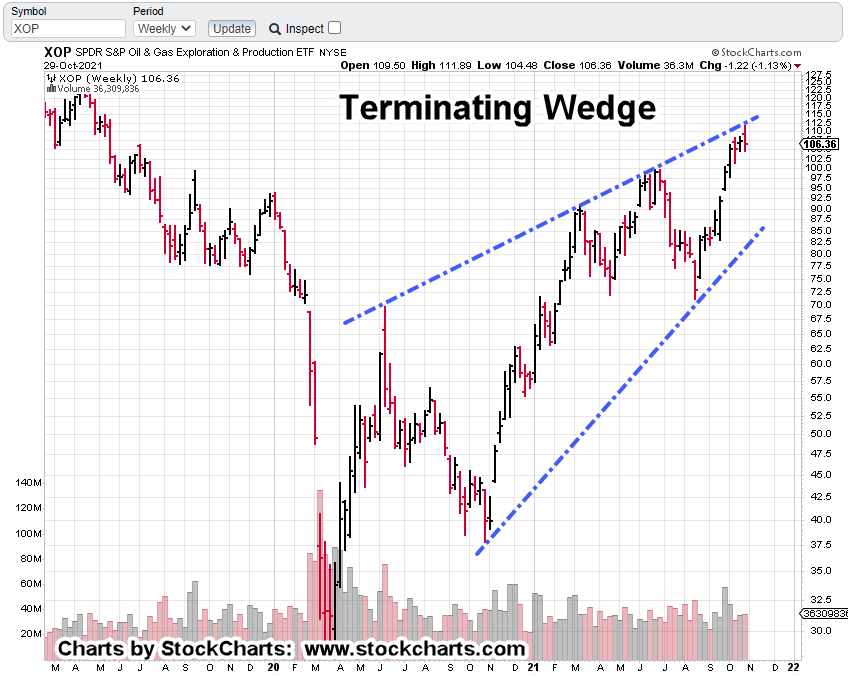
Moving closer on the weekly, we have a terminating wedge:

Terminating wedge(s) typically result in price action moving opposite of wedge formation.

In the case above, that would be a reversal to the downside.

This past week’s bar was a reversal. It’s a potential signal the formation is complete and XOP is ready for the downside.

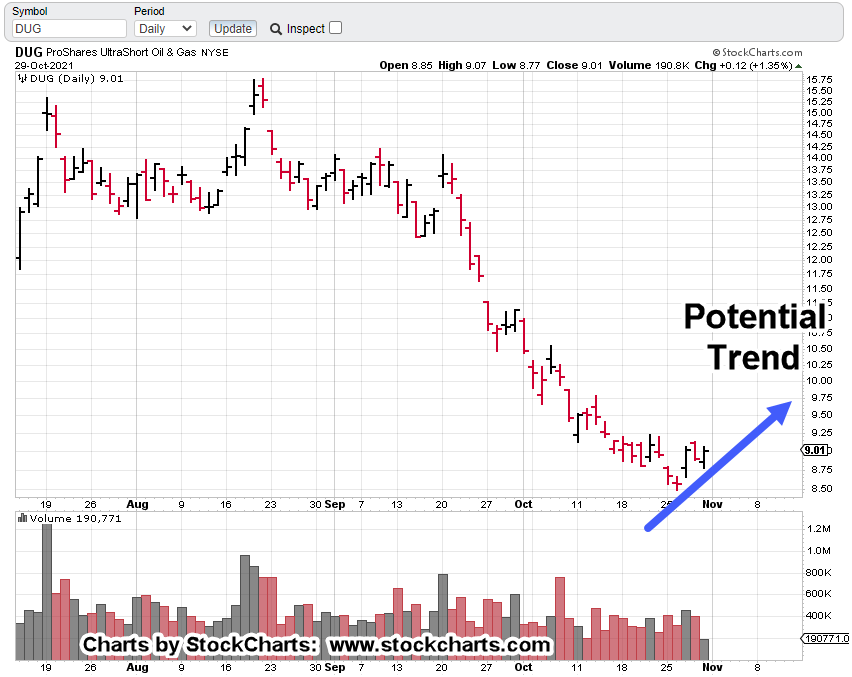
Of course, if XOP is about to head lower, inverse DUG is about to head higher (not advice, not a recommendation).

Daily chart of DUG.

The Biotech (SPBIO) Connection:

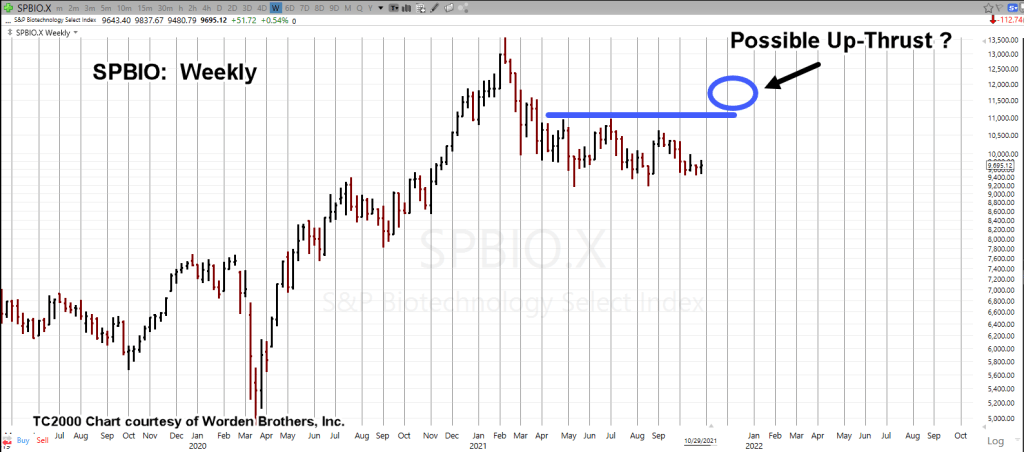
The weekly chart of SPBIO, shows momentum on downward thrusts has slowed. The black dashed arrow’s trajectory is becoming more shallow:

If biotech is going to retrace, the solid blue line is a Fibonacci 38%, as well as potential location for an up-thrust (downside reversal).

A new variant (which is likely injection injury) may be used by the media to drive biotech higher to the retrace level.

We’ll have to wait and see if there’s a reduction of the population as we head into the end of the year. It’s a known fact, the injection destroys the immune system … so far, permanently.

That would be a factor in the up-coming flu season.

Remember that?

We used to have a regular flu season … but that all disappeared (re-branded, actually) with our current situation.

Summary:

Nearly all recessions have started with rising oil prices.

However, we’re not in a recession but an all out collapse. The economy is contracting at the fastest rate in U.S. history.

Our current position is demand will collapse faster than supply restriction (not advice, not a recommendation).

Or, we could still have rising oil prices but it won’t be enough to offset the cost of drilling and production; lack of demand may be overwhelming.

Stay Tuned

Charts by StockCharts

Note:  Posts on this site are for education purposes only.  They provide one firm’s insight on the markets.  Not investment advice.  See additional disclaimer here.

The Danger Point®, trade mark: No. 6,505,279

Courtesy Post: Position Change

Analysis To Follow

For whatever reason, the biotech (LABD) short is not performing as expected.

However, the oil market looks like it may have topped out.

Positioning:

Exit LABD and re-position short oil sector via inverse fund DUG (absolutely not advice, not a recommendation) 🙂

Stay Tuned

Charts by StockCharts

Note:  Posts on this site are for education purposes only.  They provide one firm’s insight on the markets.  Not investment advice.  See additional disclaimer here.

The Danger Point®, trade mark: No. 6,505,279