Inflation Reaches Peak Narrative

11:32 a.m., EST:

Just like ‘peak oil’ back in the summer of 2008, now it looks like we’ve reached ‘peak narrative’ for inflation.

‘Narrative’, because the markets are a game of manipulation.

If you don’t know who’s being manipulated, then that person is you (slightly changing a Buffett quote).

Bolstering the assessment, is this report from ZeroHedge.

Looks like everybody’s on board and reporting higher prices. Just like they were on board last year with: “We’re all in this together”.

The exact same tag-line for every major U.S. corporation … with ready made (like they knew ahead of time) banners to boot.

The problem is, the markets are not following along.

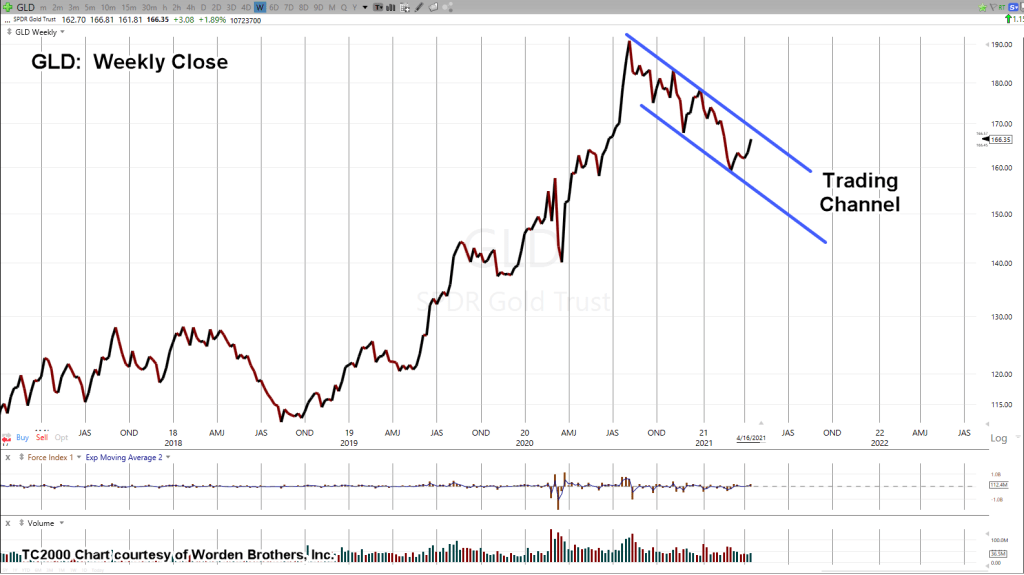
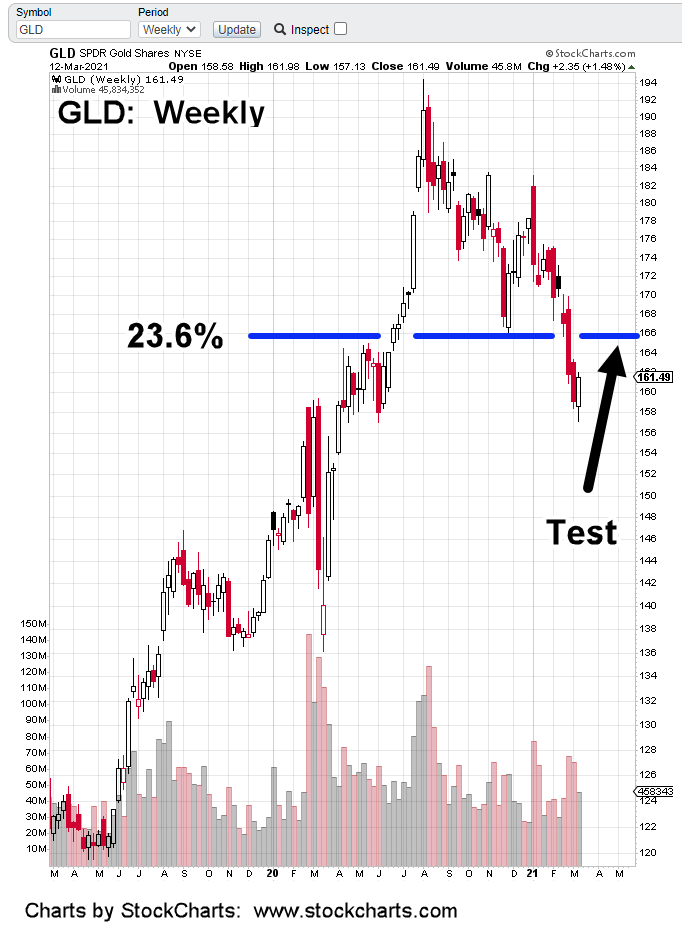
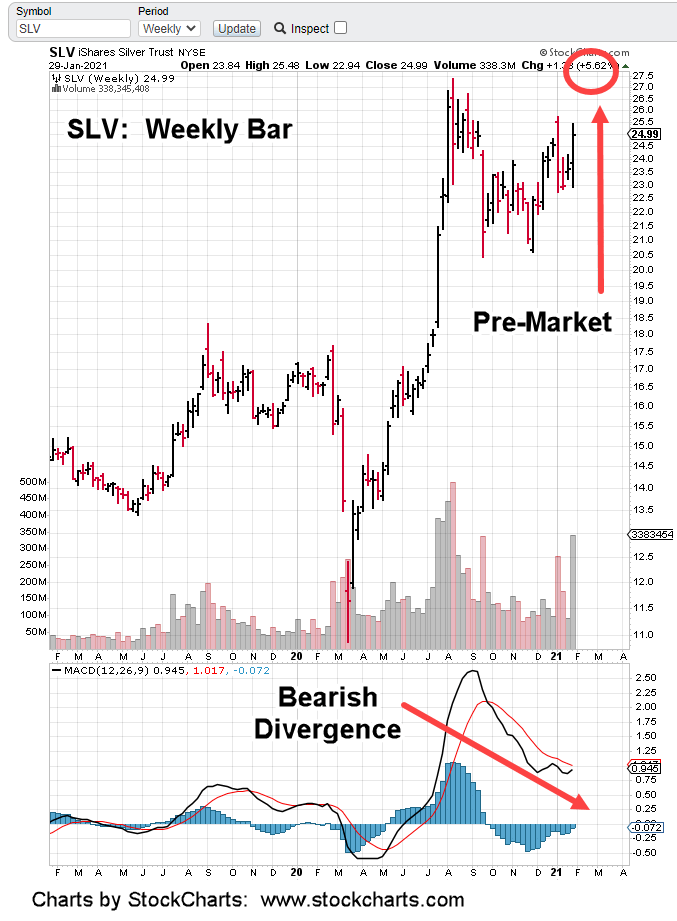
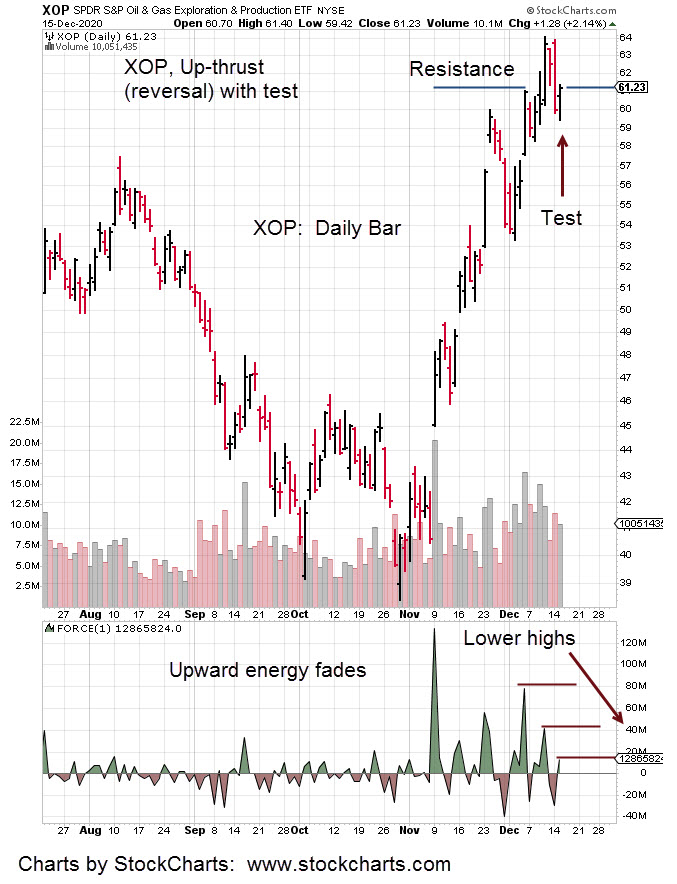
Reported two days ago, senior gold miners are testing their reversal.

Yesterday, was an upward push that wound up being an ‘out-side-down’ bar (GLD, GDXJ, SLV) … a reversal in itself.

That’s not in the script. Or, is it?

At this point, the public’s literally redirected, manipulated, at will. It’s a sick game being played by all who control the media.

From a personal standpoint, I’d rather make some popcorn, take my red wagon full of fiat, go camp down around $800/oz., and wait.

The gold ice cream man may never show up. If he does, great.

If not, there’re other opportunities; at least I’ll not be one of the manipulated masses screaming inflation hyperbole if/as/when gold ratchets all the way down.

Stay Tuned

Note:  Posts on this site are for education purposes only.  They provide one firm’s insight on the markets.  Not investment advice.  See additional disclaimer here.

Gold, The Big Picture

The bottom line for gold is: Retrace, lower

No-one in the inflation camp wants to hear that … it’s uncomfortable to face the potential of being so wrong.

Albeit wrong in the short term but probably right later … after it’s too late. More on that farther down.

Just like the lazy (and complicit, we might add) financial journalist publishing the standard (speck blaming) propaganda for the day, so too are the hyper-inflationists, jumping on the most popular bandwagon in town.

Not even considering the potential for a retrace; admittedly, which could be short and sharp but significant nonetheless.

This site has presented several times, we’re in a situation similar to that of Genesis 41. It’s the corn and grain first … then gold and silver.

Just to back that up a bit before getting to the charts, we have the following:

Crop failures world-wide

Systematic destruction of the food supply chain

Systematic elimination of farms and viable (for millennia) ranching practices.

Solar minima activity (decreased sun-spots) causing erratic weather patterns, shifting growing zones; even as far as sub Sahara, Sudan.

Those so focused on stacking metals will likely be using that stack to pry much needed food, food staples, seeds and fertilizer out of the hands of those not willing to sell … at any price.

Why are the oligarchs not worried about the ‘little guy’ stacking metals?

Because there’re going to make it irrelevant … at least for just long enough to completely bankrupt, starve or ‘inject’ the middle class.

Moving on to the charts:

The title header said ‘big picture’. Here we are with monthly gold charts going back to the 1950s, time-frame.

It’s been a long … long bull market. It appears to have made a top at ~1,972 and is retracing … if only just a bit.

The second chart is the one that gives us pause. Consider the potential for a more substantial pull-back.

Markets like to retrace and test. It’s what they do.

That second chart is scary. It’s plain, the 760 – 780 area is a long time (monthly) support level that goes all the way back to 1980.

Absolutely no-one expects, or is planning for gold to get back to $800/oz, or lower.

Think of the irony. The ‘stackers’ (and maybe the rest of us), having to exchange actual money, gold and silver, for worthless fiat just so they/we can buy food to stay alive.

After the middle class stackers have exhausted their metals hoard, that’s when gold and silver will launch into the next bull phase.

It has been done this way (keeping the peasants under control), literally for millennia. The method works … why change?

Summary:

The intent here, is to at least recognize the possibility for the above scenario. It’s clear and becoming more clear every day, food is the weapon of choice.

The objective is to have enough food ahead of time; be in position to take advantage of once-in-a-lifetime metals prices should that opportunity be presented.

Stay Tuned

Charts by Macrotrends

Note:  Posts on this site are for education purposes only.  They provide one firm’s insight on the markets.  Not investment advice.  See additional disclaimer here.

Gold (GLD) Hits Target … 166

Bring out the usual suspects.

Last month, March 13th, had this forecast for GLD, to retrace at least to 166-area; a Fibonacci 23.6%, level.

So, here we are.

GLD closed last Friday, at 166.35 … close enough.

Before we get to the chart analysis, we have the following summary from the video link in the header line:

‘We were seeing some noticeable improvement in the economy … especially in the U.S. as the [speck protection] took hold.’

(time stamp 5:03).

‘Taking hold’, indeed.

We can see just how well that’s going, here, here and here … adding to a very long list.

Before we leave this topic, we have entire school districts being shut down from speck protection reactions.

Let’s extrapolate that into ‘entire grocery chains shut down’, or ‘entire air transport companies shut down’ and the picture is clear.

By now, anyone with two lipids rubbing together can see the false narrative has reached beyond absurd into a completely different realm.

We’ll just have to call it the ‘Twilight Zone‘ for lack of a better description.

All of this will affect the markets … gold included; probably in ways unknown at this point.

Analysis:

So, here we are at the 23.6% retrace. What’s next?

First off, 23.6% is very weak. It’s not typically seen as the final (upside) reversal point in general market behavior.

However, if GLD does reverse from here, posting new daily and weekly lows, it’s in serious trouble.

The next chart has GLD in a downward channel that’s been in-effect since last August.

Pulling out to a longer time frame … the monthly; using a Fibonacci projection from these levels we have some interesting price targets.

Frist, is the 1:1, or 100.0% – 100.0% on the Fibonacci tool that projects GLD down to about 130 (129.64). This just happens to be the area Steven Van Metre has been discussing (as a potential target) for months.

Moving on lower to the 69.25 area for GLD, are targets mentioned by Harry Dent … albeit, years ago (actually, it was below $400).

We should keep in mind, a Fibonacci retrace of 76.4%, from all time high to cycle low, 1999/2001, is the 64-area on GLD.

Getting below $400 at this juncture seems unlikely.

Summary:

A downside reversal off 23.6% retrace would signify substantial weakness.

GLD would have to push below last week’s low of 161.81, to increase probabilities of a sustained downside move.

Stated many times on this site, precious metals are a crowded trade.

Operating at the same time, adverse reactions (and death) being caused by speck protection. A massive number of the population is subject to being permanently debilitated.

That could feed into the availability of all items; gold included but more importantly, the food supply.

To wit, CORN has just pivoted to the up side in a new trend; rising at over 437%, annualized.

More on that, later.

Stay Tuned

Note:  Posts on this site are for education purposes only.  They provide one firm’s insight on the markets.  Not investment advice.  See additional disclaimer here.

Gold To Rally ~ $1,660

If that happens, expect the usual suspects to ‘Go Postal’ on the hyperinflation narrative.

Johnny Bravo put it best when he said (to the effect) months ago:

We’re going to get hyperinflation. The question is “When?”

Looking at it a different way and in ‘Oligarch speak’.

The time for hyperinflation, is when the proletariat have exhausted their supplies of precious metals … most likely using it to buy food.

An engineered famine is being constructed; in process, as we speak.

Judging from comments on the financial sites, the public still thinks food prices are rising because of inflation.

There are exceptions (thankfully) like the comment area on ZeroHedge articles. Those few but growing number, understand exactly what’s happening.

So, what’s all of this got to do with the price of gold?

It’s perfectly natural and maybe expected that gold, GLD, after breaking support will rally back to test the 166 (~ $1,660) area.

Just like the incessant narrative on “The Speck“, which is drilled into the collective consciousness day after day (except maybe in South Dakota and Texas) so too, is the hyperinflation Weimar Republic narrative.

A Black Swan (as explained by Nassim Taleb) is a major unexpected event.

The flip side, a Black Swan is also a major expected event, that does not happen. That second definition is not commonly discussed.

What if hyperinflation never happens? What if there’s some kind of ‘transition’ before it has a chance to take hold?

If GLD tests 166, and reverses, downside targets are now 133 and then even lower at 110.

If that happens, there could be a market crash to go along with it.

With margin debt levels the highest in history, most if not all participants will be wiped out long before gold at $1,100 (or lower).

Silver and gold at fire sale levels and the public will be on the other side of the fence, turning in their precious metals hoard in exchange for worthless fiat dollars … just to survive.

It’s an oligarch’s dream come true.

Stay Tuned

Charts by StockCharts

Note:  Posts on this site are for education purposes only.  They provide one firm’s insight on the markets.  Not investment advice.  See additional disclaimer here.

Finally, Inflation Shows Up

Its been nearly twelve years exactly since the market bottom of March 9th, 2009.

At that time gold tracking fund GLD, was trading around 90.

Today, it’s at 167, a gain of about 85%.

Gold futures for April ’21, closed this past Friday at 1,777.4

Either way, it’s a far cry from the $10,000/oz. that has been bandied about for what seems like forever.

Prices for energy and food are rising because of reasons not discussed in the financial media.

That media is certainly not going to educate the public.

In turn, that public has shown there’re certainly not going to educate themselves. If they were awake, news channel ratings (in the link) would be at zero.

Unfortunately, this time around, the game’s up.

The ongoing collapse will decimate those who refuse to wake up and will probably take some of those who are, with them.

Which brings us to the so called inflation, at hand.

What can be said? We can call it lies, misinformation, propaganda but none of those really get to the root.

Input prices are rising not from inflation, but from supply constriction and disruption.

For example, the corporate (big-Ag) food supply chain as reported on many times, is intentionally being destroyed. The result of course, prices go higher.

We’re also in a quiet sun-cycle period that only serves to help with (cold) weather extremes. The only discussion from the media concerning the weather is that’s it’s getting warmer, right? Opposite of reality.

So we’re taking that ‘opposite of reality’ as a contrary indicator.

Whatever inflation we’ve got after nearly twelve years, is probably at or near a peak … ready to head lower.

That includes the market as well. The likely outcome:

Market down, bonds up.

The daily close of long bond TLT, has it in a support zone. One attempt has already been made to position long via TMF (not advice, not a recommendation) as detailed in this report.

Once again this past Friday, another TMF entry.

Both bonds and the markets (i.e. S&P 500) are at opposite extremes. The risk of loss in bonds may have reached its nadir.

Charts by StockCharts

Note:  Posts on this site are for education purposes only.  They provide one firm’s insight on the markets.  Not investment advice.  See additional disclaimer here.

SLV Up 10%, Can it Hold?

The short answer is, probably not.

Is anyone looking at the technical condition? No, it’s all about ‘putting it to the man’.

In all of Wyckoff’s writings, he never once proposed the idea of taking the large controlling entities for a ride.

He was totally immersed in figuring out what those entities were trying to accomplish; then getting on the right side of the trade.

For all we know, the whole hedge fund blow-up, kabuki theater could have just been a sacrificial lamb (an inside job) targeting silver for a massive short opportunity.

How’s that for strategic thinking.

Right now, in the pre-market, SLV is right at new recovery highs.

The real question should be, ‘how long can the hype last?’

Can it finish the week at new highs and post a bearish divergence on the weekly MACD?

Price action itself will decide. What we do have, is risk being removed on the short side.

Inverse fund ZSL is down a stiff -21%. If there is a short, that’s the one to watch (not advice, not a recommendation).

It’s important to note, GLD is nowhere near a +10% move. It’s a non-confirmation on silver.

Separately, the overall markets are trading higher but appear to be under their prior session (daily) highs … indicating a short position in those markets is still viable.

Charts by StockCharts

Note:  Posts on this site are for education purposes only.  They provide one firm’s insight on the markets.  Not investment advice.  See additional disclaimer here.

GDX Upward Test Possible

Last week, Senior Miners GDX, broke out of a bear flag to the downside.

There could be a little more momentum lower before reaching support in the area of 33 – 34.

After that, expect a test to the underside of the flag. This is typical market behavior.

If that happens, we’ll have familiar gold bull hysteria ‘this is it!’ All the while, GDX and gold (GLD) grinding lower.

Recall gold (and related), is a very crowded trade. Eventually, there will be a sustained bull market … probably after all have grown weary hearing the rumor of it.

Anecdotally, remembering entries from a diary during the 1932 lows (the actual source has been lost), were to the effect:

‘Everybody knew that major stocks were a once-in-a- lifetime deal, but nobody had any money‘.

That lifetime deal, or deals may come. The objective is to survive, prosper and be ready when it gets here.

With that, there’re probably much better opportunities for a directional move to the downside.

Real estate, Oil & Gas Exploration sectors come to mind.

On the real estate side, it’s unfortunate, sad, but entirely possible a significant number of those to lose their homes through foreclosure, are somehow going to be housed in now-empty, or near empty commercial (mall) areas or office buildings.

If so, that relocation process will take a significant amount of time. The value of IYR’s components (SPG, EQR, etc.) may reach some type of bottom before it’s all straightened out.

We’re already past the beginning stages of a massive life-long depression.

Getting focused on it, is difficult but best if one is to come out the other side intact; or better yet, well positioned to re-build.

Next scheduled analysis: Real Estate, IYR

Stay Tuned

Charts by StockCharts

Note:  Posts on this site are for education purposes only.  They provide one firm’s insight on the markets.  Not investment advice.  See additional disclaimer here.

Gold Down. Why?

We have the usual suspects rolled out; providing expert analysis on why gold went down.

The answer is quite simple. It tested a trend break, then reversed.

If we look at the (close) chart of GLD, it broke an uptrend during the week of November 20th, last year; went lower and then back to test.

That test was rejected dramatically with Gold (GLD), heading significantly lower; getting whacked down over 5%, in just two days.

This is not bull market behavior.

Steven Van Metre’s assessment (at this juncture) that we’re in a deflation event is being shown correct. The lagging factor in the scenario is the overall market … still near all-time highs.

It’s true bonds broke lower (rates up) this week but that’s another event answered by technicals; the wedge formation, discussed here.

Both bonds and the dollar have set the stage for a swift reversal.

Just how that’ll affect an extended, obscenely overvalued, stretched, call options wild market with everybody all-in, is not known.

Getting back to Van Metre; he’s reported, during this past week, small traders/speculators added to short (bond) futures positions.

If there’s a signal bonds are stretched, ready to reverse, it’s the little-guy just now getting in (going short) …. right at the bottom; as usual.

Charts by StockCharts

Note:  Posts on this site are for education purposes only.  They provide one firm’s insight on the markets.  Not investment advice.  See additional disclaimer here.

Gold (GLD) Updated Forecast

After the last post on GLD, price action pushed lower for one day before starting its anticipated move upward.

That lower push has altered the end point for counter trend action.

Adjusting forecasts and possible termination points is never-ending. 

Each bit of price action gives a new data point; confirming, negating, altering the perceived scenario.

A 38.2% retrace of GLD, on a closing basis from the November 30th low, gets to around the 177.00 area

This area also corresponds with a one-to-61.8%, “a-b-c” move from that November low.

Time wise, if GLD continues higher, we’re still on track for around December 29th, having already passed the December 16th, forecasted turn.

Note:  The December 16th date was off at this point, by one day.  GLD may have reached its counter trend high on the 17th.

If there’s a trade set-up (to go short) during the last week of the year, the objective is to initiate a position in the Senior Mining Index (GDX) via inverse fund DUST; not advice, not a recommendation.

Because of the current ambiguity, no positions are planned … yet.

At this point, we’re using the deflationary model, or macro as outlined by Steven Van Metre.  Price action thus far, is confirming that thesis.

Also worthy of investigation (more later) is how banks will get out of their massive long-bond positions.  A potential scenario of Negative 6%, is discussed by J. Bravo and Jeff Booth.

We’ll see if further investigation of ‘Negative Six’ as we’ll call it, includes IRA confiscation. 

Years ago, Prechter wrote just how simple that would be.

Summarizing his words:

We’d have a complete market melt-down.  IRA withdrawal penalties made prohibitive; for your ‘safety’ only treasuries can be in the portfolio. Voila! We’re done!

What needs to be kept in the forefront of everyone’s mind accessing these updates is the overall objective remains the complete destruction of the middle class.

Even in the Bravo post liked above, at Time Stamp 19:50, he presents that destruction as the Neo Feudalism already discussed here, two-weeks ago.

Price action is the key.  If GLD continues higher and past the 50% retrace, it indicates something else is afoot. 

If that happens, the bearish look then turns bullish.

A downward reversal from this point would suggest the December 16th date was off by one day and the corrective move higher is complete.

Stay Tuned

Charts by StockCharts

Note:  Posts on this site are for education purposes only.  They provide one firm’s insight on the markets.  Not investment advice.  See additional disclaimer here.

Oil & Gas: Power Down

Thrust energy in Oil & Gas sector XOP, continues to erode.

The weekly chart of XOP, has the longer term view … including the confluence of trend-lines; another factor.

Now on the daily, it too is losing power.  Force Index (bottom of chart) has successive lower highs and on Monday, a lower low as well. 

Downward pressure is increasing.

The EIA report is released at 10:30 a.m. EST. We’ll see if there’s another inventory build.

The firm is currently short this market via DUG (not advice not a recommendation). Hard stop: DUG, 24.72

There’s some level of protection (against volatility) with DUG reaching an apparent low last week and XOP making its high.

Moving on to Gold:  GLD, GDX, DUST

Pre-market shows gold flat and the miners (GDX) trading slightly higher; still on track to the target in this update.

If and when targets are reached, we’ll assess whether or not a low risk (short) position is available via DUST.

Charts by StockCharts

Note:  Posts on this site are for education purposes only.  They provide one firm’s insight on the markets.  Not investment advice.  See additional disclaimer here.