Establish Full Position(s) … Early

As the ‘About‘ page says, we’re emulating trading and analysis techniques, used by Livermore, Wyckoff & Loeb.
Livermore’s listed first, as he figured out through many gains and losses, he’s primarily, a strategist:
‘What’s likely to happen, in a big way?’
Wyckoff is next as the tactician, with Loeb as the focus; meaning, concentrate positions, do not ‘diversify’ (not advice, not a recommendation).
Incremental Entries
The potential for reversal in the semiconductor index, started with this post.
From that post, the sidebar shows an initial short, labeled as: SOXX-25-01.
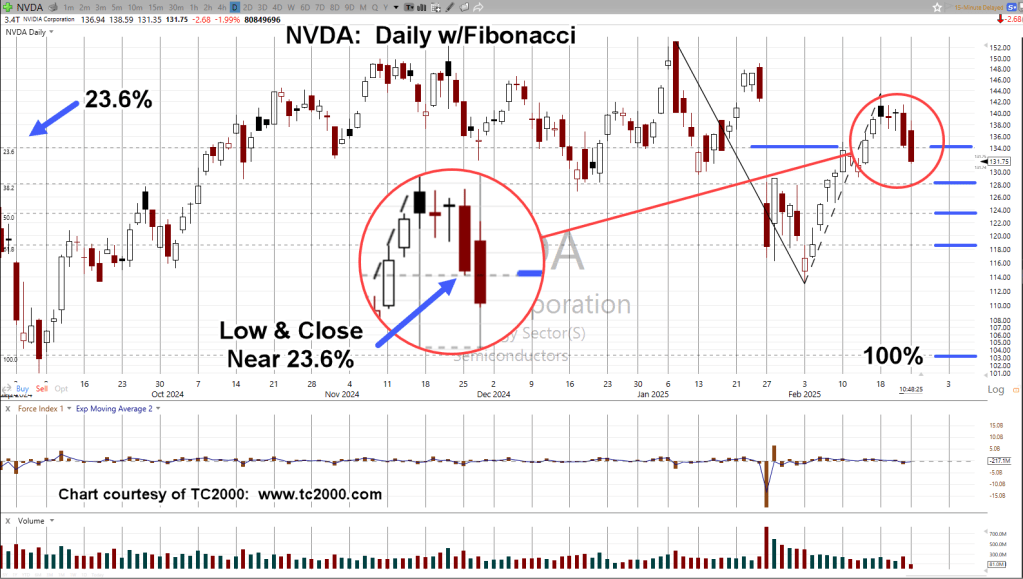
Moving on to this post, Nvidia was used as a proxy for the SOXX; once again, we see SOXX-25-01, in the sidebar.
The short is active, size increased by 50%, last Thursday.
Today, price action posts a new daily low, dips below resistance in 240 – 242, area, increasing probability it’s an up-thrust (reversal).
SOXX-25-01, size increased again by 30%, and we’re done.
The amount of capital planned for the position has been fully allocated.
Set The Stop, & ‘Walk’
From this point, anything can happen.
With that said, the obvious stop location for the current position, is just above today’s high (not advice, not a recommendation).
With a combined entry of 242.26, getting stopped out just above 242.13, would be at break-even.
Stay Tuned
Charts by StockCharts
Note: Posts on this site are for education purposes only. They provide one firm’s insight on the markets. Not investment advice. See additional disclaimer here.
The Danger Point®, trade mark: No. 6,505,279