Trend & Channel

Get In … Get Out

There tends to be a period of consolidation and organized chaos, before price action enters and exhibits channel behavior.

Of course, the problem from a trading perspective, be able to wait through the chaos getting to the set-up and that’s no small feat.

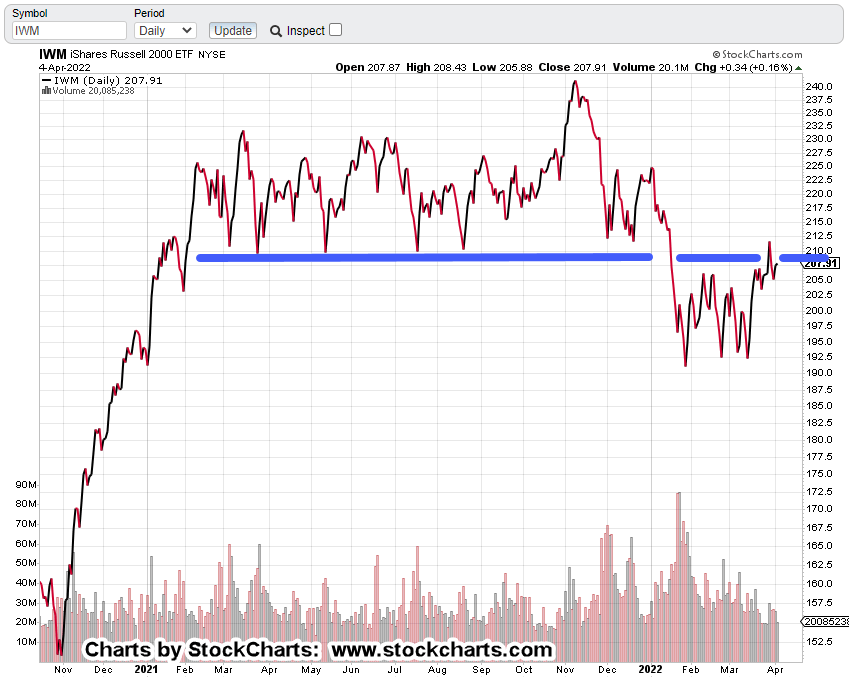
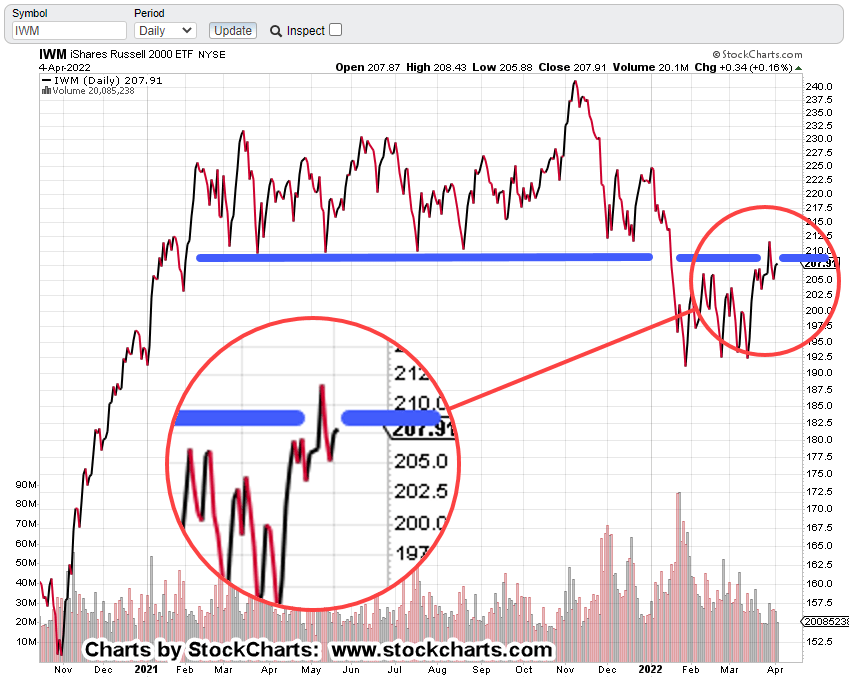
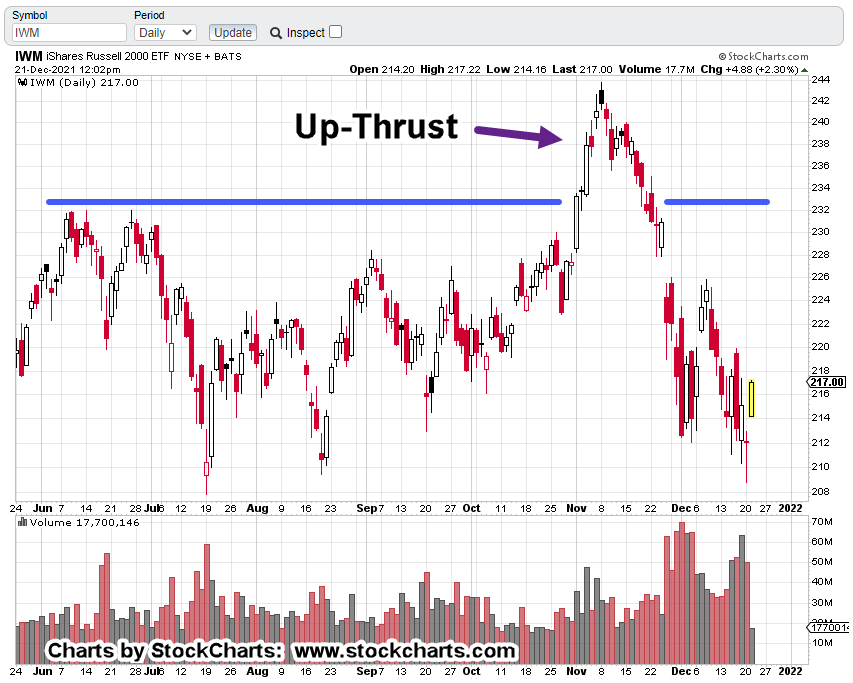
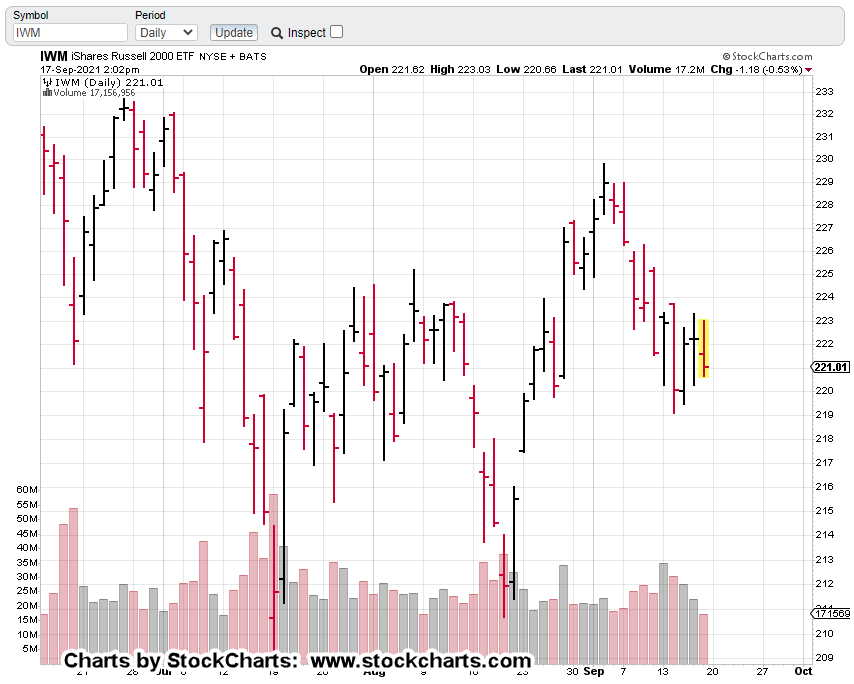
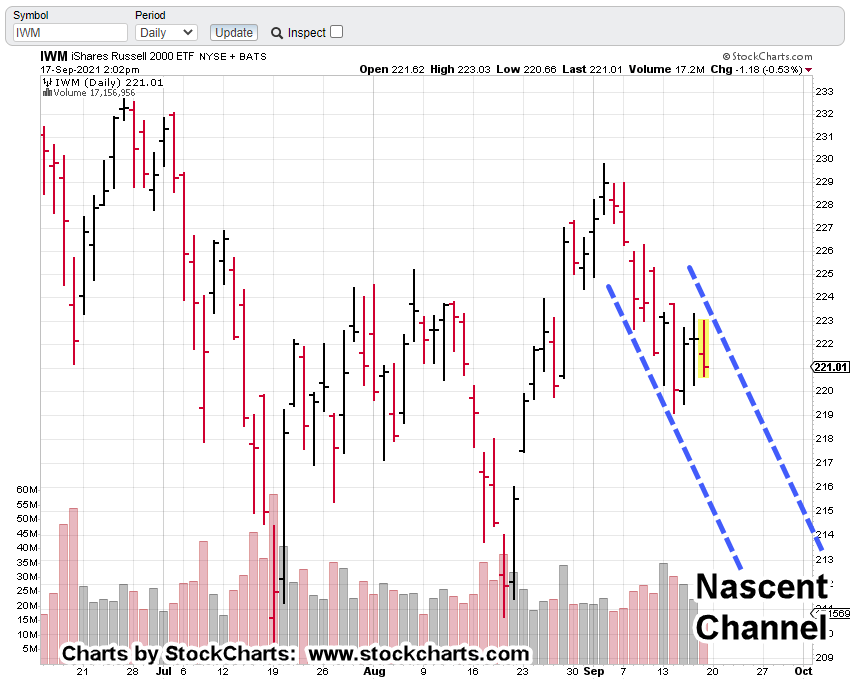
Several of the major indices are in a channel right now. Those are (ETF symbol) SPY, QQQ, IYR and IWM.

We’ll discuss the Q’s farther down but first, this just out, on ZeroHedge, concerning the overall economic conditions.

That is, we’re already in full scale economic collapse and they have the data to prove it.

As incredible as it may be, there are still sectors of the population that believe, ‘the consumer is strong’.

A big wake-up call is coming for them. Oh wait, is that a telephone ringing off in the distance 🙂

The media lies appear to be crumbling at an exponential rate; there’s no guarantee it’ll all hold together into late January, or mid-February as presented only yesterday.

From a Nasdaq (QQQ), technology sector perspective, we have the following.

NASDAQ QQQ, Weekly

The Q’s began the week with a lower open and within the range of the prior week.

It’s a subtle clue the direction remains down and the market’s not volatile … just yet.

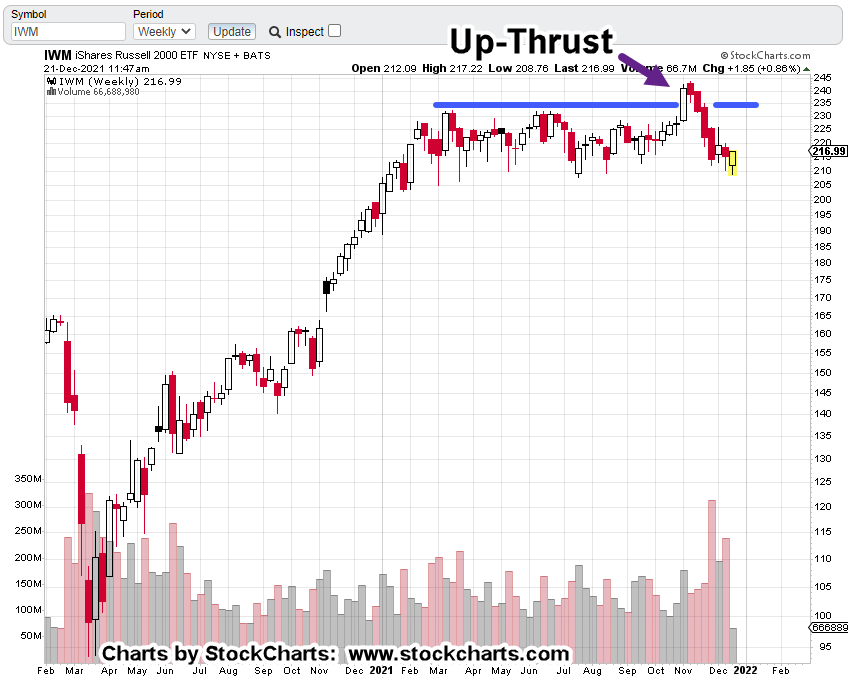
Next up, is the channel

It has the right ‘look’.

Moving in closer; the right-side trend line verification (hits).

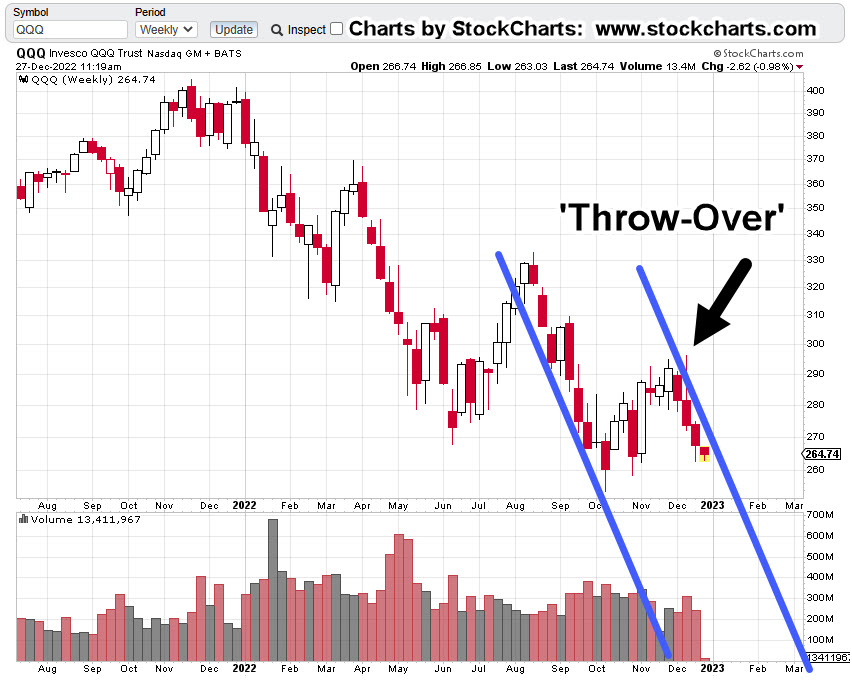
There are no fewer than four weekly hits (including today) that verify the right side. The attempted push out of the channel is identified as the ‘Throw-Over’.

Attempted breakouts (and failures) are common market behaviors. We see that price action quickly got itself back into the channel.

Get In … Get Out

At this juncture, price action remains in the channel.

A short position (via QID, or equivalent) is a viable choice for the trader/speculator (not advice, not a recommendation).

For the reasons described above (the collapse), we appear to still be in the early stages of the down channel.

Obvious discretionary exit points for a short trade would be left side contact of the channel i.e., the ‘demand’ side or a decisive right-side breakout i.e., the ‘supply’ side (not advice, not a recommendation).

Summary

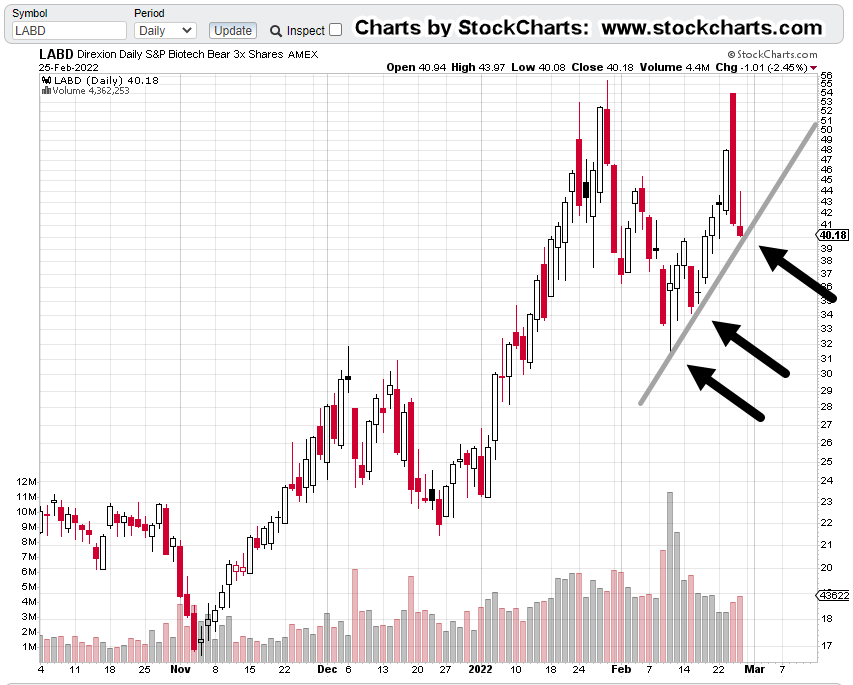
In a separate market, Netflix (NFLX), may have hit the right side of its own tend line as well.

It seems to be all happening very quietly.

Stay Tuned

Charts by StockCharts

Note:  Posts on this site are for education purposes only.  They provide one firm’s insight on the markets.  Not investment advice.  See additional disclaimer here.

The Danger Point®, trade mark: No. 6,505,279

Biotech Disconnects & The Claus

Naughty or Nice ?

Biotech price action’s disconnecting from the rest of the market.

Around the last Fed meeting, biotech separated from the major indices, heading the opposite direction, i.e., sideways to higher.

We’ll see that as we get into the snapshots of the hourly charts (below), but first several clues on why biotech (so far) isn’t going along.

The Next Plan Rolls Out

First up is this, just out on ZeroHedge.

It appears the next push is on … and the target is the kids. Another wave of ‘protection’ is certain to boost profits.

Note: Those commenting on ZH have been ‘awake’ from the start; an invaluable resource.

Next up is this, just out on BrandNewTube; another clear thinker that helps ‘tie it all together’.

Is this the explanation for biotech’s current behavior?

Strictly speaking and from a Wyckoff perspective, we won’t know the real reason for a move until it’s nearing the end.

What we can see, is that character of price action has changed (again).

With that, we’ll look at the 3X, leveraged inverse funds of two indices, Russell 2000 (TZA) and SPBIO (LABD).

TZA & LABD, Hourly

The disconnect has been a recent observation.

We’ll drill right down to the hourly and put the charts one on top of the other.

We can see that while inverse TZA, is now back up to the pre-squeeze high, inverse LABD, is far below that level.

That’s not to say things can’t change quickly.

For now, however, there may be something else going on that’s keeping the sector buoyant and suppressing the LABD, inverse fund.

Stay Tuned

Charts by StockCharts

Note:  Posts on this site are for education purposes only.  They provide one firm’s insight on the markets.  Not investment advice.  See additional disclaimer here.

The Danger Point®, trade mark: No. 6,505,279

Downside Kick-Off … and, Biotech

Biotech, And The Next ‘Event’

Now, it all makes sense.

The solstice was yesterday.

Hard reversal in the market, today.

Then, there’s biotech; stubbornly refusing to break down.

First, Some Housekeeping

Before we go any further, from a housekeeping standpoint, all biotech short positions have been closed (not advice, not a recommendation).

Each apparent downside breakout attempt for the past three months, has been thwarted. There is something else going on.

Possible reasons for biotech’s resilience can be found here, and here and here.

Hint: There’s another planned ‘event’, on the way.

Now, back to the markets.

All major indices are sharply lower but for this update, we’ll focus on the Small Caps (Russell).

Russell 2000 IWM, Daily

Instead of starting with the big picture and longer timeframes, we’ll get straight into why today’s action may be significant.

Yesterday, price action attempted to ‘spring’ off the support boundary. Today, that spring has apparently failed.

Failed moves bring out the other side in force; in this case, the bears as it’s obvious the opposing side, the bulls, are exhausted.

It’s getting late in the session (2:50 p.m., EST) and the expectation is for a lower close.

If this really is the kick-off to the downside, then we’ll expect some kind of follow through at the next session.

Stay Tuned

Charts by StockCharts

Note:  Posts on this site are for education purposes only.  They provide one firm’s insight on the markets.  Not investment advice.  See additional disclaimer here.

The Danger Point®, trade mark: No. 6,505,279

Russell … Hovering At Target Level

Price Action Confirming Fibonacci

It’s just past midway through the session.

The weekly chart of Russell 2000 IWM, is hovering at the first projection level … 23.6%.

Russell 2000, IWM, Weekly

We’ll get closer in, using the 4-Hour chart

Note how price action is oscillating about the 23.6%, level.

This type of behavior provides confirmation the market ‘respects’ that level.

Note in the weekly chart, there are no fewer than six weekly bars (including this week) that either had an open or close, near 23.6%.

As this post is being created, the market appears to be pivoting out and down from this area.

It may be on its way to lower levels (not advice not a recommendation).

Stay Tuned

Charts by StockCharts

Note:  Posts on this site are for education purposes only.  They provide one firm’s insight on the markets.  Not investment advice.  See additional disclaimer here.

The Danger Point®, trade mark: No. 6,505,279

Russell, Low(s) In Late June ?

Cycles & Fibonacci

Both time cycles and Fibonacci are aligned … targeting intermediate low(s) for the Russell (IWM), in June.

This post, released late on Monday, showed a potential reversal set-up for the IWM.

The next morning (yesterday), saw a sharp, brief move higher which quicky reversed into a sustained decline.

That decline continues during this session.

The weekly chart of IWM is below; marked up with a Fibonacci time sequence.

Russell 2000, IWM, Weekly

Week 34, identified with the back font, represents a 1 : 1, Fibonacci projection of the initial leg down.

Week 34, in the magenta font, is a 1 : 1.618 projection of the same initial move.

These are projections only (not advice, not a recommendation).

However, there’s a time cycle study available at this link.

Go to time stamp 8:27, for the Russell 2000. The method is different, but the projection is similar; heading lower into early Summer (mid to late June).

Stay Tuned

Charts by StockCharts

Note:  Posts on this site are for education purposes only.  They provide one firm’s insight on the markets.  Not investment advice.  See additional disclaimer here.

The Danger Point®, trade mark: No. 6,505,279

Russell 2000 … Hit & Run ?

Up-Thrust And Test

Shorts Covered ?


Russell 2000, attempts to break through resistance; reverses and then tests (Monday), just as ZeroHedge says the short squeeze is over.

There’s a lot of trying-to-make-everything-look-complicated, wording in the link above but the take-away is, the market may be finished with the recent short squeeze.

At this juncture, Russell 2000 (IWM) looks like it’s hit long-time resistance around the 211, area and reversed.

The past two trading days may have tested that reversal.

IWM, Daily Close

The support (blue line), now turned resistance has been in-effect for over a year.

The zoomed version below shows it’s clear, at this juncture, price action’s not penetrating resistance.

As with bonds in this report, we’re at the danger point.

This is where risk is least for either short or long (not advice, not a recommendation).

Naturally, with the ZeroHedge report (above) saying that shorts have been effectively covered, price action direction favors the downside.

Stay Tuned

Charts by StockCharts

Note:  Posts on this site are for education purposes only.  They provide one firm’s insight on the markets.  Not investment advice.  See additional disclaimer here.

The Danger Point®, trade mark: No. 6,505,279


Biotech … Ready To Reverse

Highly leveraged (3X Inverse of SPBIO), LABD, looks ready for upside reversal.

The next chart shows trendline contacts.

Volume increased on Friday while the trading range narrowed significantly.

The next chart’s a little busy but zooms in on the volume and the daily range in question.

The overall markets have rebounded during the past two trading days.

Inverse funds have declined correspondingly.

Interestingly, LABD seems to have maintained its upward bias (down for SPBIO) better than other inverse funds like SDS, DXD, SOXS, QID and TZA.

Summary:

For downside action, one wants to look for the weakest sector.

Look for a new daily LABD high on Monday, (new low for SPBIO).

This is a typical entry signal with stops at the last session’s low; currently LABD, 40.08 (not advice not a recommendation).

Stay Tuned

Charts by StockCharts

Note:  Posts on this site are for education purposes only.  They provide one firm’s insight on the markets.  Not investment advice.  See additional disclaimer here.

The Danger Point®, trade mark: No. 6,505,279

The Next Set-Up: Russell 2000

Do You See It ?

It’s not always what’s happening; it’s also what’s not happening.

‘The curious incident of the dog in the night-time’ … the dog did not bark and so indicated, it knew the killer.

In Steven Van Metre’s Sunday night update (time stamp 5:55), he highlighted that small caps, IWM, (Russell 2000) tracking fund is in a ‘crash pattern’.

We’re going to look at the small caps and see what’s there and what’s not.

Russell 2000 (IWM):

Weekly Chart of IWM

The up-thrust is clear … we can see that.

However, the question is, what’s not happened with this (potential) set-up?

Moving to the daily chart, it shows the up-thrust has not been tested.

There’s no rule that says it has to be.

However, price action shows a spring set-up and retrace in process (below). We also have a Fibonacci target that looks like it might work out.

Moving closer in on the daily.

A retrace to the 62% level, would (could) act as the test of the up-thrust shown on the weekly chart.

That move if it takes place, would create its own up-thrust of the resistance area (below the 62%, level).

On top of that, we may have financial media helping out by getting participants on the wrong side; if so, they’re likely to foment news stories of continued ‘recovery’ or ‘inflation’ moderating … or some such non-sense.

The Media’s Role

In fact, if we get a retrace and the press does not jump on board … I’d be wary of the set-up (not advice, not a recommendation).

Remember what a good job they did with gold … $3,000/oz, is “imminent”, right?

Gold Down, Market Up?

Is that possible?

For starters, the question is what’s called a ‘mind-trap’. A certain way of thinking that causes one to get boxed-in.

The dollar continues its rally and gold appears to still be inversely correlated. We’ll stay with that as the main indicator of GDX downside potential.

Yesterday, it was thought the up-side correction in GDX, was complete … and that may still hold true. Today’s action looks like a minor test (thus far) of that correction.

Note, at this juncture, heavy-hitter, NEM, has posted out-side-down from yesterday’s price bar … hinting that it’s ready to continue lower.

Stay Tuned

Charts by StockCharts

Note:  Posts on this site are for education purposes only.  They provide one firm’s insight on the markets.  Not investment advice.  See additional disclaimer here.

The Danger Point®, trade mark: No. 6,505,279

‘Fed – Fake’

After The Close

One-Way Before

Opposite-Way After

As is typical of Fed announcements, the market tends to go one way before the speech … then, the opposite way after the speech.

As real estate (IYR) pushed higher before the speech, it got just a little too far upward for comfort. The short position was closed out for one managed account.

As time progressed, price action was clearly setting up a spring condition; seen in the 30-minute leveraged inverse fund DRV, above.

The Project Stimulus Account closed its TZA position (for profit, table to follow) and the account then positioned long DRV, at about 4.49 (not advice, not a recommendation).

The stop is tight … the low of the day @ 4.42 (not advice, not a recommendation)

We’ll see what happens next

Stay Tuned

Note:  Posts on this site are for education purposes only.  They provide one firm’s insight on the markets.  Not investment advice.  See additional disclaimer here.

Russell 2000 … Channel ?

Late Session

Possible Trading Channel Forming

The past six months shows the Russell 2000 (IWM) in choppy and impulsive action; both up and down.

The last eight trading days have seen that choppy action begin to exhibit a hint of order.

It does not look like much … until you put in a trend-line .. or two:

Adding to the intrigue; channel width is at Fibonacci 8-Days.

If today’s session closes lower (no guarantees) and posts a new daily low (below 220.26), it adds weight the Russell may be in the very early stages of trending lower.

Stay Tuned

Charts by StockCharts

Note:  Posts on this site are for education purposes only.  They provide one firm’s insight on the markets.  Not investment advice.  See additional disclaimer here.