No ‘Soft Landing’ or ‘Hard Landing’

There’s Only, ‘Collapse’

The ‘narratives’ are false.

There’s no ‘recovery’, no ‘soft landing’, no ‘hard landing’.

There’s no ‘housing boom’, no ‘inflation’, and maybe most of all, no (sustainable) ‘Electrical Vehicle’ market.

What there is …. is ‘collapse’.

Collapsing food supply, collapsing economy, collapsing real estate, collapsing employment and collapsing (electrical grid) infrastructure.

How do we know that?

The price action (the market) itself, says so.

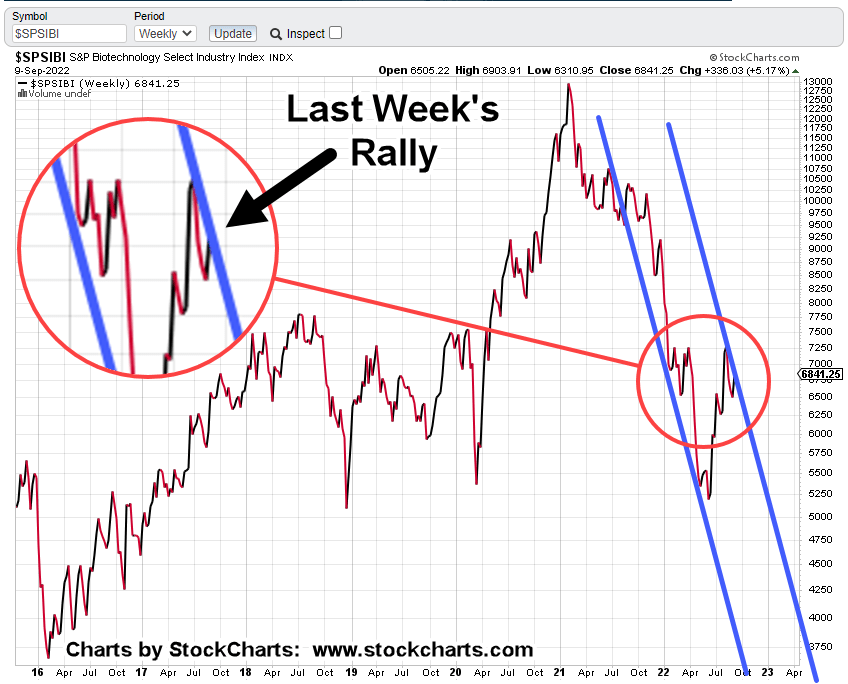
Wyckoff, The Rest, and Gold

As stated in the last update, unlike other analysis methods, Wyckoff looks at what the market is saying about itself.

The market itself, defines the next likely course of action.

Two days ago, gold was used as the example.

Contrary to the ZeroHedge report linked in the prior update, Wyckoff analysis revealed the most probable direction for gold, was down.

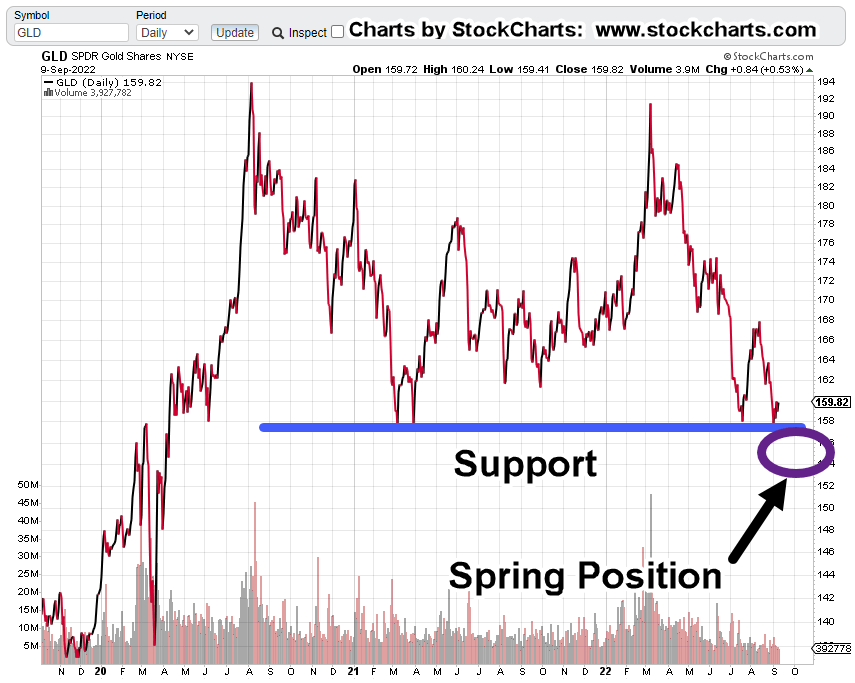
The Gold (GLD) Market

The Fed announcement late Wednesday, resulted in a ‘blip’ higher for gold that stalled-out, the next day.

However, that announcement, may have confirmed a trend change in GLD.

Looking at the chart below, it’s possible that Wednesday identified a more aggressive trendline, lower.

Gold (GLD), Daily

It’s about an hour after the open.

This is how it looks for GLD.

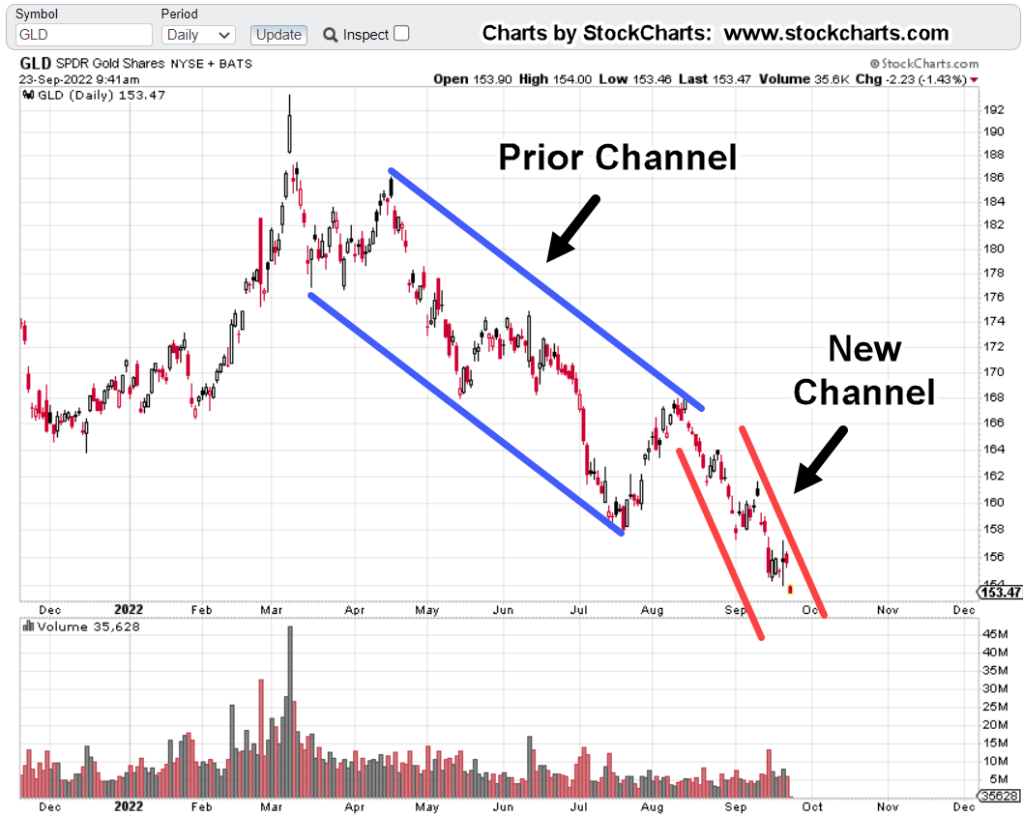
The new trendline and trading channel are clear; trending lower at approximately -60%, annualized.

The next chart is a zoom of the pivot area.

If there ever was going to be a Fed ‘Pivot’, this was it. 🙂

The price increases being touted as ‘inflation’ are clearly the result of supply destruction.

You can’t have 90+ ‘food processing plant fires’ in the past year or so and not have it affect prices at the supermarket.

Same goes for crop failures or lack of harvest world-wide.

Summary

As always, anything can happen. Gold could reverse and mount some kind of rally.

If somehow, there’s a change of demand, it will show up on the tape (the chart) as a change of character.

So far, there is none.

Most likely direction remains to lower levels.

Parting Shot

Just to illustrate the point of ‘collapse’, we’ll leave off with this recent report from Scott Walters.

The real estate example shown is the River Oaks area of Houston … Highly affluent.

There’s no debate.

It’s a collapse, when a house has to drop $20 million, from $26.5-mil to $6.5-mil, and Still Not Sell!

Stay Tuned

Charts by StockCharts

Note:  Posts on this site are for education purposes only.  They provide one firm’s insight on the markets.  Not investment advice.  See additional disclaimer here.

The Danger Point®, trade mark: No. 6,505,279

Gold Penetrates Support

The ‘Inflation’ Narrative Is False

How do we know the ‘narrative’ is false?

Because the price action tells us at this juncture, we’re in some kind of ‘deflation’ impulse.

Taking it a step further, what happens if we don’t get the much assumed ‘hyperinflation’.

What if something else is afoot?

Remember, a Black Swan can also be an upcoming event that’s widely accepted as fact but does not happen.

Now, to the ‘inflation’ indicator itself: Gold

Gold (GLD) Weekly Close

The downside penetration is clear.

GLD, is at The Danger Point.

If we really do have inflation and gold’s going to launch much higher, the last report stated, penetrating support and setting up a Wyckoff ‘spring’ condition would be a good place to start.

So, here we are.

As this post is being created, GLD is rebounding higher by about +0.50%.

This is normal market behavior.

However, the next chart says gold’s likely to have a hard time moving decisively higher.

On a weekly close basis, gold’s in a confirmed downward channel.

It’s going to take a lot of demand to break out of that trend.

Summary

So, far, the attitude of the ‘average investor’ to gold’s decline is “Good, I’ll just buy more.”

Six months or a year from now, when food supplies have run out or become so expensive, only ‘zee bugs’ will be reasonably priced, one has to wonder if we’ll all have the same attitude.

Stay Tuned

Charts by StockCharts

Note:  Posts on this site are for education purposes only.  They provide one firm’s insight on the markets.  Not investment advice.  See additional disclaimer here.

The Danger Point®, trade mark: No. 6,505,279

There is no ‘Spoon’

Paradigm Shifts

We’re living in the surreal.

Only those who can ‘see’, understand it’s like something out of The Matrix.

The old paradigms no longer apply.

There is no ‘Pivot’

There never was a ‘pivot’; just like there never was a goal of 2% inflation, or full employment.

Way back in 1921, Jesse Livermore pegged it when he told Wyckoff, the whole premise of Wall Street, was to spread “deception”.

Deception is the key.

Attempting to figure out the next earnings release, the CPI or employment numbers, inflation, or what the Fed is likely to do, is to buy into the deception.

Following that deception, is the path of the amateur.

Meanwhile, back on the professional side; as early as 1909, Wyckoff discovered market prices move based on an energy and objective or their own … completely removed from any fundamentals.

A few days ago, this update, discussed how biotech SPBIO, was potentially at a pivot point and ready to reverse lower.

Well, downside reversal is what we have.

Biotech SPBIO, Weekly Close

Even though we still have three trading days left, SPBIO, appears to be confirming the right-side trading channel.

Last Week.

And … this week

With the overall markets down sharply, events appear to be set in motion to continue downside action.

Summary:

As stated in prior updates, the current trade; LABD-22-05, was initiated in anticipation of a significant break lower (not advice, not a recommendation).

On the biotech fundamentals side (not that it matters), the wheels have come off.

The top weighted equities have no P/E … a decent conclusion may be the lower weightings don’t either.

Nobody’s making any money; rates are rising and we’re heading straight into an economic depression.

Stay Tuned

Charts by StockCharts

Note:  Posts on this site are for education purposes only.  They provide one firm’s insight on the markets.  Not investment advice.  See additional disclaimer here.

The Danger Point®, trade mark: No. 6,505,279

Gold … Ready To Move

Up or Down ?

Before we get started, no analysis would be complete without the latest mega bull forecasts for gold.

Here they are:

“Everyone Is WRONG About This Cycle” – Peter Schiff

Well, ok. I only have one bullish report.

Since it’s from Schiff, do we really need more? 🙂

Remember, back when it was the Russians that were going to move gold higher? You really can’t make this stuff up.

So, let’s move on and take a look at the truth … the price action for gold (GLD).

Gold (GLD), Daily Close

The un-marked daily chart shows about three-years of price action.

The next chart shows the ‘Changing of Hands’ that was first identified over four months ago in this post.

Also shown is the current (channel) trendline that appears to be in effect; GLD, is ‘respecting’ the line.

The left side channel line is grey in color so that multiple hits are shown more clearly.

However, the next chart is where it gets interesting.

If or when GLD penetrates support, it would by definition be set-up in Wyckoff ‘spring position’.

If GLD, was going to launch to new all-time highs, getting itself into ‘spring position’ would be an excellent place to start the move.

If and when there’s penetration of support, one thing to watch closely is the volume.

Would it be another high volume ‘changing of hands’ (for the upside) or a low volume affair that grinds on down.

Summary

From a fundamental standpoint, where’s the money going to come from to increase the demand for gold?

We’re already at the front end of (very likely) the largest real estate crash in U.S. history.

The consumer’s tapped out with record high credit card debt; mass layoffs have already started.

Bankruptcies in some areas are up over 100% from last year. Bankruptcy means ‘liquidation’ and that includes any precious metals.

Anything can happen and gold could rally.

However, the backdrop of demand destruction and asset collapse, suggest the direction for gold continues to be to lower levels.

Stay Tuned

Charts by StockCharts

Note:  Posts on this site are for education purposes only.  They provide one firm’s insight on the markets.  Not investment advice.  See additional disclaimer here.

The Danger Point®, trade mark: No. 6,505,279

The ‘Santa Claus’ Rally

That Was it!

It’s going to be a very different place come December.

This won’t be like ’08 -’09, where all the stops are being pulled to ‘rescue’ the market.

No, this time really is different.

We can all see by now; the plan is controlled demolition.

Paraphrasing Jerimiah Babe, and Pinball Preparedness, we haven’t even got started (with the collapse) and the public’s already folding up.

What’s it going to be like when it really hits?

This past week, all the major indices have gone through some type of relief rally. Call it a Santa Claus rally because there probably won’t be one this December.

Trading Consistency

Throughout this upward correction, the case has been made over and again, only biotech SPBIO’s in a technical (and fundamental) condition that would allow it to decline farthest and fastest (not advice, not a recommendation).

Wyckoff analysis along with Livermore’s strategic approach that’s coupled with Loeb’s ‘focus’, has led us to (shorting) this sector exclusively.

Strategy, Tactics, Focus

Biotech SPBIO, Weekly Close

Looking at the far-right side of the chart, SPBIO rallied this past week. It looks like it may head higher … that is, until we put in the trend-lines.

Now, let’s put in the trendlines.

Extended trendlines show the downside potential.

We’re about to see how this works out.

Friday’s upward action in SPBIO slowed with inverse LABD, posting narrow (downside) action as well.

Ready to reverse.

Summary

Trading action in the past week amounted to reducing the position size in LABD-22-05, by about 4.6% (not advice, not a recommendation).

If and when SPBIO continues is downward trajectory, that position (shorting via LABD) will again be increased as the market allows.

Stay Tuned

Charts by StockCharts

Note:  Posts on this site are for education purposes only.  They provide one firm’s insight on the markets.  Not investment advice.  See additional disclaimer here.

The Danger Point®, trade mark: No. 6,505,279

What ? … There’s No ‘Pivot’ ?

There Never Was

Well, another financial media lie has come and gone.

As Jerrimiah Babe says, time stamp 6:05, at this link:

“The good times are over.”

The Dow Jones was down over 1,000 points on the day and finished (along with the S&P, NASDAQ) right at the session lows.

Typical action for the markets under such conditions, is a follow-through at the next trading session, Monday.

Recall, it’s been presented many times on this site (Holiday Turns), major reversals tend to occur just before, during, or just after, a holiday week.

The 2008, countertrend reversal took place on the Monday (5/19/08), leading into Memorial Day Weekend. The big one in 1929, was the Tuesday (9/3/29) following the Labor Day Weekend.

The current reversal (discussed below), if it holds, has come a couple weeks early in the ‘holiday’ window.

It’s possible because of the massive size of this monster, that a week or two does not make a difference.

Let’s look at the Dow 30 and its perfect Wyckoff Up-Thrust, Reversal, and Test.

Dow 30, DIA Daily Close

Daily Close with Fibonacci retrace levels identified.

A close-in look on the reversal area.

Looking at the zoom-chart above, we had a Wyckoff Up-Thrust that touched 61.8%, then declined sharply before coming back to test at 50%.

After the test was another sharp decline. One can make the case, the up-thrust has been tested.

Continued (overall) downside is the higher probability with a ‘no Fed pivot’ providing the tailwind.

Stay Tuned

Charts by StockCharts

Note:  Posts on this site are for education purposes only.  They provide one firm’s insight on the markets.  Not investment advice.  See additional disclaimer here.

The Danger Point®, trade mark: No. 6,505,279

Gold’s Downside … Just Starting

Long Term ‘Changing of Hands’

A bearish analysis for gold?

What kind of idiot would think that gold (GLD) is going lower?

Well, for starters, it’s not what one ‘thinks’ that’s important.

Way back, when I was being mentored by the late David Weis, he never started our sessions with ‘what do you think’.

No, he always started by presenting a chart and then asking (and I quote), “What do you see?”

It was never ‘what’s the Fed doing’ or ‘what’s Cramer saying’ (that’s an easy one), or ‘what are earnings’ or any other number of useless, distracting rabbit-holes.

“What do you see?”

With that, we’re going to look at the long-term chart of gold (GLD) on a weekly close basis.

Gold (GLD) Weekly Close

With the passing days, weeks and now months, we can see there’s been a significant, potentially long-lasting reversal to the downside.

The prior report linked here, contains no fewer than seven other links to gold (GLD) that identified ‘changing of hands’ in various stages as it transpired.

Slow Motion Train-Wreck

So far, events in gold have been moving slowly and thus hypnotizing the gold bulls.

It was nearly two-years (20-months) between the Wyckoff Up-Thrust high (8/6/20), and the test of that high (3/8/22).

Enough time to put everybody to sleep.

At this point, GLD is back down near support levels … another bounce higher is not unreasonable.

However, it’s trading in a downward channel (not shown) that’s declining at approximately – 30%, annualized.

The above linked report presents long-term downside targets for GLD (not advice, not a recommendation).

The ‘Event’

As Pinball Preparedness puts it, each day that passes brings us one day closer to ‘the event’.

None of us in the proletariat know what the event will be.

It could be an excuse as disconnected as Archduke Ferdinand.

Stay Tuned

Charts by StockCharts

Note:  Posts on this site are for education purposes only.  They provide one firm’s insight on the markets.  Not investment advice.  See additional disclaimer here.

The Danger Point®, trade mark: No. 6,505,279

No P/E ? … No Problem … Yet

Biotech SPBIO, Has No P/E

Is this like Carvana on steroids?

Looking at the top ten components of the SPBIO sector, making up over 14%, of the weighting, none have a P/E ratio.

The three largest weightings are listed below along with hyperlinks to their corporate summaries or research.

Beam Therapeutics Inc.: BEAM

Twist Biosciences Corp.: TWST

Fate Therapeutics Inc.: FATE

The Return on Equity for the list is Negative – 31.9%

With returns like that, it’s unlikely a positive P/E, is showing up anytime soon.

The Market Itself

Livermore worked to prefect his technique, searching for what’s going to happen in a ‘big way’.

Wyckoff discovered the market itself, decides on its next likely course.

Loeb presented the power of ‘focus’; Concentrated positions that eschewed the mediocre mantra of ‘a well-diversified portfolio’.

It’s important to note, Loeb was the former Vice Chairman of E.F. Hutton. The old commercials from the 70s, like the one linked here, were talking about him: ‘When Loeb talks, people listen’.

The Biotech Short

The vultures are circling this sector.

We’ve already shown in the last update, speculative volume on the 3X Inverse fund LABD, is literally off the chart.

The corporate links above, give us a potential ‘why’ for their short positioning.

All three of those companies have a common theme.

Stay Tuned

Charts by StockCharts

Note:  Posts on this site are for education purposes only.  They provide one firm’s insight on the markets.  Not investment advice.  See additional disclaimer here.

The Danger Point®, trade mark: No. 6,505,279

Biotech’s, Jaw-Dropping Volume

Bears Capitulate

According to this, just out on ZeroHedge, that’s what’s happened.

As we’ll see below, there’s certainly something unprecedented going on, specifically in biotech.

The prior update made the argument, biotech SPBIO, has a unique distinction that’s showing up on the leveraged inverse fund LABD, shorting the sector.

For illustration purposes, we’re going to do a little ‘trick’.

The weekly close of SPBIO, is shown below.

This index does not provide volume but we’re going to ‘fix’ that by putting in the lower panel, weekly volume for leveraged inverse fund LABD.

It’s clear, as SPBIO reached all-time highs and reversed, short activity via LABD picked up significantly.

However, the past several weeks tells us from a Wyckoff perspective, something major could be about to happen.

As SPBIO, has moved counter-trend higher, activity going short (via LABD) has gone off the scale.

Spring-To-Up-Thrust

If the unprecedented volume activity weren’t enough to draw attention, we also have a repeating set-up that’s well, repeating; Spring-to-Up-Thrust.

With the idea originally obtained from the late Daivd Weis, later confirmed time and again, it’s a unique (high probability) characteristic of market behavior.

That’s where we are now.

SPBIO: Up Close & Technical

It may be hard to see in the above chart.

The next one, moves closer-in.

The upward advance of SPBIO slowed dramatically last week, closing up just +1.68%, for the week.

Contrast that move with the week prior at +13.83%, and the slowdown is evident.

All Hands, On Deck

Figuratively speaking, everything’s been dropped to focus exclusively on this sector. It’s obvious, what’s going on at this juncture is unprecedented.

That goes for the rest of the markets as well.

However, this sector alone, is telling us to ‘look here’; potentially setting up for a major reversal.

Stay Tuned

Charts by StockCharts

Note:  Posts on this site are for education purposes only.  They provide one firm’s insight on the markets.  Not investment advice.  See additional disclaimer here.

The Danger Point®, trade mark: No. 6,505,279

‘Follow The Money’

Well, Almost … Now, It’s ‘Follow The Volume’

‘Follow the money’ was the clue back in the days of the Watergate scandal.

To unravel the secrets of the break-in, you had to follow the money trail.

Not much has changed since then; except this time around it’s important to look at the volume as well.

The 3X Inverse List

Compiled below, is a list of triple-leveraged inverse funds.

Only one (in bold) has recently posted record breaking volume day after day and week after week.

BNKD, DRV, EDZ, FAZ, LABD, SMDD, SOXS, SPXS, TMV, TZA, WEBS, YANG

From a Wyckoff analysis standpoint and from the volume itself, LABD is clamoring for attention.

The daily chart shows us volume is off the scale.

Biotech SPBIO, 3X Leveraged Inverse LABD, Daily

No other leveraged inverse fund’s chart (in the above list) has this look.

Somebody, Always Knows ‘Something

Wyckoff wrote back in the day, ‘insiders’ can’t leave well enough alone; their greed is too great to keep under control.

They take their information and act accordingly.

Our job is to look for those actions, decipher them, and then ourselves, act accordingly.

Who Could It Be Now?

So, what could it be that would cause ‘insiders’ (and professional speculators) to focus nearly exclusively on biotech and go short the sector.

Hmmm, just what could it be?

Well, the mainstream media doesn’t seem to have a clue either. It’s all a big ‘mystery’ to them (although cracks are appearing).

It’s The ‘What’ … Not The ‘Why’

Both Livermore and Wyckoff admonished us not to focus on the why of market movements. The ‘why’ will always come out later, after the fact.

They were concerned with ‘what’ is happening; is price moving up, down, or going sideways in accumulation.

Summary

There’s no mistake based on the chart of LABD above, something major, potentially long-term, is setting-up in the biotech (SPBIO) sector.

The chart itself tells us to focus specifically on this area (not advice not a recommendation).

With that, we’re about mid-way through today’s session.

Price action appears to be going through a test of yesterday’s reversal.

Stay Tuned

Charts by StockCharts

Note:  Posts on this site are for education purposes only.  They provide one firm’s insight on the markets.  Not investment advice.  See additional disclaimer here.

The Danger Point®, trade mark: No. 6,505,279