The Market Set-Up … This Week

What To Watch … Crypto Collapse, Biotech, Gold, Telsa

JPMorgan … says sell

Goldman … says buy.

Wyckoff says … Don’t listen to either.

In fact, Wyckoff’s stock market training course, first published in 1934, (still available), says that until you can ignore the financial press completely, ‘You will never be successful in the markets’.

Price action itself, properly interpreted, will tell you where to look for the opportunity.

The Ponzi Implosion, Cometh

The market is littered with Ponzi schemes. Some have already imploded, CVNA, HOOD, Crypto; some have not.

Concerning Crypto, here’s an excellent update from Michael Cowan. Buried in that update, at time stamp 4:58, looks like HOOD, may be in even more trouble.

Biotech is in a class of its own and was discussed in yesterday’s update.

For gold, we’re going to look at the Junior Miners GDXJ, and last week’s action.

Junior Miners GDXJ, Daily Close

The Junior’s are the weakest in the sector; therefore, that’s where we look for a short opportunity (not advice, not a recommendation).

To move higher, above resistance, normal market behavior, is to come back to the lower blue line (i.e., support) to gain enough energy to move higher for a breakout.

To move lower, normal market behavior, is to come down to the lower blue line as a test which subsequently fails; the move continues lower.

Either way, normal behavior at this juncture, is to move lower. We’ll see.

Now on to the chief cook and bottle washer … Tesla.

Tesla (TSLA), At The Edge

For starters, let’s recognize there’re a lot of moving parts; U.S. ‘parts’ and China ‘parts’.

If one’s going short, another task is to forecast under what conditions a short would have enough risk removed.

For that answer, oddly enough, we go to gold, GLD.

Gold GLD, Weekly: 2015 – 2017

GLD posted a massive upthrust above the blue line lasting over fourteen weeks before breaking decisively lower.

Then, it labored four weeks to come back up for a test.

After that, collapse; lower weekly closes for seven consecutive weeks.

In the chart above, the area identified as ‘Short’, has as much upside risk removed as possible, right at resistance.

Now on to Tesla.

Tesla TLSA, Weekly

Two scenarios are presented where risk may be reduced.

Chart 1
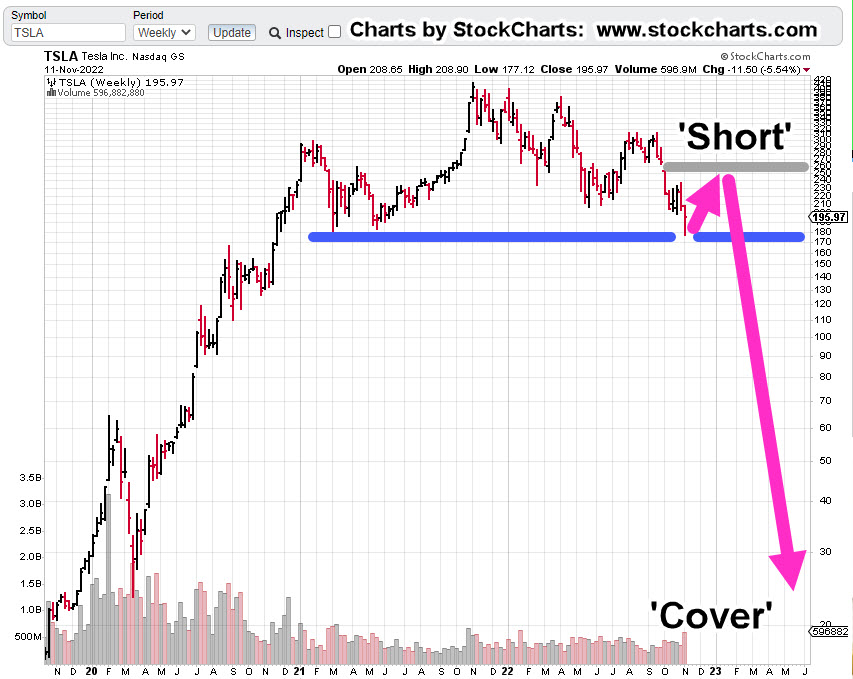
Chart 2
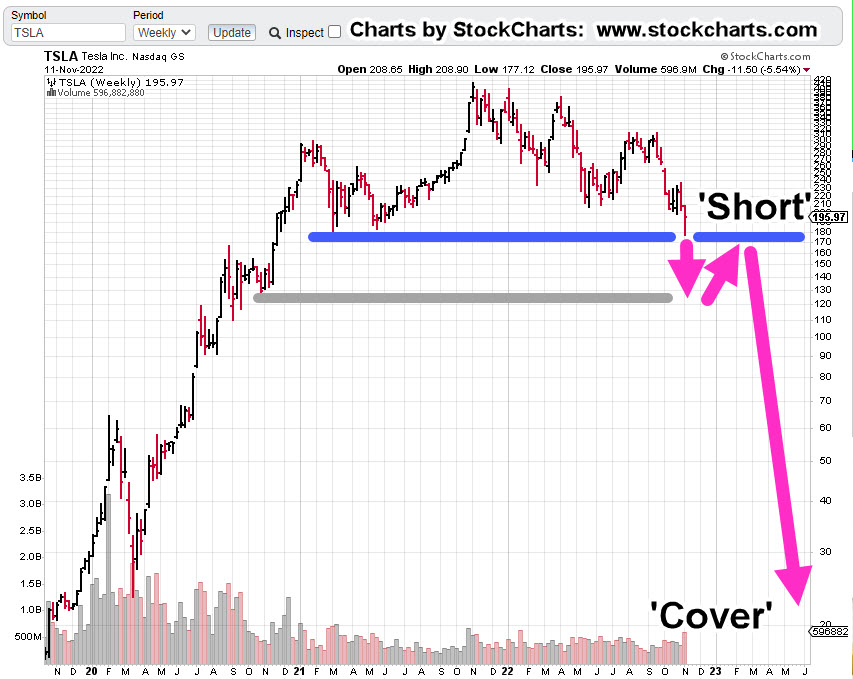
One of these may happen or neither of them.

Either way, for risk to be reduced, a short entry is needed to be at a known resistance level (not advice, not a recommendation).

Let’s move on to the current positioning.

Positions: (courtesy only, not advice).

One of three events will happen at the next session.

1: Both positions stopped out

2: One position stopped out

3: No positions stopped out

Each outcome will provide a data-point where to focus (or not) in the current environment.

LABD-22-10:

Entry @ 18.1398: Stop @ 16.83

JDST-22-05

Entry @ 9.1666: Stop @ 8.79

Note: Positions may be increased, decreased, entered, or exited at any time.

***, Indicates change

Stay Tuned

Charts by StockCharts

Note:  Posts on this site are for education purposes only.  They provide one firm’s insight on the markets.  Not investment advice.  See additional disclaimer here.

The Danger Point®, trade mark: No. 6,505,279

The Largest ‘Squeeze’, Ever

A Market Of Extremes

So, this is how it’s going to be.

The market itself is telling us it’s not going to be ‘well behaved’, possibly for years to come.

According to Goldman, link here, we’ve just had the largest short squeeze on record.

Friday, must have pushed it over the edge from the previously reported, ‘third largest‘.

The ‘Pontificators’

Everybody think’s they’ve got it figured out; We’re going to have stagflation, no wait, hyperinflation, no wait, inflation/deflation simultaneously, no wait, dollar collapse, no wait, gold to the moon, no wait, and on it goes.

What we really have, which is obvious to those ‘awake‘, is something that’s never happened before.

That ‘something‘ is here every day, multiple times a day.

Flash Crash, 2010

Every so often just as a reminder, this event is posted as an example; until that day, it never happened before either.

“Paper comes in, a big seller!!!”

 ‘Paper’ is essentially anyone (banks, hedge-funds, institutions, and/or retail) outside the pit.  Those in the pit are called ‘locals’.

Positioned At The Extreme

The largest short squeeze in history has actually performed a public service; the markets are at extremes.

With that, the short position in Junior Miners GDXJ, has already been discussed, link here.

We’re going to move on and talk about the elephant; more specifically, biotech SPBIO.

Biotech SPBIO

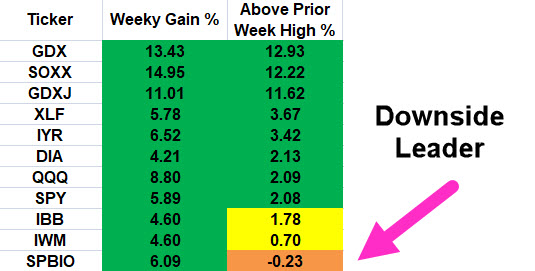
The table shows last week’s action when compared to the week prior. All major sectors had solid gains but it’s the right-most column that’s of interest.

The right-side column shows how far price action closed above the prior week’s high.

Once again, biotech shows overall weakness. It gets more interesting when looking at the weekly chart.

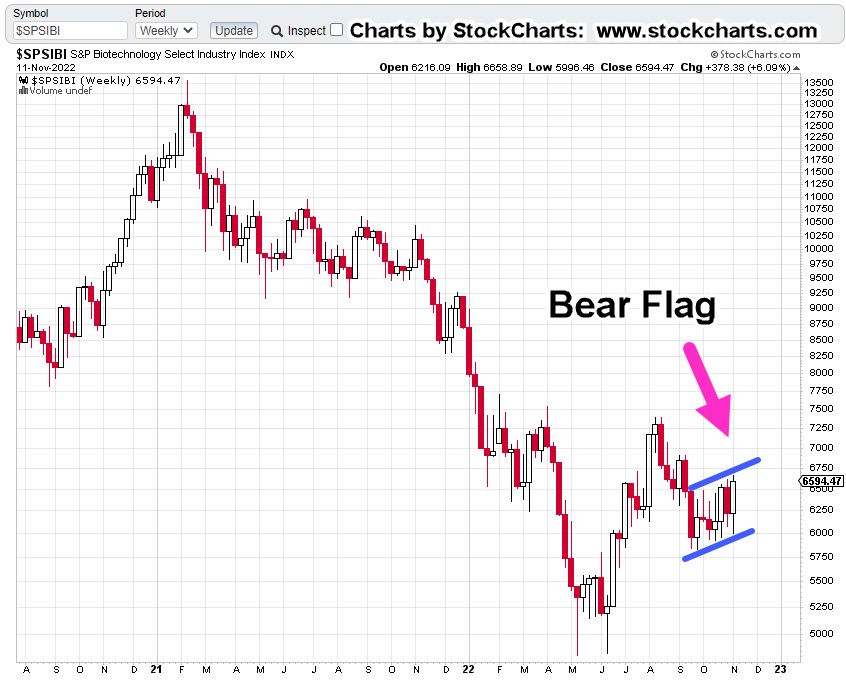
Biotech SPBIO, Weekly

It’s been three successive weeks of apparent up-thrust reversals that were negated each time.

Looking at the weekly below, what we have, is a huge bear flag that just so happens to be, Fibonacci 8-Weeks wide.

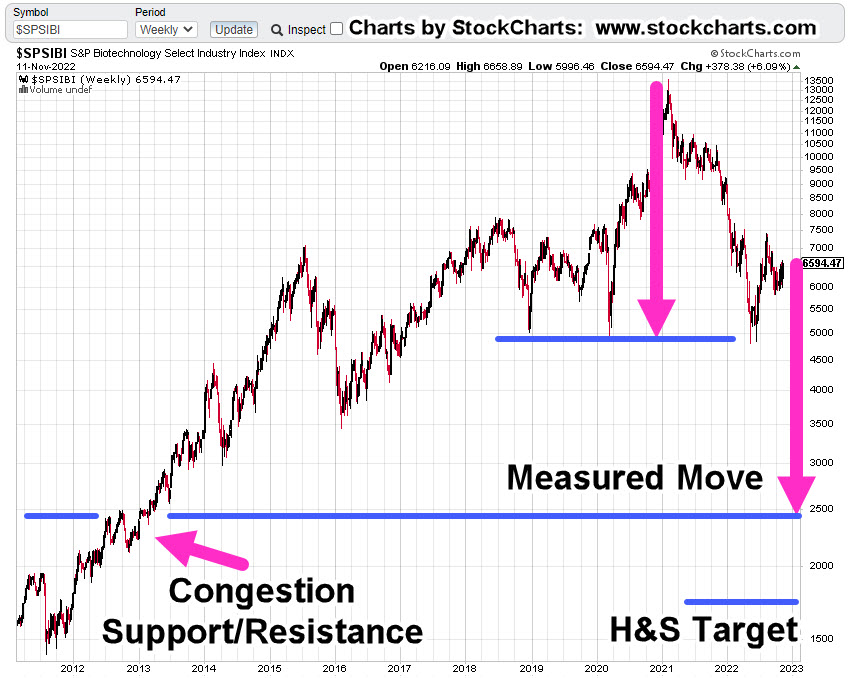
It’s possible, this congestion area is the mid-point of the overall move from the highs set during the week of February, 2021.

Compressing the chart and putting in a measured move target gives us the following.

If we have an actual Head & Shoulders top, that target is shown as well.

Either way, the downside potential is enormous; thus, requiring intense focus from a Wyckoff standpoint, i.e., during a bear market, identify the weakest sector for short opportunities (not advice, not a recommendation).

All of which brings us to positioning.

Positioning

On Friday, a discretionary exit was made from the entire LABD-22-09 position as (LABD) price action continued to decline with no end in sight.

Loss on the LABD-22-09, series was a drubbing of -12.2%

Then again, last week was the largest squeeze in history; taking that into account, the loss wasn’t -30% or -50%.

As the trading day progressed, LABD price action continued lower until low-and-behold, it reversed.

Once again, a position was entered (not advice, not a recommendation) but this time was different. Frist off, initial position size is smaller; about 60% smaller.

Secondly, the stop is an actual order that’s in the market (shown below).

Sounds obvious but we’re dealing with unprecedented times and market disruptions. Recall during the Flash-Crash of 2010, Kimberly Clark, or Colgate (if memory serves) went ‘no-bid’ and printed i.e., sold for 0.01.

That low print remained on the charts for years until it was ultimately removed.

If it can happen on the downside (i.e. when long), it can happen on the upside as well (when short).

Positions: (courtesy only, not advice).

LABD-22-10***:

Entry @ 18.1398***: Stop @ 16.83***

JDST-22-05***

Entry @ 9.1666***: Stop @ 8.79***

Note: Positions may be increased, decreased, entered, or exited at any time.

***, Indicates change

Stay Tuned

Charts by StockCharts

Note:  Posts on this site are for education purposes only.  They provide one firm’s insight on the markets.  Not investment advice.  See additional disclaimer here.

The Danger Point®, trade mark: No. 6,505,279
Gold Leaves The Station … Again

How Many Times?

How many times does gold need to ‘leave the station‘, before it’s actually left?

That’s probably a better question to ask rather than freaking out every time there’s a blip higher.

Was the recent ‘blip’ tradeable? Yes.

Is the move sustainable to the upside … probably not but only price action will tell.

Did Wyckoff analysis give advance notice that gold (GLD), could move higher?

Yes, it did … link here and here.

That first link even shows how far GLD, is likely to go, which at this point, is just ticks away.

Gold GLD, Daily

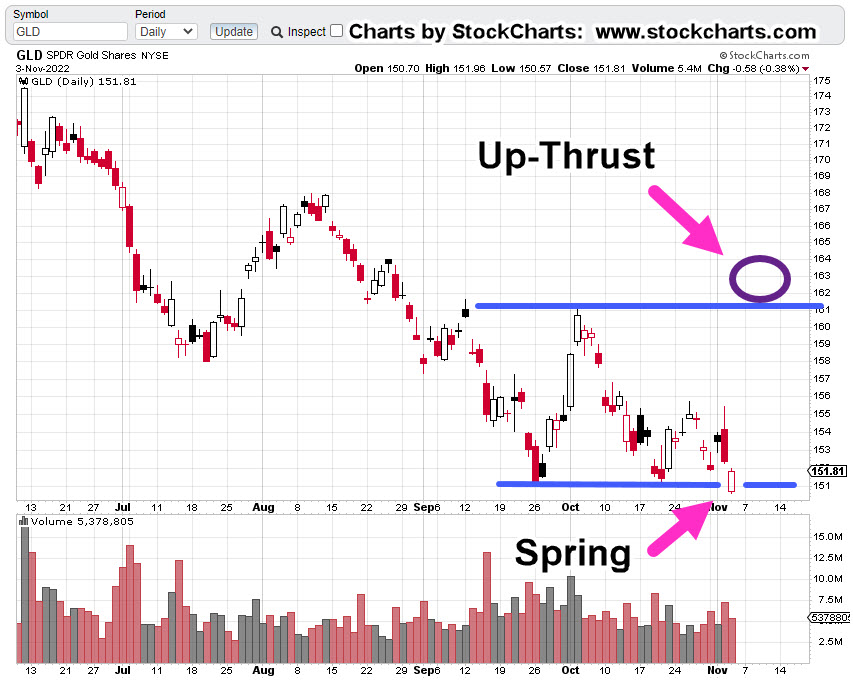
We’ll start first with the original forecast.

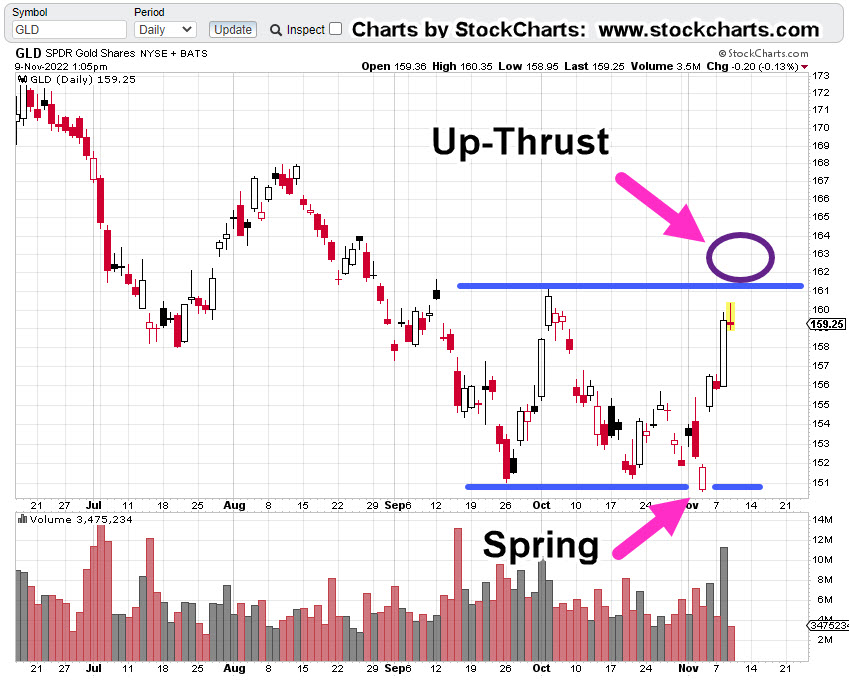
And the result (as of 1:20 p.m., EST).

We can see price action nearing the up-thrust (reversal) location.

Note: Penetration to the upside above resistance, does not necessarily mean it’s a short opportunity.

Any opportunity will be determined by price action itself.

Summary

Wyckoff analysis not only can provide potentials for price movement; when that move happens, it can also be a stabilizing factor so that one is not caught up in the usual media hysteria.

Meanwhile, back at the ranch, biotech sector (SPBIO) is still on track (ever so slowly) for a potential sustained move to the downside (not advice, not a recommendation).

Positions, Market Stance (courtesy only, not advice).

LABD-22-09:

Special Note:

This sector and leveraged inverse LABD are highly volatile. Character of the market can change at any time.

LABD may be exited without notice.

Entry @ 19.88, 19.71, 21.23, 21.65, 22.16, 22.75*** Stop @ 20.21

Note: Positions may be increased, decreased, entered, or exited at any time.

***, Indicates change

Stay Tuned

Charts by StockCharts

Note:  Posts on this site are for education purposes only.  They provide one firm’s insight on the markets.  Not investment advice.  See additional disclaimer here.

The Danger Point®, trade mark: No. 6,505,279
‘No One In Control … ‘

Um, Yes There Is …

The latest from ZeroHedge is, ‘there’s no one in control.’

The latest from Wyckoff analysis is, ‘price action’s in control’, if you know where to look. 🙂

This week’s watch-list was laid out two days ago, here and so far, all topics discussed, are preforming as expected.

For this update (30-minutes before open) we’re going to focus on Tesla (TSLA).

Tesla, TSLA, Daily

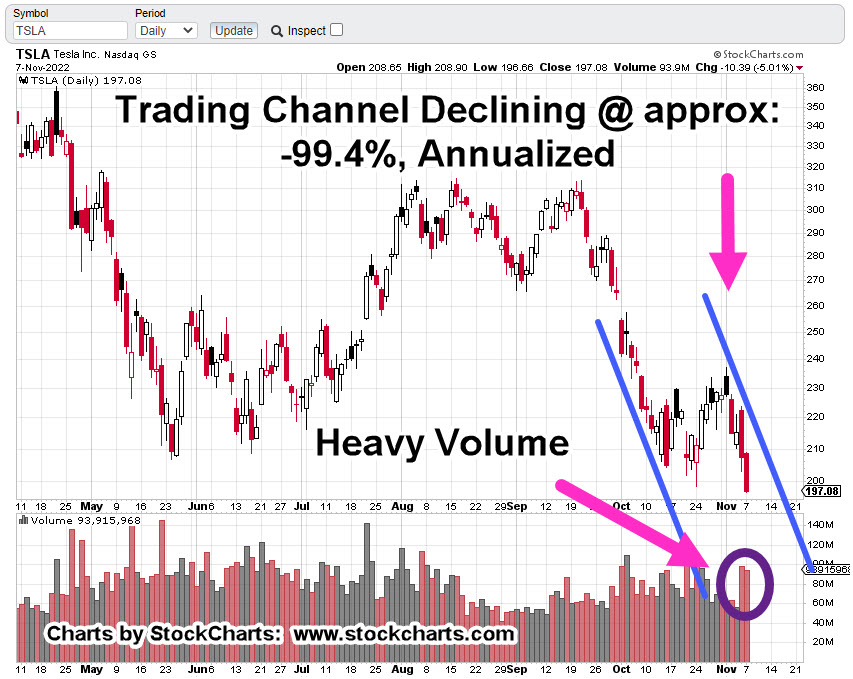
There’s a lot going on.

We’re not in the ‘free-fall’ zone yet, but it’s getting close.

Downside volume has increased significantly.

The channel is being confirmed but we’re nearing support in the 188.00 – area (not shown).

Remember, when price action declines below known support levels, depending on the depth of penetration, we could be in Wyckoff spring position.

There could be an upside response to the break below current support located at approx. 198 – 200.

Summary

Q: Is TLSA, a short?

A: That’s at the trader’s discretion (not advice, not a recommendation).

My firm’s accounts do not have a position in TSLA … and if/when they do, it would likely be small.

It’s true the EV hysteria is a bubble. Supply chain collpase will make sure of that.

However, it does not even compare to the ‘elephant’, and we all know what that is.

Positions, Market Stance (courtesy only, not advice).

LABD-22-09:

Special Note:

This sector and leveraged inverse LABD are highly volatile. Character of the market can change at any time.

LABD may be exited without notice.

Entry @ 19.88, 19.71, 21.23, 21.65, 22.16*** Stop @ 20.21***

Note: Positions may be increased, decreased, entered, or exited at any time.

***, Indicates change

Stay Tuned

Charts by StockCharts

Note:  Posts on this site are for education purposes only.  They provide one firm’s insight on the markets.  Not investment advice.  See additional disclaimer here.

The Danger Point®, trade mark: No. 6,505,279
Gold, Set To Rally

But, How Far ?

The last update on gold (GLD), posted four trading days ago, (link here), said the following:

“If there’s going to be a break to the upside, this would be the place; otherwise, watch for continued GLD downside.”

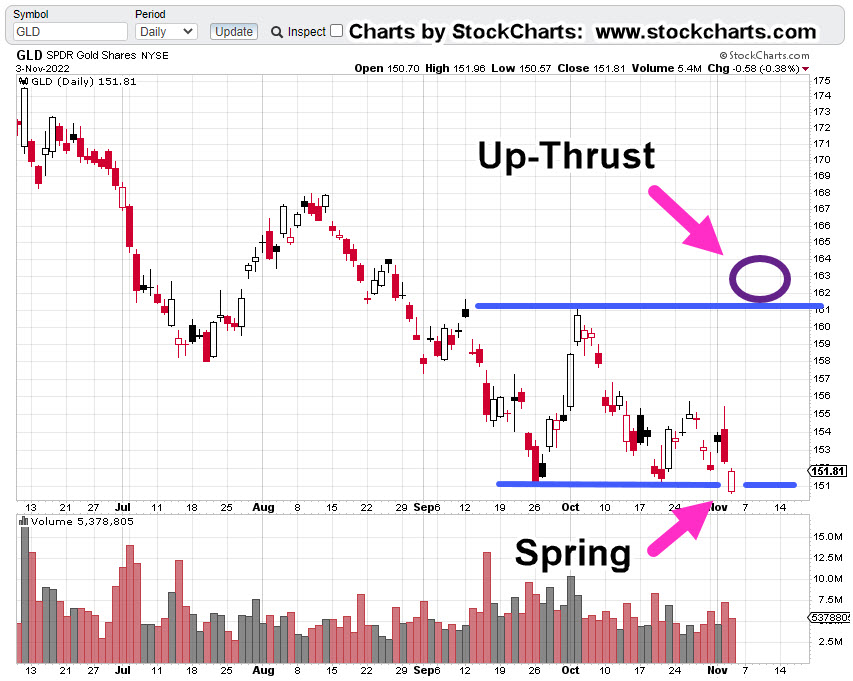
From that update, GLD continued slightly lower, posted a new monthly low (yesterday) and got itself into Wyckoff ‘spring’ position.

Now, in the pre-market (as of 8:41 a.m., EST), we see GLD, trading up approximately 2.1-points, or + 1.40%.

Let’s see where price action’s likely to go.

Gold (GLD), Daily

Spring set-ups have a tendency to go straight into an up-thrust as a repeating pattern.

The most likely point for an up-thrust, if GLD rallies from here, is shown below.

The up-thrust target is also a Fibonacci 23.6%, retrace level from the ‘Changing of Hands‘ high, set March 8th, this year.

If there is a rally, it’s potentially a temporary (but tradeable) upside event in an overall down market (not advice, not a recommendation).

Positions, Market Stance (courtesy only, not advice).

Over the past few trading days, changes have been made as shown (not advice, not a recommendation)

TMF-22-01:

Discretionary exit @ 6.85***

Trade Closed

Gain on TMF-22-01: + 4.67%

LABD-22-09:

Entry @ 19.88, 19.71, 21.23*** Stop @ 18.69

Note: Positions may be increased, decreased, entered, or exited at any time.

***, Indicates change

Stay Tuned

Charts by StockCharts

Note:  Posts on this site are for education purposes only.  They provide one firm’s insight on the markets.  Not investment advice.  See additional disclaimer here.

The Danger Point®, trade mark: No. 6,505,279

The Market Set-Up … This Week

What To Watch … Bonds, Gold, Real Estate, Tesla

Bonds:

Last Friday, the bond reversal posted a shallow retrace.

We’re looking for upside follow-through at the next session.

Gold:

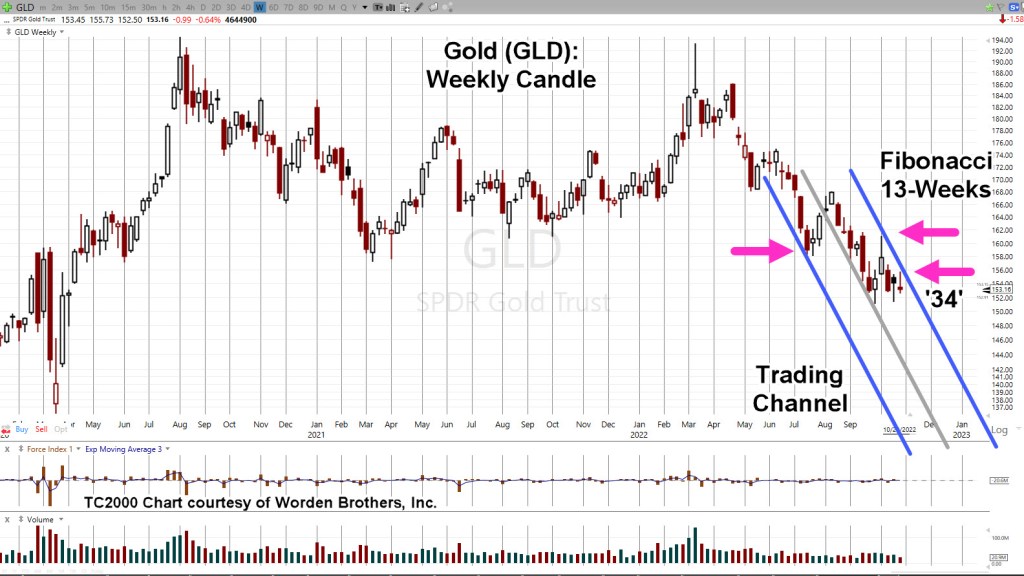
If gold (GLD) closes below 154.67, on Monday, it will be seven consecutive down months.

Momentum has slowed to a potential inflection point.

Real Estate:

If bonds move higher, real estate may follow. We have potential targets and Fibonacci timeframes.

Tesla:

This update, said to watch if/when TLSA, broke below support.

It did just that during the following week but now, it’s hesitating.

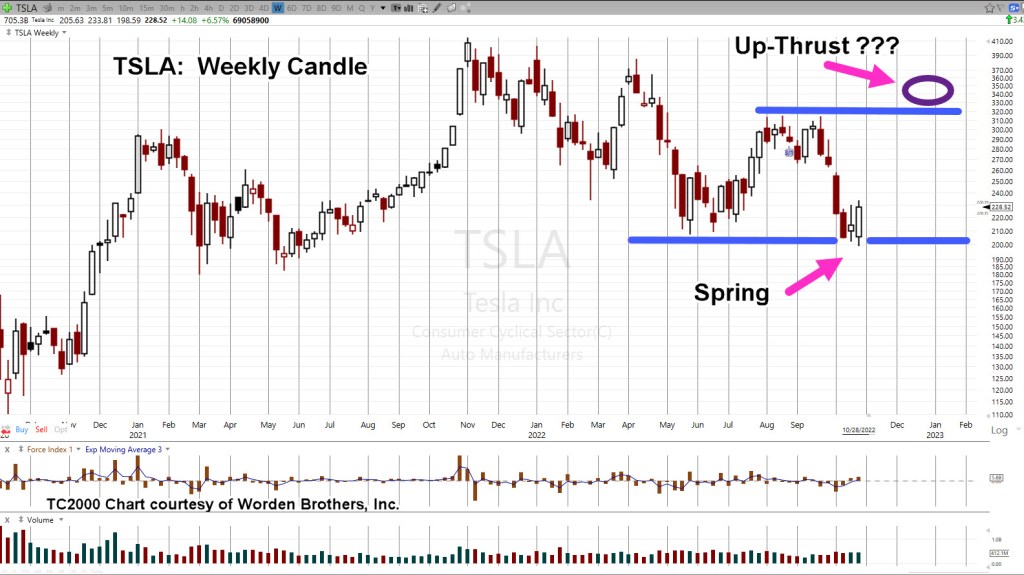
As a result, we have a Wyckoff ‘spring’ set-up.

Now, on to the charts.

Long Bond TLT, 30-minute

We’re drilling down to the 30-minute.

The blue line is Fibonacci 23.6%. Price action (at this point) shows the beginning of a move higher from that level.

Moving decisively higher at the next session, puts the terminating wedge into play, shown here.

If we get a wedge breakout, then we have a measured move target in the vicinity of TLT, 115.00.

Gold (GLD) Weekly Chart

A close below 154.67, on Monday, would put GLD, at seven consecutive down months.

GLD, has never closed lower seven consecutive months; not since inception, on 11/18/04.

Gold remains in a down-channel that’s a Fibonacci 13-Weeks wide.

Last week’s move helped to re-confirm the channel.

That action is itself, a Fibonacci 34-Weeks from the ‘changing of hands‘ high, during week-ending, 3/11/22.

However, momentum of price action has slowed.

If there’s going to be a break to the upside, this would be the place; otherwise, watch for continued GLD downside.

Real Estate IYR, Weekly

If bonds continue their upside reversal with rates lower, we can expect real estate IYR, to have some type of ‘dead cat’ bounce.

If so, how long and how high.

An infinite number of scenarios are possible. However, the chart of IYR, shows what to expect for two of those possibilities.

Real Estate IYR, Weekly

The uptrend (blue line) has been decisively broken. What has not yet happened, is a ‘test’ of that break.

Shown are potential tests; Week 8 (from 10/14/22, lows), at Fibonacci 38%, and Week 13, at 50%.

Between ‘Week 8’ and ‘Week 13’, is the December Fed meeting … a possible catalyst.

Tesla (TSLA) Weekly

This one seems a bit far-fetched but here it is, anyway.

If bonds rally, the rest of the market may also rally; that could include our chief cook and bottle washer, Tesla.

Price action bounced at support and penetrated it several times before printing outside-up on the weekly (twice).

By definition, it’s a Wyckoff spring set-up.

A spring tends to go straight into an up-thrust; a repeating pattern, shown on the chart at around TSLA, 315.

Set-ups can also fail … so, we’ll be watching this one closely.

Stay Tuned

Charts by StockCharts

Note:  Posts on this site are for education purposes only.  They provide one firm’s insight on the markets.  Not investment advice.  See additional disclaimer here.

The Danger Point®, trade mark: No. 6,505,279
Bond Reversal

‘The Market Is A Tyrant’ … Wyckoff, 1910

This update, posted over the weekend, showed potential bond capitulation, set-up for reversal.

Wyckoff’s admonition (above quote) from his book Studies In Tape Reading, meant, the market dictates our actions.

Our job is to do what the market is telling us.

If we look at charts of TLT, and leveraged fund TMF, at this point (11:30 a.m., EST), it’s an obvious reversal.

Bonds TLT, Daily

We won’t know for sure if it’s an island gap, until the following sessions.

One indicator of potential (sustained) reversal is the leveraged bond fund TMF.

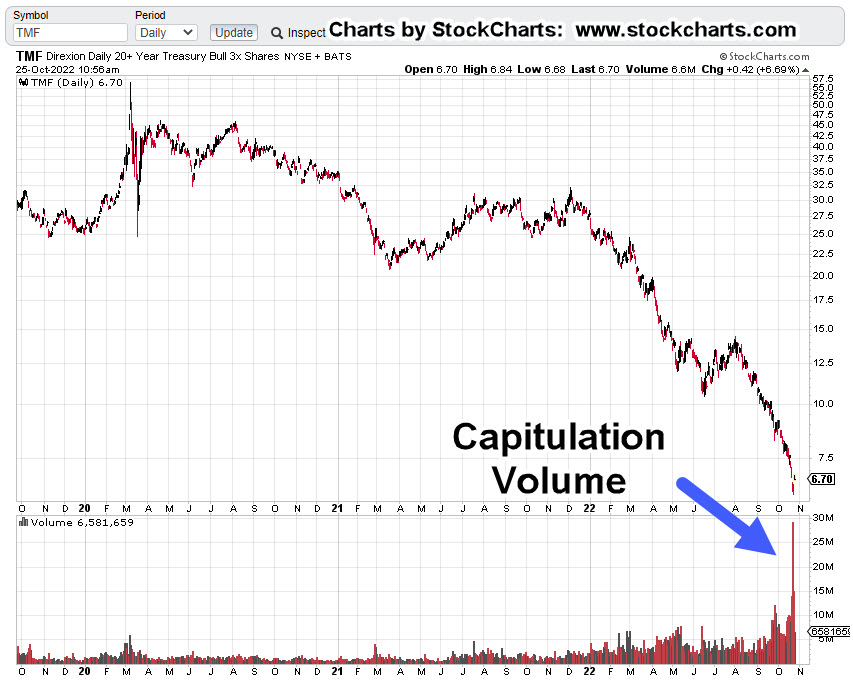
If we compress the daily chart, capitulation volume is clear.

Last Friday’s volume (29.1-million shares) was the highest by far, since the fund started in mid-April of 2009.

Bonds 3X Leveraged Bull, TMF, Daily

Trade or not?

It’s the trader’s discretion; with it being hard to imagine who wants U.S. Bonds.

However, as Steven Van Metre presents in this update, (time stamp, 3:30), foreign investors are interested.

With that, a long position has been opened at TMF 6.705 (TMF-22-01), with a stop in the vicinity of TMF 6.30.

Stay Tuned

Charts by StockCharts

Note:  Posts on this site are for education purposes only.  They provide one firm’s insight on the markets.  Not investment advice.  See additional disclaimer here.

The Danger Point®, trade mark: No. 6,505,279
After The Close …

Inflection Point

This time, it’s the volume that’s important.

Most of the major indices finished higher today except for the miners, real estate and biotech.

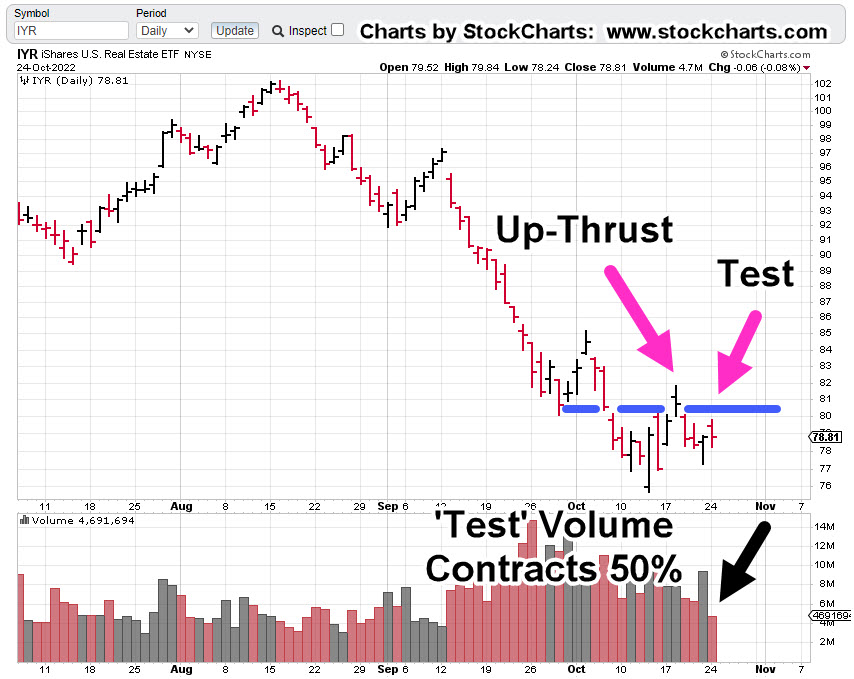
The early session update said IYR, price action may be in a test of its up-thrust (reversal) from October 18th.

If that’s a valid assessment and it was a test, the volume is important.

Whether it’s an up-thrust or a spring, when the set-up gets tested, the volume gives additional clues.

What we’re looking for is when price action comes back to test, volume contracts.

If that happens, it means (with good probability) there’s no commitment to sustain prices at the test level.

Real Estate IYR, Daily

The real estate situation may be about to get interesting.

Volume contraction is near-textbook.

This is one of the rare times, there’s a high probability expectation; that is, IYR price action resumes its downtrend (not advice, not a recommendation).

Stay Tuned

Charts by StockCharts

Note:  Posts on this site are for education purposes only.  They provide one firm’s insight on the markets.  Not investment advice.  See additional disclaimer here.

The Danger Point®, trade mark: No. 6,505,279

The Market Set-Up … This Week

What To Watch … Gold, Bonds, & Real Estate

First off, ‘Goldman‘ says melt-up.

Not to be outdone, we have this ‘me too’ melt-up article as well.

Let’s not forget, all the ‘Fed must do something’ rumors and feigned concern by its members.

If anyone really wants to know the big picture, the overall plan (a wide majority do not), this interview may be the best explanation to-date.

With all of that, we certainly could get some kind of rally in the coming week. We’ll let the price action speak for itself.

As a reminder, Wyckoff analysis does not concern itself with press releases, rumors or ‘fundamentals’; Wyckoff himself, determined based on price action alone, they have no material effect on market movement.

In his words, ‘other forces are at work’, and it’s those forces that interest us.

Gold & Silver

As said in this update, gold (GLD) was just ‘ticks’ away from posting a new monthly low. In fact, it got just 0.24-pts, from a new low before rebounding.

Of course, each time we get any kind of rally in the metals, there’s the usual hysteria. Even though for the past seven months and counting, those rallies occur at lower and lower levels … i.e., a bear market.

Shown below, it’s in a trading channel with price action at the right-side channel line.

Gold (GLD) Weekly

The chart below gets closer-in.

From left-most contact point on the channel to the initial contact on the right side is a Fibonacci 13-weeks.

Also note, the weekly high posted at the center line is a Fibonacci 5-weeks from the left-most contact.

Highly emotional markets tend to adhere to Fibonacci until either the emotion wears off or ‘everybody’ recognizes the structure.

Obviously, to keep the channel intact, a lower open (and lower action) at the next session is needed.

Silver (SLV) has already been discussed in this update and this one.

Bond (TLT) Capitulation ?

Was this past Friday the day?

Gap-down trading on huge volume.

Looking at the daily chart of TLT below, Friday’s level of (down) volume has occurred only three times in the past three years.

Each time, there was a near immediate rebound or in the case of March 2021, the rebound came several weeks later.

Bonds (TLT) Daily

Moving in closer, we see the possibility of an ‘island-gap’ at the next open.

What could drive capital into the bond market?

Well, how about a ‘shock’ or continued market melt-down (not advice, not a recommendation).

A quick check of the local newsfeed (as of 12:45 p.m., EST) shows nothing on the horizon other than usual nuclear attack threats, power outages, child mutilation protests, marauding bears and the disarmament of Canadians.

Nothing to see here …

Real Estate

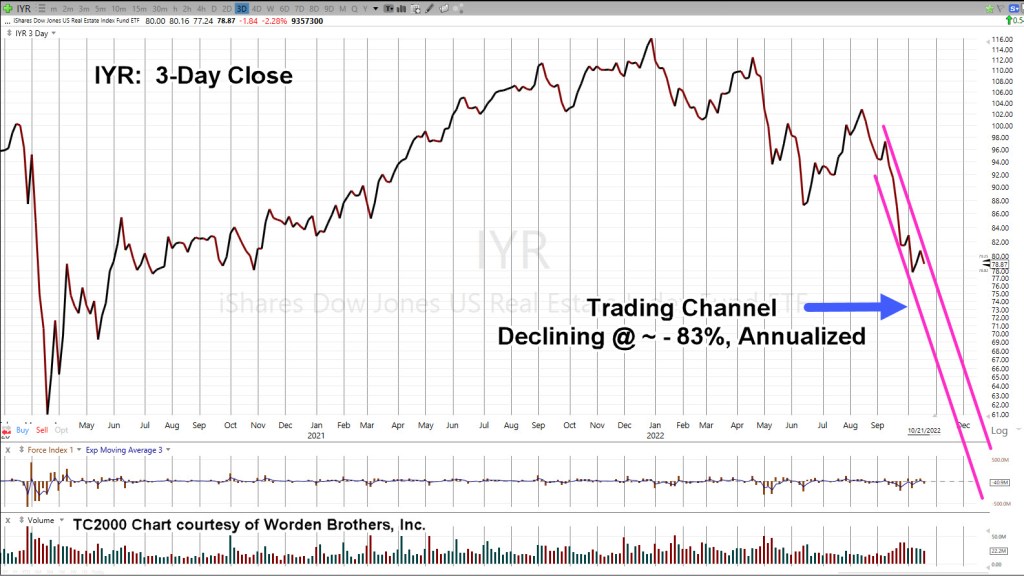
There is no mistake, events in real estate are happening at the fastest pace in recorded history.

As Scott Walters put it, over 10-million people bought into the ‘work from home’ hype and got themselves instantly (nearly) upside down in their transaction.

Now, the layoffs start.

Real Estate IYR, 3-Day Close

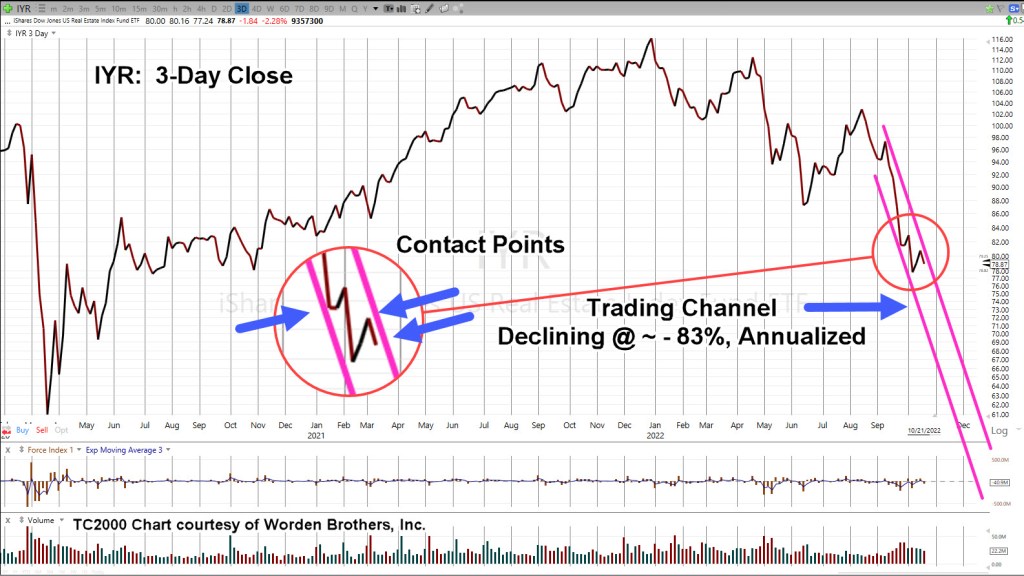
Zoom-in, on the channel

As the last update said, we’ll know soon enough if there is more upside or if last Friday was it, and the downdraft continues.

Stay Tuned

Charts by StockCharts

Note:  Posts on this site are for education purposes only.  They provide one firm’s insight on the markets.  Not investment advice.  See additional disclaimer here.

The Danger Point®, trade mark: No. 6,505,279
Set-Up Details … Real Estate

At A ‘Confluence’

The last update, posted late in the session, said with the upward bias provided by the sizable Op-Ex event, we can look for the weakest (or one of the weakest) sectors.

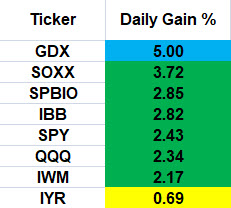
The chart below summarizes yesterday’s action:

Friday 10/21/22, Single Day Gains

Gold miners GDX, is the outlier at the top and real estate IYR, the outlier at the bottom.

Before anybody gets excited about ‘hyperinflation’, just a reminder; silver SLV’s, action has retraced to a weak 38.2% (chart not shown), as it was forecasted to do from last week’s update:

“Silver (SLV) is currently at support levels; therefore, some upward action (staying below SLV: 18.5) is normal behavior.”

Price action is the final arbiter; we’ll see what happens next.

Back to real estate.

Professional Wisdom: ‘The Crash’

We’re going to use the experience and insight provided by Scott Walters concerning the potential for real estate; that is, we’re in a world-wide event the scale of which, no one alive (and possibly, ever) has seen before.

The Economic Ninja has just seconded that opinion (time stamp 3:45) with his quote:

“Right now, we are in the greatest collapse since The Great Depression; and I believe it will be as severe, if not worse, sharper, faster, than what people experienced in 1929”.

So, what would that ‘collapse’ look like on a chart of real estate, IYR?

Ah, yes. That’s the hard part.

To take useful wisdom like that above, and somehow map it into potential market behavior.

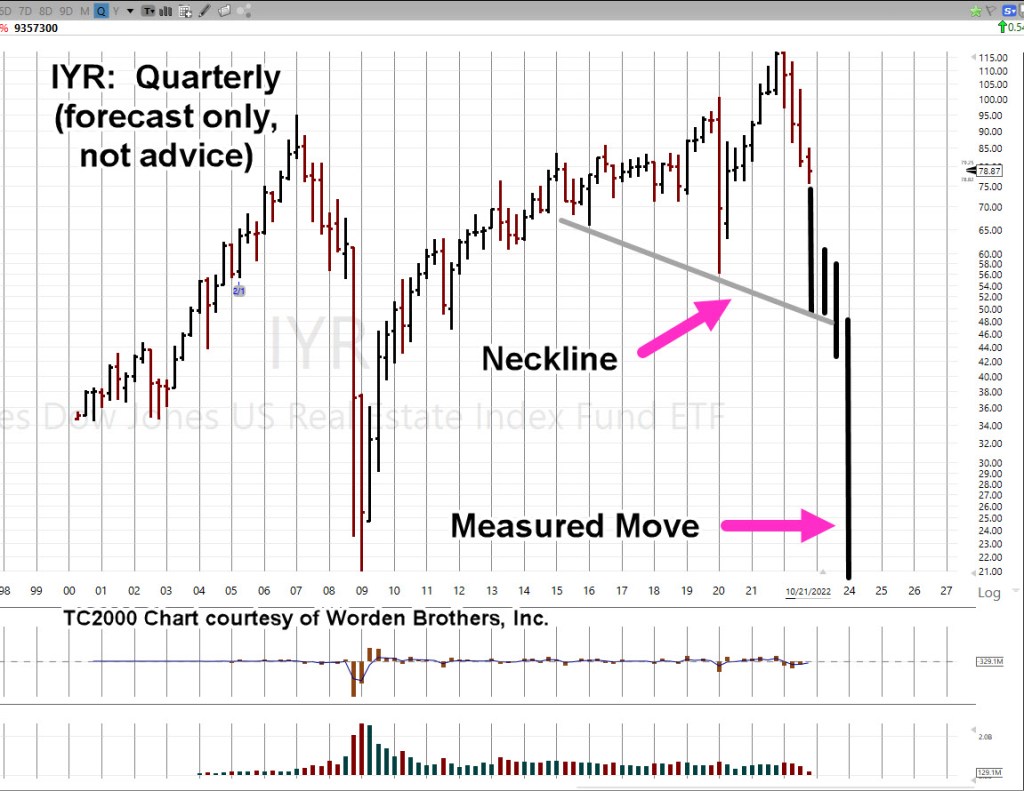
For that, we’re going to use the Quarterly chart of IYR.

Real Estate IYR, Quarterly

There are still two months and one week left to go in the 4th, Quarter.

We’re at a confluence of price action as we’ll cover in the Hourly chart farther down; first, what’s the potential?

Here is one artist’s rendition (not advice, not a recommendation).

That puts it into perspective.

We may know at the very next open, if we’re pivoting higher or continuing the decline.

Butterfly In The Amazon

Of course, the market’s not going to tell anyone its next move. We have to decipher that (read the tape) ourselves.

Sometimes, as Wyckoff said a century ago … ‘It’s as if the weight of a feather is all that’s needed, to push the market further or to reverse.’

So, let’s look at that feather (the butterfly) on the hourly chart.

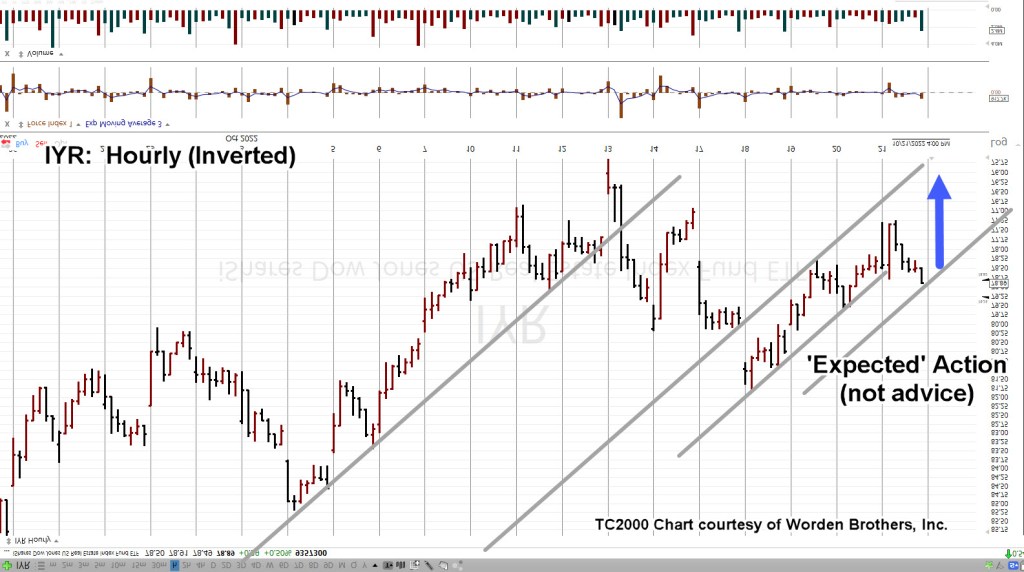
Since we’re positioned short (DRV-22-05), the chart’s inverted to mimic leveraged inverse fund DRV.

Real Estate IYR, Hourly (Inverted)

The important part is we see a repeating pattern of trendlines.

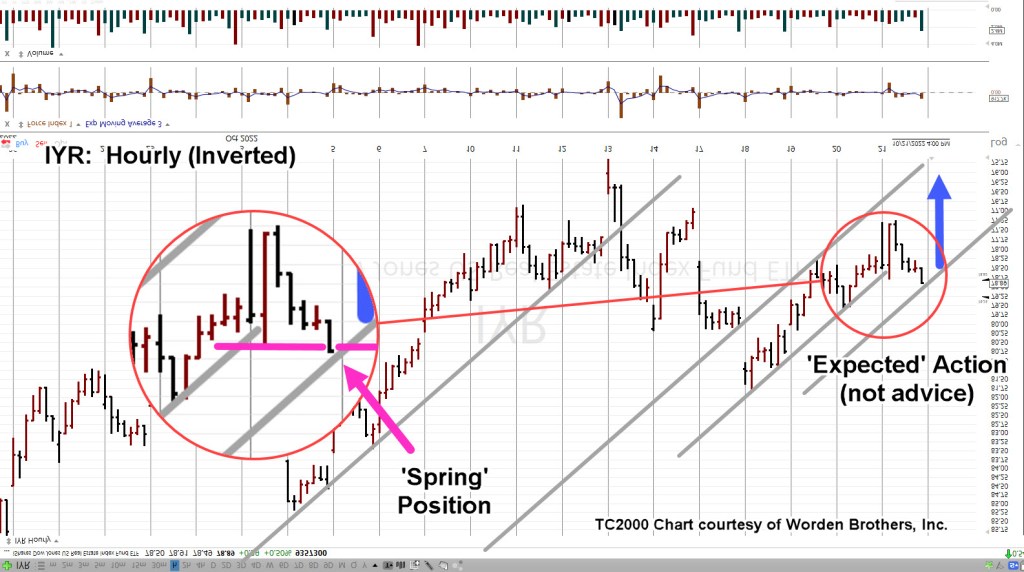
Moving in closer, we have this. The blue arrow is ‘expected’ action based on the analysis up to this point (not advice, not a recommendation).

Moving even closer, the zoom shows IYR, finished the day in Wyckoff spring position; having pushed past minor support (resistance on non-inverted).

Summary

If IYR opens lower or gap-lower, we’ll have to wait and see if it posts a new daily low (below IYR ,77.24).

If that happens, we have some confirmation lower prices are ahead and can then set a definitive stop for DRV-22-05.

Obviously, a higher open (pushing past IYR 78.91), negates the trade.

Stay Tuned

Charts by StockCharts

Note:  Posts on this site are for education purposes only.  They provide one firm’s insight on the markets.  Not investment advice.  See additional disclaimer here.

The Danger Point®, trade mark: No. 6,505,279