Gold’s Downside … Just Starting

Long Term ‘Changing of Hands’

A bearish analysis for gold?

What kind of idiot would think that gold (GLD) is going lower?

Well, for starters, it’s not what one ‘thinks’ that’s important.

Way back, when I was being mentored by the late David Weis, he never started our sessions with ‘what do you think’.

No, he always started by presenting a chart and then asking (and I quote), “What do you see?”

It was never ‘what’s the Fed doing’ or ‘what’s Cramer saying’ (that’s an easy one), or ‘what are earnings’ or any other number of useless, distracting rabbit-holes.

“What do you see?”

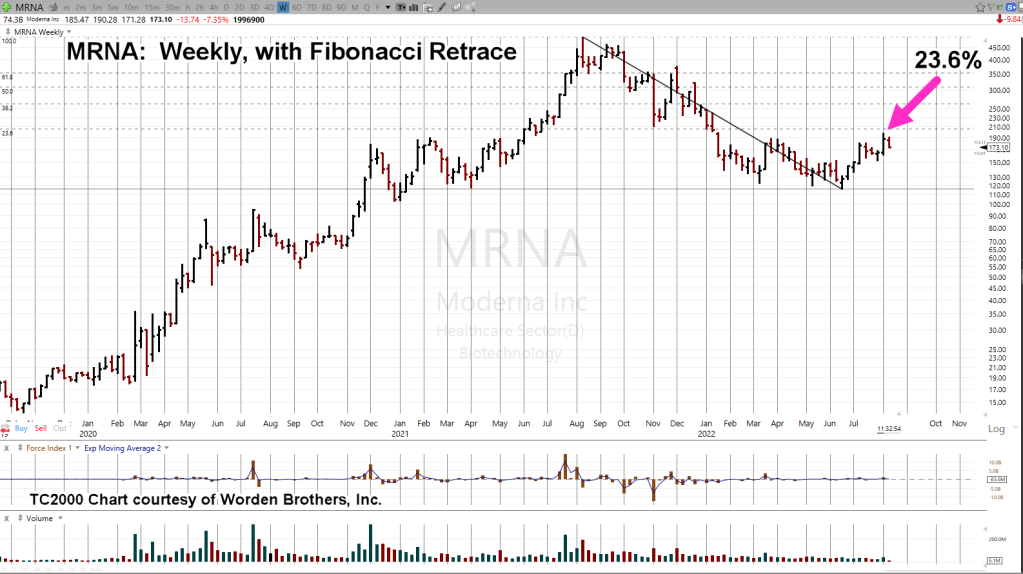
With that, we’re going to look at the long-term chart of gold (GLD) on a weekly close basis.

Gold (GLD) Weekly Close

With the passing days, weeks and now months, we can see there’s been a significant, potentially long-lasting reversal to the downside.

The prior report linked here, contains no fewer than seven other links to gold (GLD) that identified ‘changing of hands’ in various stages as it transpired.

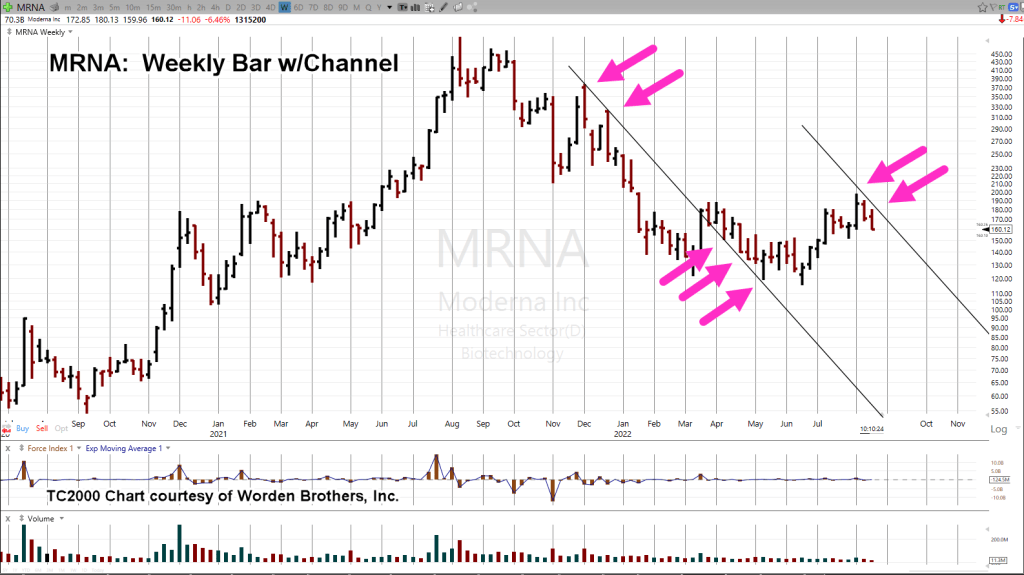
Slow Motion Train-Wreck

So far, events in gold have been moving slowly and thus hypnotizing the gold bulls.

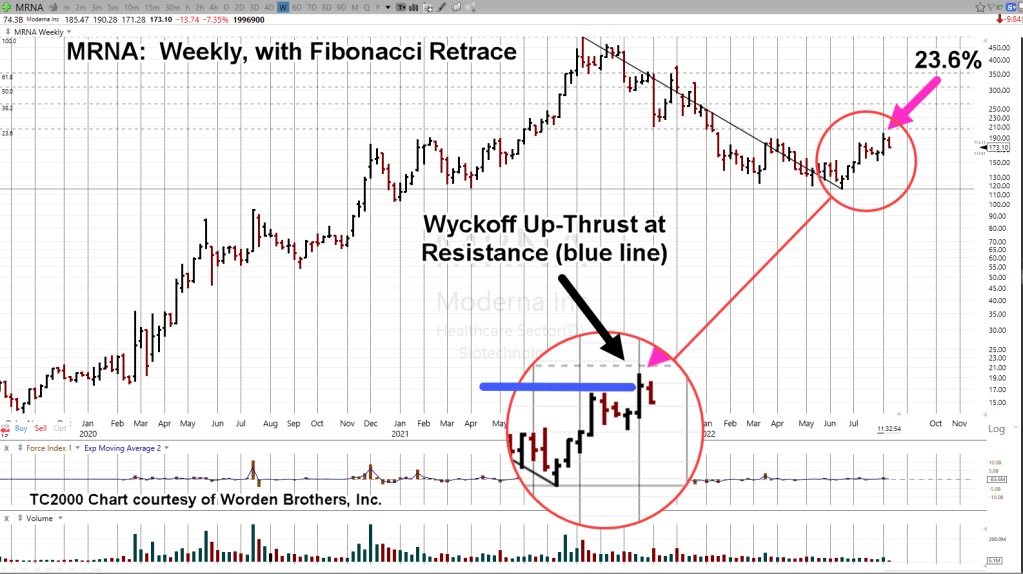
It was nearly two-years (20-months) between the Wyckoff Up-Thrust high (8/6/20), and the test of that high (3/8/22).

Enough time to put everybody to sleep.

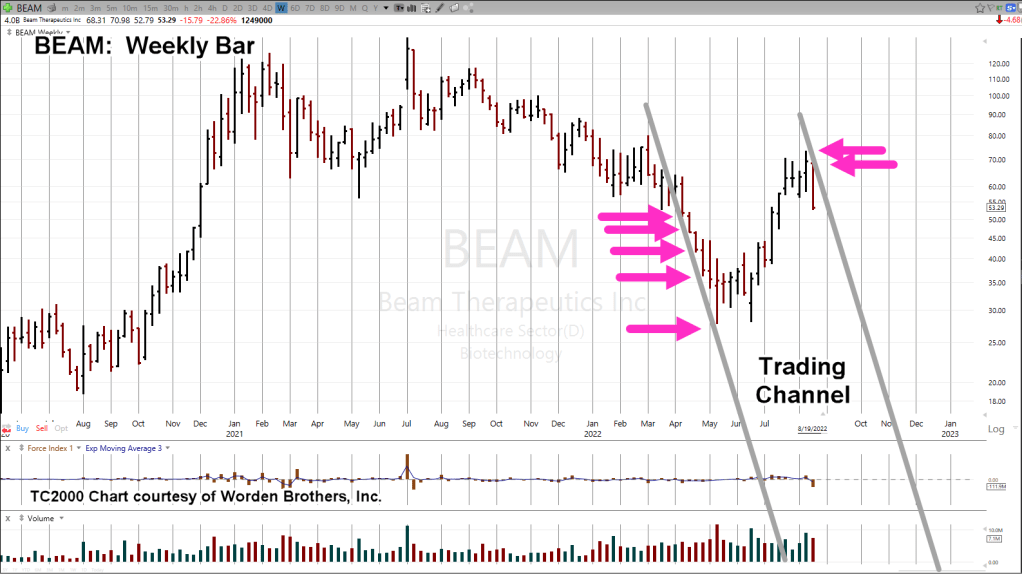
At this point, GLD is back down near support levels … another bounce higher is not unreasonable.

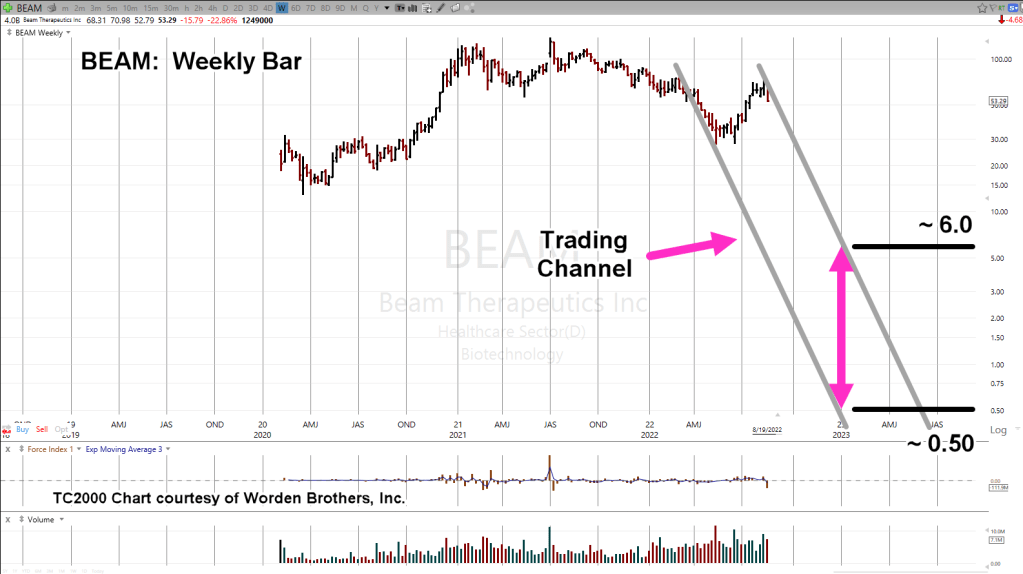
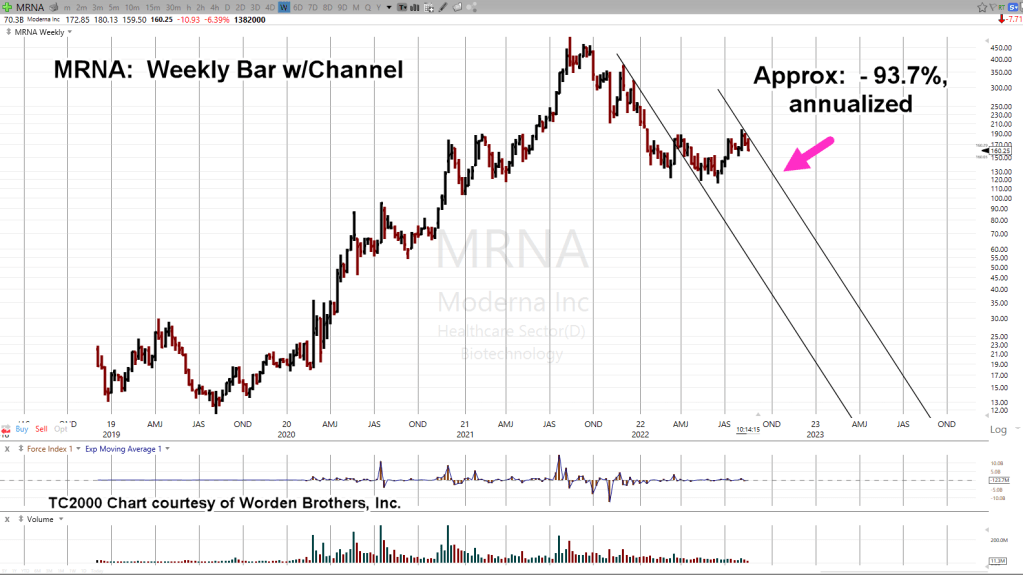
However, it’s trading in a downward channel (not shown) that’s declining at approximately – 30%, annualized.

The above linked report presents long-term downside targets for GLD (not advice, not a recommendation).

The ‘Event’

As Pinball Preparedness puts it, each day that passes brings us one day closer to ‘the event’.

None of us in the proletariat know what the event will be.

It could be an excuse as disconnected as Archduke Ferdinand.

Stay Tuned

Charts by StockCharts

Note:  Posts on this site are for education purposes only.  They provide one firm’s insight on the markets.  Not investment advice.  See additional disclaimer here.

The Danger Point®, trade mark: No. 6,505,279

Three Amigos of Biotech

BEAM, TWST & FATE

It looks like having a real (positive) P/E, may be about to be important.

The prior biotech update said that so far, no P/E, negative P/E, and ‘no money down’ was not affecting the sector.

That is, until now.

Well, ok. I made up the ‘no money down’, part. 🙂

That little jest does not take away from the fact, biotech SPBIO, and its top three weightings, BEAM, TWST and FATE, have all reversed, decisively to the downside.

For the week just ended, BEAM is down – 22.86%, TWST down – 19.18%, and FATE down – 14.16%.

Back at the ranch in the IBB index, Moderna (MRNA) is also down – 14.65% for the week.

So, we have confirmation the entire industry is now continuing its downward course.

Contrast the reversal of index SPBIO, at – 7.04%, with S&P (SPY) at – 1.16%, and the market itself is telling us where to go for opportunity (not advice, not a recommendation).

At this point, all three amigos (BEAM, TWST, FATE) are in downward trading channels.

Trading channel for BEAM is the most aggressive. The weekly chart is below.

Beam Therapeutics (BEAM) Weekly

If BEAM maintains its channel for the rest of this year, the chart below shows the target area(s) for price action.

The coming week may let us know if this channel will be confirmed or negated.

Recall, the S&P is topping out and appears to be reversing.

Goldman says the squeeze is over but that ‘downside is limited’.

We’ll see.

Stay Tuned

Charts by StockCharts

Note:  Posts on this site are for education purposes only.  They provide one firm’s insight on the markets.  Not investment advice.  See additional disclaimer here.

The Danger Point®, trade mark: No. 6,505,279

Silver’s Bull-Fight

Wedge Breakdown, Imminent?

Like a stubborn mule, silver’s just not going along with the ‘hyperinflation’ narrative.

How many years of mainstream ‘breakout’ forecasts, has it been?

‘Silver upside breakout just around the corner’. ‘Silver to launch higher because of inflation’. ‘Silver physical shortage to expose futures manipulation’ … and on.

It’s not happening. Why?

Silver, more so than gold, is an industrial metal. In that sense, more like copper than gold.

That said, silver’s price action alone, tells us (along with copper) we’re in an imploding economy.

Before we get to the charts, let’s review what was said at the last update on silver (emphasis added):

“Since gold (GLD) is in position for an upward test of its wedge breakdown (chart not shown), it’s reasonable to expect another bounce off support for silver.

Using the ‘rule of alternation’, we already had a brief move off the first support level before reversing.

The next contact at lower support, will likely bounce for longer or not at all.

Well, ‘bounce for longer’, is exactly what we got.

The prior bounce from low to high lasted 11-trading days (5/13/22 – 5/27/22). The current bounce lasted nearly twice as long; 20-trading days.

Silver (SLV), Weekly Close

Since the last update, price action bounced off support, confirmed the wedge, tested upside resistance and now, back down to the wedge boundary.

The zoom chart below shows the detail of the resistance test and reversal.

If SLV posts a decisive break below the wedge boundary, standard traditional charting technique provides a downside target in the vicinity of SLV 10.0, or slightly below.

Summary

As always, anything can happen. If silver decides to start posting bullish action, the analysis will be changed.

At this point, with growing fundamentals of economic collapse, i.e., Great Depression 2.0, silver’s price action is fighting the bulls (and winning), thus, confirming the economic decline (not advice not a recommendation).

Stay Tuned

Charts by StockCharts

Note:  Posts on this site are for education purposes only.  They provide one firm’s insight on the markets.  Not investment advice.  See additional disclaimer here.

The Danger Point®, trade mark: No. 6,505,279

The Moderna (MRNA) Channel

Chief Cook & Bottle Washer

We’re about forty minutes into the session; Moderna (MRNA) has just confirmed the up-thrust reversal discussed in the last update.

It took seven trading days for MRNA, to post a new weekly low below 160.06.

That was plenty of time to perform research like finding this bullish outlook and deciding for oneself, whether to be bull or bear.

This update is brief.

Two charts of MRNA, are shown below.

Price action’s in a channel with the right side declining at approx: – 93.7%, annualized.

Moderna MRNA, Weekly Bar

Compressed version.

We’re using MRNA, as the proxy for the biotech sector.

The previous report showed a weak 23.6%, retrace and potential reversal.

With today’s print below 160.06, it looks like an initial confirmation of the right-side trend line (not advice, not a recommendation).

Stay Tuned

Charts by StockCharts

Note:  Posts on this site are for education purposes only.  They provide one firm’s insight on the markets.  Not investment advice.  See additional disclaimer here.

The Danger Point®, trade mark: No. 6,505,279

No P/E ? … No Problem … Yet

Biotech SPBIO, Has No P/E

Is this like Carvana on steroids?

Looking at the top ten components of the SPBIO sector, making up over 14%, of the weighting, none have a P/E ratio.

The three largest weightings are listed below along with hyperlinks to their corporate summaries or research.

Beam Therapeutics Inc.: BEAM

Twist Biosciences Corp.: TWST

Fate Therapeutics Inc.: FATE

The Return on Equity for the list is Negative – 31.9%

With returns like that, it’s unlikely a positive P/E, is showing up anytime soon.

The Market Itself

Livermore worked to prefect his technique, searching for what’s going to happen in a ‘big way’.

Wyckoff discovered the market itself, decides on its next likely course.

Loeb presented the power of ‘focus’; Concentrated positions that eschewed the mediocre mantra of ‘a well-diversified portfolio’.

It’s important to note, Loeb was the former Vice Chairman of E.F. Hutton. The old commercials from the 70s, like the one linked here, were talking about him: ‘When Loeb talks, people listen’.

The Biotech Short

The vultures are circling this sector.

We’ve already shown in the last update, speculative volume on the 3X Inverse fund LABD, is literally off the chart.

The corporate links above, give us a potential ‘why’ for their short positioning.

All three of those companies have a common theme.

Stay Tuned

Charts by StockCharts

Note:  Posts on this site are for education purposes only.  They provide one firm’s insight on the markets.  Not investment advice.  See additional disclaimer here.

The Danger Point®, trade mark: No. 6,505,279

Biotech’s, Jaw-Dropping Volume

Bears Capitulate

According to this, just out on ZeroHedge, that’s what’s happened.

As we’ll see below, there’s certainly something unprecedented going on, specifically in biotech.

The prior update made the argument, biotech SPBIO, has a unique distinction that’s showing up on the leveraged inverse fund LABD, shorting the sector.

For illustration purposes, we’re going to do a little ‘trick’.

The weekly close of SPBIO, is shown below.

This index does not provide volume but we’re going to ‘fix’ that by putting in the lower panel, weekly volume for leveraged inverse fund LABD.

It’s clear, as SPBIO reached all-time highs and reversed, short activity via LABD picked up significantly.

However, the past several weeks tells us from a Wyckoff perspective, something major could be about to happen.

As SPBIO, has moved counter-trend higher, activity going short (via LABD) has gone off the scale.

Spring-To-Up-Thrust

If the unprecedented volume activity weren’t enough to draw attention, we also have a repeating set-up that’s well, repeating; Spring-to-Up-Thrust.

With the idea originally obtained from the late Daivd Weis, later confirmed time and again, it’s a unique (high probability) characteristic of market behavior.

That’s where we are now.

SPBIO: Up Close & Technical

It may be hard to see in the above chart.

The next one, moves closer-in.

The upward advance of SPBIO slowed dramatically last week, closing up just +1.68%, for the week.

Contrast that move with the week prior at +13.83%, and the slowdown is evident.

All Hands, On Deck

Figuratively speaking, everything’s been dropped to focus exclusively on this sector. It’s obvious, what’s going on at this juncture is unprecedented.

That goes for the rest of the markets as well.

However, this sector alone, is telling us to ‘look here’; potentially setting up for a major reversal.

Stay Tuned

Charts by StockCharts

Note:  Posts on this site are for education purposes only.  They provide one firm’s insight on the markets.  Not investment advice.  See additional disclaimer here.

The Danger Point®, trade mark: No. 6,505,279

‘Follow The Money’

Well, Almost … Now, It’s ‘Follow The Volume’

‘Follow the money’ was the clue back in the days of the Watergate scandal.

To unravel the secrets of the break-in, you had to follow the money trail.

Not much has changed since then; except this time around it’s important to look at the volume as well.

The 3X Inverse List

Compiled below, is a list of triple-leveraged inverse funds.

Only one (in bold) has recently posted record breaking volume day after day and week after week.

BNKD, DRV, EDZ, FAZ, LABD, SMDD, SOXS, SPXS, TMV, TZA, WEBS, YANG

From a Wyckoff analysis standpoint and from the volume itself, LABD is clamoring for attention.

The daily chart shows us volume is off the scale.

Biotech SPBIO, 3X Leveraged Inverse LABD, Daily

No other leveraged inverse fund’s chart (in the above list) has this look.

Somebody, Always Knows ‘Something

Wyckoff wrote back in the day, ‘insiders’ can’t leave well enough alone; their greed is too great to keep under control.

They take their information and act accordingly.

Our job is to look for those actions, decipher them, and then ourselves, act accordingly.

Who Could It Be Now?

So, what could it be that would cause ‘insiders’ (and professional speculators) to focus nearly exclusively on biotech and go short the sector.

Hmmm, just what could it be?

Well, the mainstream media doesn’t seem to have a clue either. It’s all a big ‘mystery’ to them (although cracks are appearing).

It’s The ‘What’ … Not The ‘Why’

Both Livermore and Wyckoff admonished us not to focus on the why of market movements. The ‘why’ will always come out later, after the fact.

They were concerned with ‘what’ is happening; is price moving up, down, or going sideways in accumulation.

Summary

There’s no mistake based on the chart of LABD above, something major, potentially long-term, is setting-up in the biotech (SPBIO) sector.

The chart itself tells us to focus specifically on this area (not advice not a recommendation).

With that, we’re about mid-way through today’s session.

Price action appears to be going through a test of yesterday’s reversal.

Stay Tuned

Charts by StockCharts

Note:  Posts on this site are for education purposes only.  They provide one firm’s insight on the markets.  Not investment advice.  See additional disclaimer here.

The Danger Point®, trade mark: No. 6,505,279

The Moderna Reversal

‘Whistling Past The Graveyard’

Moderna (MRNA) appears likely to join the ranks of Carvana (CVNA), with a decline from all-time highs that’s well over -90%.

Even a ‘modest’ projection (as we’ll see below) puts the downside potential for MRNA, far below current levels.

Starting with the weekly chart, MRNA, has just barely retraced upward to an anemic 23.6%, before breaking to the downside.

Moderna MRNA, Weekly Chart

Zoom version below

The Wyckoff up-thrust (reversal), will be confirmed if/when MRNA pushes below last week’s low of 160.06

Projected Decline Over -90%

Unless it’s negated, the weak retrace (23.6%), tells us that MRNA, is probably just getting started to the downside.

Using a modest 1 : 1, projection from current levels, we have MRNA’s downside potential to the 45-area; representing a decline from all-time highs, of approximately -90.9%.

However, for such a weak equity (at this point), the decline also has the possibility to go a bit further, to a 1 : 1.382 projection (shown as the lower arrow).

Declining to the 27-area, would put MRNA, down a stiff -94.6%, from all-time highs.

If MRNA gets to those levels, that’s when the fun starts.

Class Action?

Recall, we’re using the Carvana Crash as the model, right?

Let’s hold that thought and go way back to October 17th, of last year. Reviewing the first bullet item of this post; some of which is repeated below, it said:

“Whenever a high-flyer darling stock changes course and reverses down in a big way, the lawsuits start.

‘Investors’ only know one direction … up.

They figure they’re so smart, any decision from them that does not work out, must be someone else’s fault.

Class Action for Moderna (with discovery) may be dead ahead.

Let’s start our stopwatch and see how long it takes for the first ‘Notice’.”

Getting back to Carvana (CVNA), it posted recent lows on July 14th this year. That was a decline (from all-time highs) of -95%.

Three weeks after that low, and just days ago on August 4th, we get ‘Notice of Class Action‘.

Tick, Tock …

Stay Tuned

Charts by StockCharts

Note:  Posts on this site are for education purposes only.  They provide one firm’s insight on the markets.  Not investment advice.  See additional disclaimer here.

The Danger Point®, trade mark: No. 6,505,279

The Big Move & The Big Money

Common Characteristics

Everyone talks a big game, wanting to trade like the next Jesse Livermore or James R. Keene.

To aspire and reach the performance level of the legendary, few know, it’s almost a requirement that several fortunes must be won and lost along the way.

That’s why Prechter said it years ago (paraphrasing), ‘It’s best to lose your first fortunes early; that way, you have time to recover.’

One very public and famous ‘recovery’ from a blown account, was Livermore’s trade during The Panic of 1907.

He was flat broke but sensed a big down move about to happen in the markets.

Legend has it, he pawned his car for $5,000; then, using that capital, shorted the market during the panic and profited over $1 million, covering shorts near the bottom.

That was then. Is there a now?

The short answer is yes. Huge moves (especially down) are still a potential.

Let’s take a look at how one opportunity presented itself.

Big Move Characteristics

There are at least three characteristics for a major move:

Price Extreme

Sentiment

Catalyst

To demonstrate how that criteria can be used, we’re going to use one very recent example:

The Carvana Crash

From the all-time CVNA, high of 376.83, set on August 10th, 2021, to the most recent lows (thus far) posted July 14th, this year, was a collapse over -94.8%.

Price Extreme

Carvana Has No P/E and maybe, never had one.

“If your biggest claim to fame is that you ‘invented’ a vending machine … you’ve got real problems.”

With that, and hovering at nearly $380/share, it’s reasonable to say CVNA, had reached an extreme.

Sentiment

To go along with the price and no earnings was the sentiment … literally off the charts.

Used cars, years old, selling above the original MSRP. It was a never-before-seen event.

From a trading standpoint, it does not matter the ‘reason’ for the sentiment; only that the extreme was there.

Catalyst

Now, the hard part. The ‘catalyst’.

Just what was it that pricked the bubble for CVNA?

For our example, it looks like it was one sub-par earnings release too many. At the time of release, there was a subtle change in the character of price action.

About one week after the earnings release in August 2021, CVNA, broke a long-term trendline and never looked back.

Summary

The above example has been highly simplified for brevity.

Even so, we can still use these criteria to look at other market conditions … other sectors.

As you may have guessed, one sector that meets at least two of the above conditions, is biotech, SPBIO.

The third (Catalyst) condition may have been met this past week on August 3rd, with this report. Another link is here.

The take-over candidate GBT, releases earnings on Monday (tomorrow).

Let’s see what happens next.

Stay Tuned

Charts by StockCharts

Note:  Posts on this site are for education purposes only.  They provide one firm’s insight on the markets.  Not investment advice.  See additional disclaimer here.

The Danger Point®, trade mark: No. 6,505,279

‘Pivot’, or ‘The Channel’

Who’s On First?

Evidently, according to this out on ZeroHedge, stocks will be a good buy when the Fed pivots; apparently getting back to 2%, inflation.

So many lies, half-truths and pre-suppositions, all in one sentence. Let us count the ways.

Actually, let’s not.

At this point in time, one does not want to draw any undue attention.

A better idea is to see what the market’s saying about itself. This is the crux of Wycoff analysis.

Wyckoff stated a century ago (1902, to be exact), stock prices moved based on an energy of their own; at times, completely disconnected from fundamentals.

Looking at those markets and from my own tracking spreadsheet, 106, indices or equities are currently monitored.

That list will change over time but it’s typically around 100 or more ticker-symbols.

Of that number, the following are those currently in a downward sloping trading channel.

The List

Looking at the charts on a weekly basis:

AEM, BBY, C, CAT, COF, CORN, CPER, CVX, DIA, DJ-20, DJUSBM, FCX, FMC, GDXJ, GLD, GM, HYG, IYR, PLD, SLV, TSM, USB, USO, WY, XLF, XOM, XOP

Others that may be about to confirm their channel:

IBB, MRNA, SPBIO, SPY

The Charts

Two examples are from the above list; the important part is we’re going to choose ‘heavy industry’.

Since nobody can seem to figure out the definition of ‘recession’, we’ll help them out a bit.

Caterpillar CAT, Weekly Chart:

The right trendline’s declining at approximately -67%, on an annualized basis.

Next up, FMC Corp.

FMC Corp., Weekly Chart:

FMC’s in a little better position with its right side declining at ‘only’ – 55%, annualized.

But wait, there’s more.

Since we’re on a roll; let’s throw in a bonus and include a market directly connected to the economy; Copper.

Bonus Chart:

United States Copper Fund, CPER, Weekly

Even with last week’s continued but fading S&P, short covering, CPER could not close higher.

Ruh-Roh.

CPER is heading south at a whopping -79%, annualized.

Ok, one more.

This one’s not quite yet confirmed but we’ll probably get a decision this coming week.

We saved the best (worst) for last

Moderna MRNA, Weekly

From the lows during the week ended June 17th, to last Friday’s high, was a Fibonacci 8-Weeks.

It’s also a near exact Fibonacci 23.6%, retrace.

On top of that, price action is testing the underside of resistance formed during the break below the 200-level at the beginning of the year.

If next week we see a pivot lower, MRNA’s potentially declining at a well-deserved, -84%, annualized.

Summary

We don’t have to listen to supposed experts and analysis ‘banter’. The charts themselves tell us the next probable direction, i.e., down

Who’s on First and What’s on Second.

The media?

Well, let’s just say they might find this link useful.

Stay Tuned

Charts by StockCharts

Note:  Posts on this site are for education purposes only.  They provide one firm’s insight on the markets.  Not investment advice.  See additional disclaimer here.

The Danger Point®, trade mark: No. 6,505,279