We’re still waiting for a more definitive short-sell signal on the SOXX, but it’s the QQQs that may be setting up first (not advice, not a recommendation).
The chart below shows the QQQ’s have essentially stopped dead right above resistance.
Upside force has gone missing.
Nasdaq QQQ, Daily
Price broke out above resistance (blue line) with upside pressure diverging.
Of course, anything can happen, and price could continue to drift higher.
However, if there’s a lower daily low and lower close for the next session, the risk on a short trade via QID or similar, is well established (not advice, not a recommendation).
Note: Posts on this site are for education purposes only. They provide one firm’s insight on the markets. Not investment advice. See additional disclaimer here.
Any day now, the bubble pops (not advice, not a recommendation).
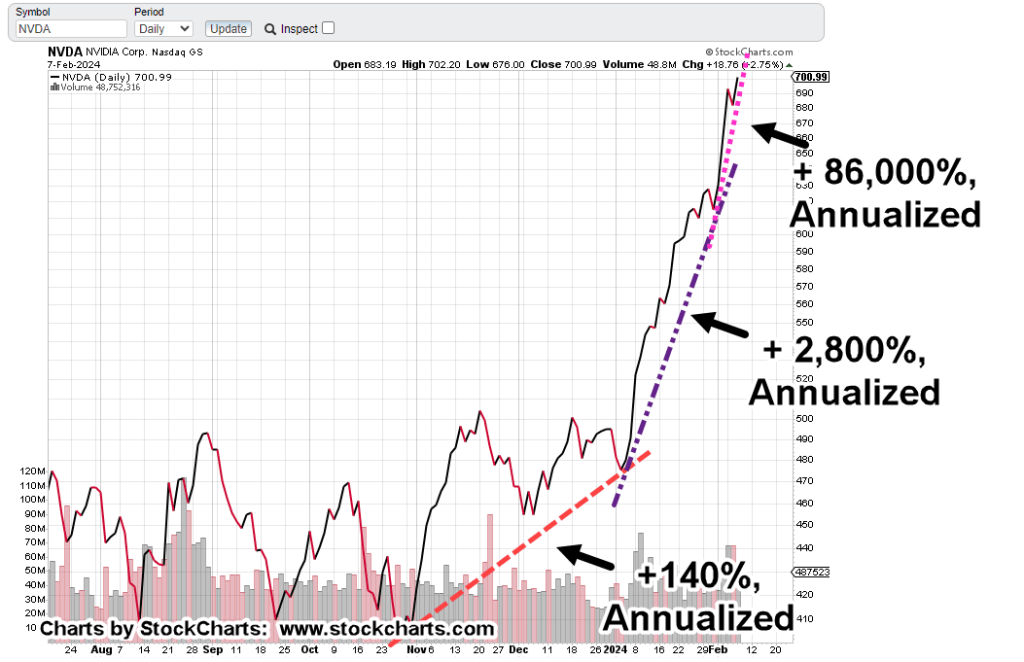
NVDA, may have even topped-out today (or possibly will at the open tomorrow)
We had at least two recent, ‘mee-too’ recommendations (providing contrarian signals) for the high flyer; links here and here.
As we’ll see in the chart below, NVDA appears to be in a blow-off top with ever-increasing rates of ascent.
Nvidia, NVDA, Daily Close
This is what tends to happen during a mania top.
Obviously, the latest trendline, rising at +86,000% on an annualized basis, is not sustainable for the long term.
At this juncture, anything can happen.
NVDA, already had a tremendous bull move from the recent lows of October 14th last year (posted low of, 108.13); realistically, how much upside is left?
Depending on tomorrow’s action, we’ll discuss a potential (short-sale) set-up in the SOXX.
Note: Posts on this site are for education purposes only. They provide one firm’s insight on the markets. Not investment advice. See additional disclaimer here.
The prior session low was penetrated as well as the high with an overall lower close.
All of which brings us to the chart.
D.R. Horton, DHI, Weekly
Looking at the chart, it’s self-explanatory.
We’re in a terminating wedge that’s in a ‘throw-over’.
If price action gets below the upper wedge boundary, it’s a confirmation. That in turn, would suggest much lower prices ahead (not advice, not a recommendation).
Note the massive down-thrust. We have to go all the way back to the ‘event’, to see anything similar.
Note: Posts on this site are for education purposes only. They provide one firm’s insight on the markets. Not investment advice. See additional disclaimer here.
Note: Posts on this site are for education purposes only. They provide one firm’s insight on the markets. Not investment advice. See additional disclaimer here.
We’re still a few hours away from the Fed announcement and it’s already high anxiety in the market.
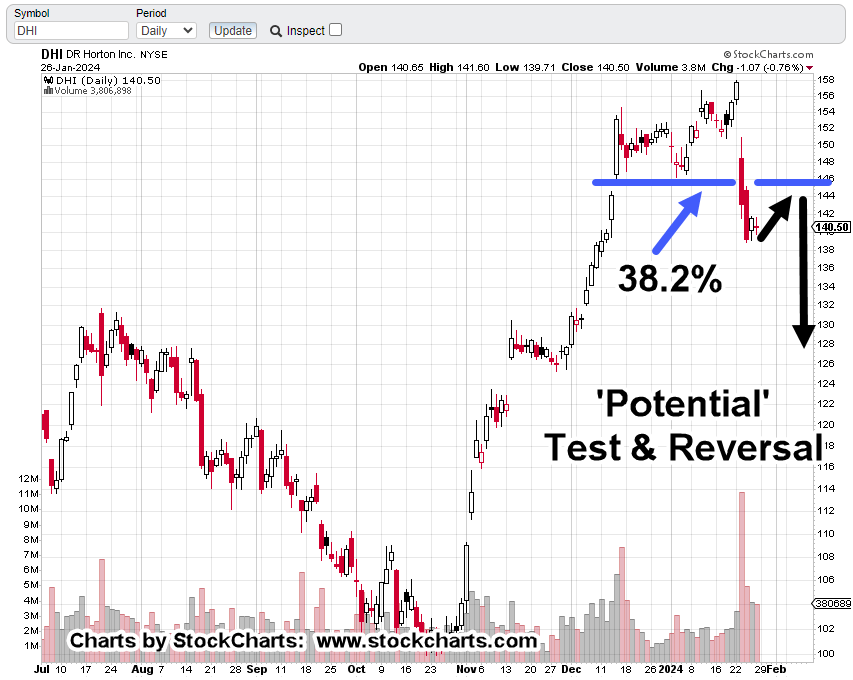
D.R., Horton (DHI) has retraced about 38% of its move and is testing the underside of breakdown resistance.
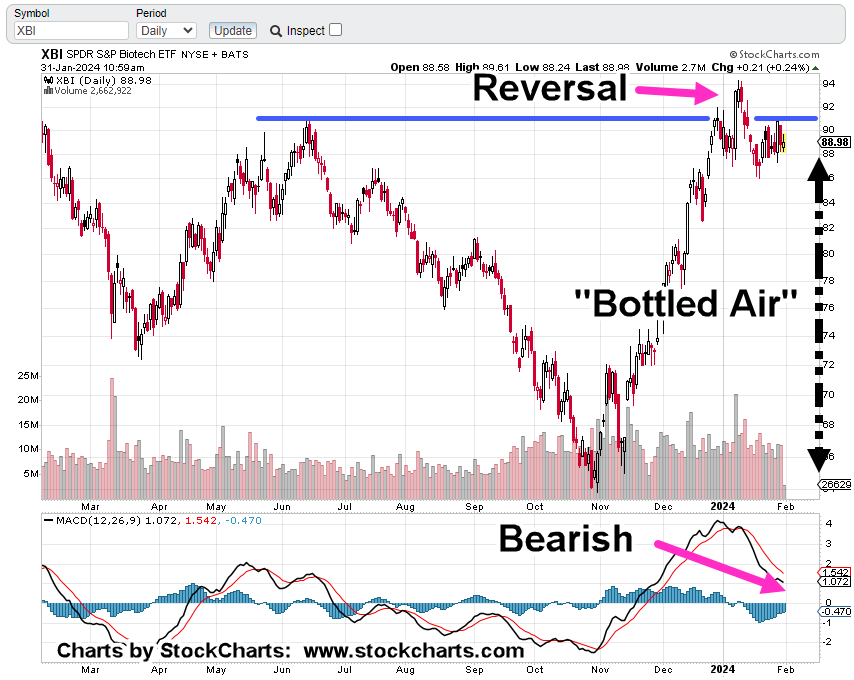
Over on the ‘Little, or no P/E’ side of the market, biotech XBI is coiling, building (downside) potential in its own on-going reversal.
Biotech XBI, Daily
The last update on biotech XBI (link here), said to watch for a false breakout.
The chart shows the result. The breakout did not last; we’re congesting just below resistance (blue line).
The latest post from Uneducated Economist talks about the potential for lower rates, i.e., probabilities are low.
Incorporating that possibility into the above analysis, it suggests the XBI move from last November to the end of December, is essentially built on “bottled air” (not advice, not a recommendation).
The retail side of the market appears to be positioned long, expecting lower rates.
Note: Posts on this site are for education purposes only. They provide one firm’s insight on the markets. Not investment advice. See additional disclaimer here.
We’ve all heard, it’s 80% planning and 20% trading.
So it is, with D.R. Horton (DHI).
As a reminder, this site addresses strategic positioning first, then tactics, and then focus. See the About section for more.
Strategy Review
Unless the charts say otherwise, rates are going higher, not lower. Gold and silver will likely go lower first, before going higher, supply destruction and resulting price increases will continue (not advice, not a recommendation).
D.R. Horton: Possible Retrace
One of two scenarios are likely.
DHI could continue its decline, straightaway. Monday’s open could be gap-down, posting down, no looking back.
The next scenario, a retrace to test underside of resistance. As the chart below shows, that underside is right at 38.2%.
DHI, Daily
The chart presents ‘potential’ only. If the market is well behaved, a retrace to test is a reasonable expectation.
If there’s a retrace, Fibonacci Day 8, from the 1/22/24, high is this coming Wednesday, the 31st.
That day just so happens to correlate with the Fed interest rate announcement due out at 2:00 p.m., EST.
Note: Posts on this site are for education purposes only. They provide one firm’s insight on the markets. Not investment advice. See additional disclaimer here.
Rates are not going lower, they’re going higher; sooner rather than later (not advice, not a recommendation).
Yesterday, ZeroHedge reported the 5-yr auction was nasty with rates rising to near recent highs.
Today, we have yet another supply disruption impacting so-called ‘inflation’.
Couple that with an apparent real estate implosion.
DH Horton (DHI) down nearly – 12% in just days and holding steady in the pre-market session.
It looks like the bubble party is (finally) over.
Gold Miners To Catch Bid?
The miners are at another critical juncture.
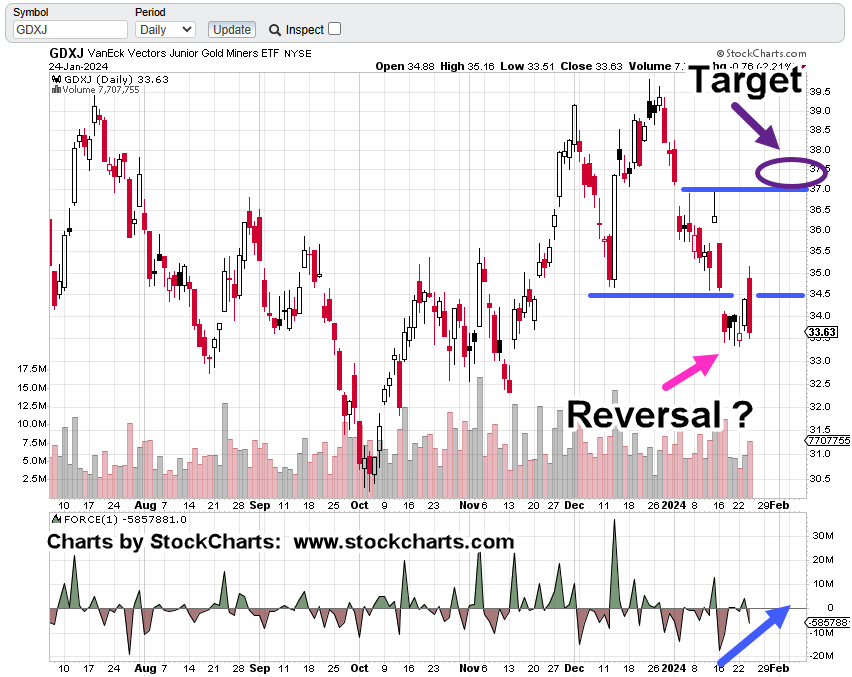
The Juniors GDXJ, are up in the pre-market session (8:00 a.m., EST) and may be catching a flight-to-safety bid as parts of the markets top out and/or reverse.
That flight to safety may not last long as we’ll see below.
Junior Miners GDXJ, Daily
Trading is up about 1% or 0.32 pts in the pre-market.
GDXJ, price action is at The Danger Point®.
We are either in a reversal (Wyckoff spring) set-up or just a pause before posting lower.
If it’s a rally, the target area is shown (magenta oval); corresponding to a 61.8% retrace.
Note: Posts on this site are for education purposes only. They provide one firm’s insight on the markets. Not investment advice. See additional disclaimer here.
Note: Posts on this site are for education purposes only. They provide one firm’s insight on the markets. Not investment advice. See additional disclaimer here.
How about be prepared for no rate cuts this year and more likely, continued elevated rates or higher rates (not advice, not a recommendation).
Let’s not forget we’re over a year now from the release of this post, postulating there would be no ‘Fed pivot’.
So far, no pivot and no cut.
Now that nearly everyone’s positioned on the ‘rate cut’ side, it’s time for the shakedown, possibly beginning today.
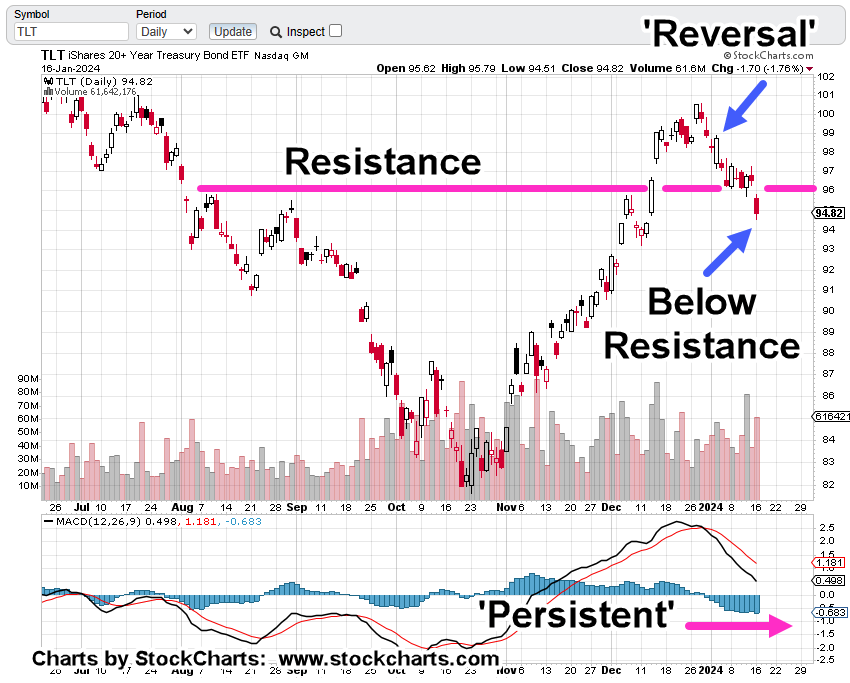
Long Bonds TLT, Daily
Just over two-weeks ago, this post noted to be on the watch for a failed breakout.
Looking at the result, we’re now below the prior breakout resistance, a bearish sign.
The chart of bonds itself is telling us (unless it’s reversed to the upside), there’s an increased chance rates are more likely to move higher (not advice, not a recommendation).
Note the ‘persistence’ to the downside of the MACD indicator. This tends to happen when sustained pressure is being applied … selling pressure in this case.
Note: Posts on this site are for education purposes only. They provide one firm’s insight on the markets. Not investment advice. See additional disclaimer here.
‘They [The Fed] are totally tricking the markets’ (time stamp 3:30), link here.
Yes, it’s a real chess game going on and the other side, makes up the rules.
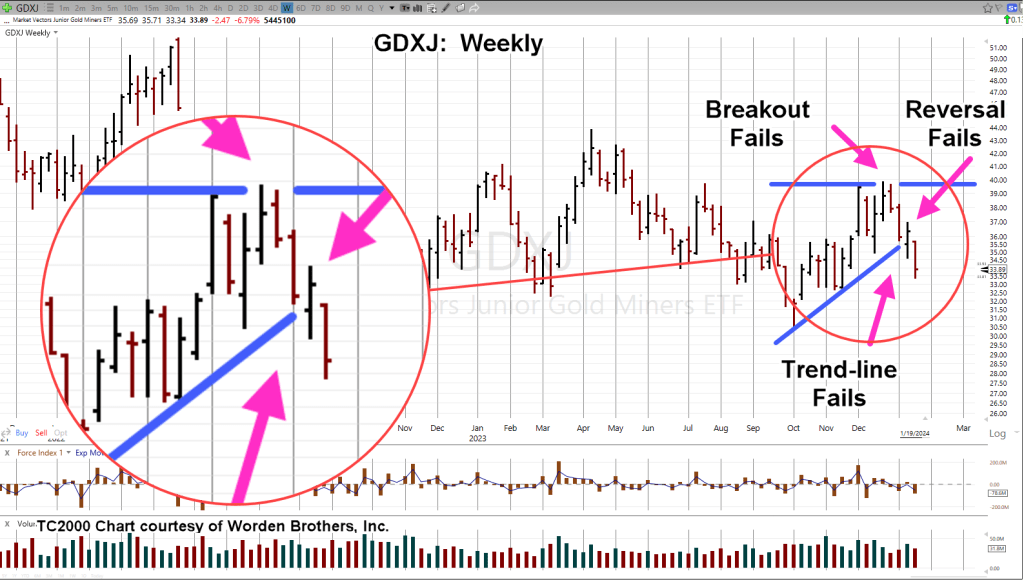
This update presents that despite all the manipulation and head-fakes, significant market pivots in the miners were identified (correctly) with Wyckoff analysis.
That analysis, in turn, helped develop a long-term strategy (not advice, not a recommendation).
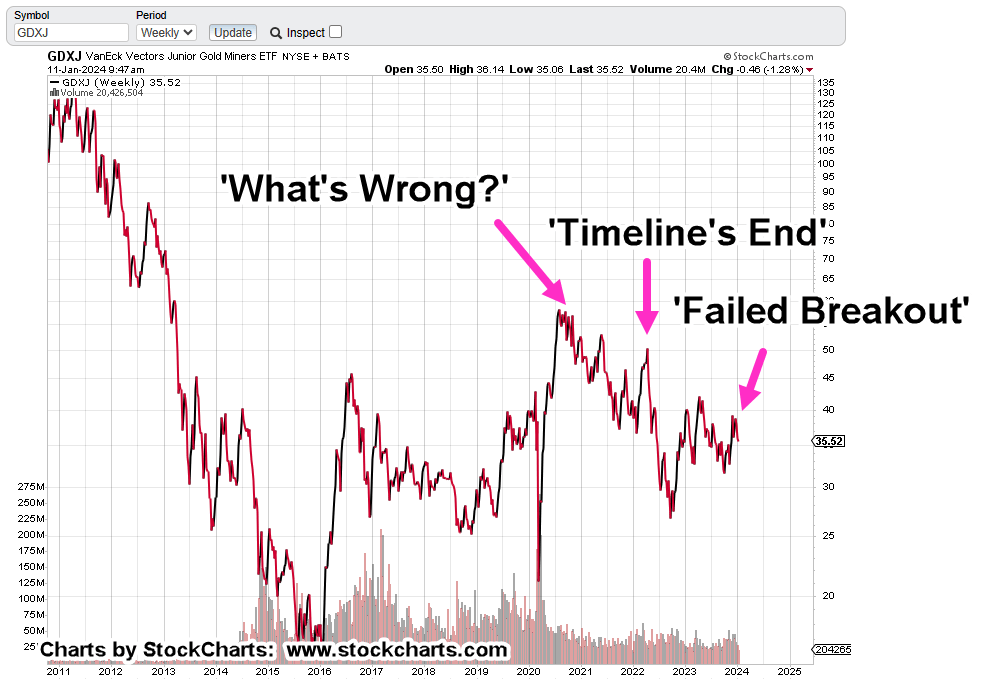
Junior Miners GDXJ, Weekly Close
Three key points are shown on the chart.
The first goes all the way back to October of 2020, link here. There’s something wrong with the miners.
Potential for another downward pivot, link here, was identified to-the-week, if not, to-the-day.
The subsequent move printed the most impulsive price action since the spike melt-down of early 2020.
Which brings us to today.
Another potential pivot has been identified, link here.
As of this post (11:20 a.m., EST) the Juniors GDXJ, continue to rachet lower.
The Long Term
As Ed Dowd points out in this interview, what’s happening now will affect us all for decades, if not centuries to come.
Therefore, it’s a good idea to have a long-term strategy.
From the above chart, it’s clear that Wyckoff analysis has been on the correct side of GDXJ price action; the bearish side (not advice, not a recommendation).
Note: Posts on this site are for education purposes only. They provide one firm’s insight on the markets. Not investment advice. See additional disclaimer here.