Real Estate … Showdown !

Let The Lawsuits Begin

Let’s see …

We already have lawsuits for ‘The Speck’, injury and death.

Then we have the lawsuits because the stock price went down (always happens).

Now, we’ll have lawsuits for paying too much over asking price, because my real estate agent told me to.

Couple that with grocery store shelves going empty, power outages, fake wars (with real consequences), more corporate layoffs and voila!

The court case for any of the above, might be heard before 2030 … if you’re lucky, not homeless and we’re all still alive.

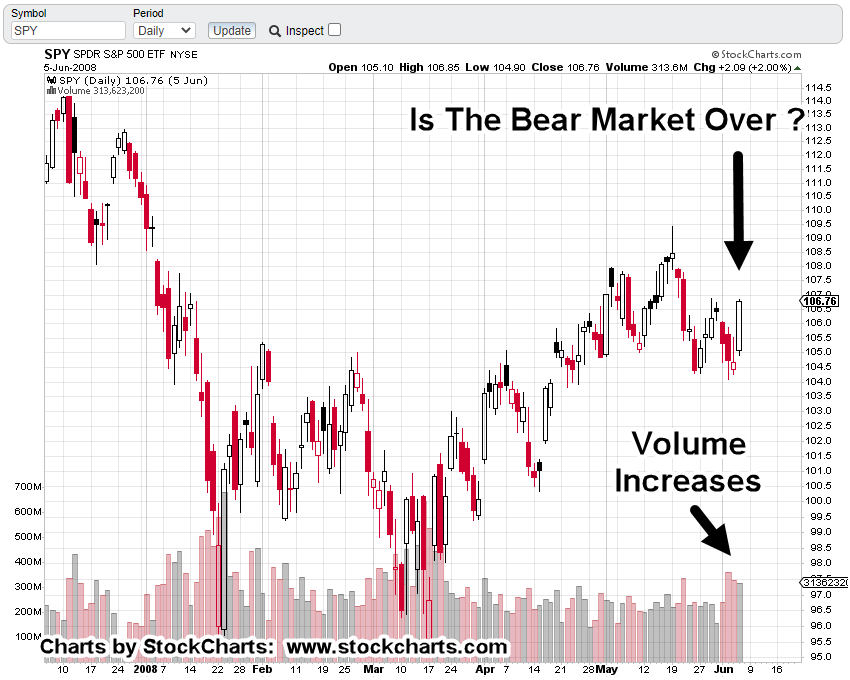
Was That, The Bounce ?

Yesterday, Wednesday was supposed to be the last chance for the bulls. The release of the CPI, being touted as a potential upward ‘catalyst’ for an already oversold market.

We even had helpful advice like this, saying ‘it’s so bearish, it’s bullish’.

Buried within that article was the caveat, extreme negative sentiment contrary indicators, only work in bull markets.

We’re not only in a bear market, it’s a full-blown collapse (so far). We’re on track for vaporization; all of which leads us to the market at hand: Real estate.

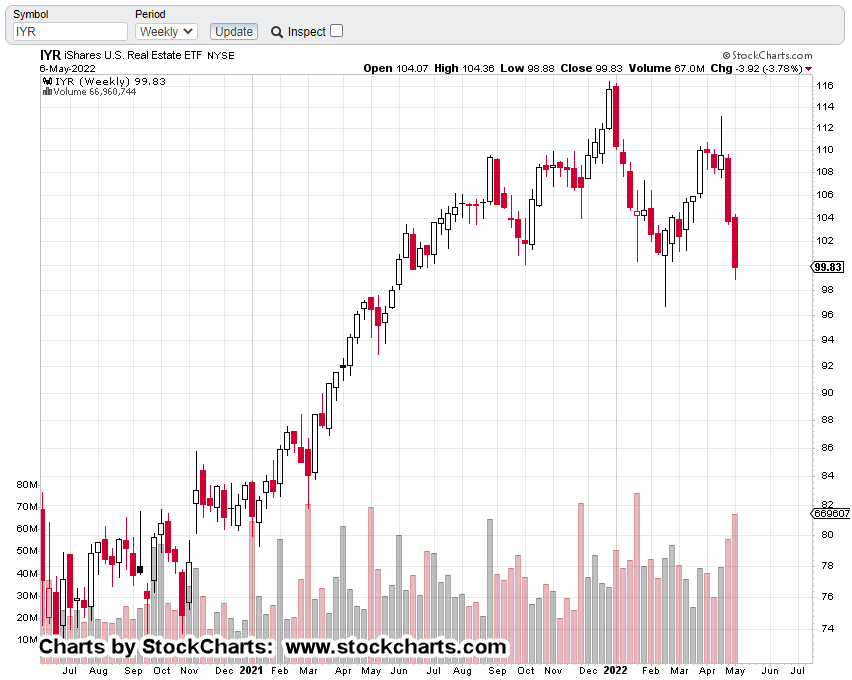
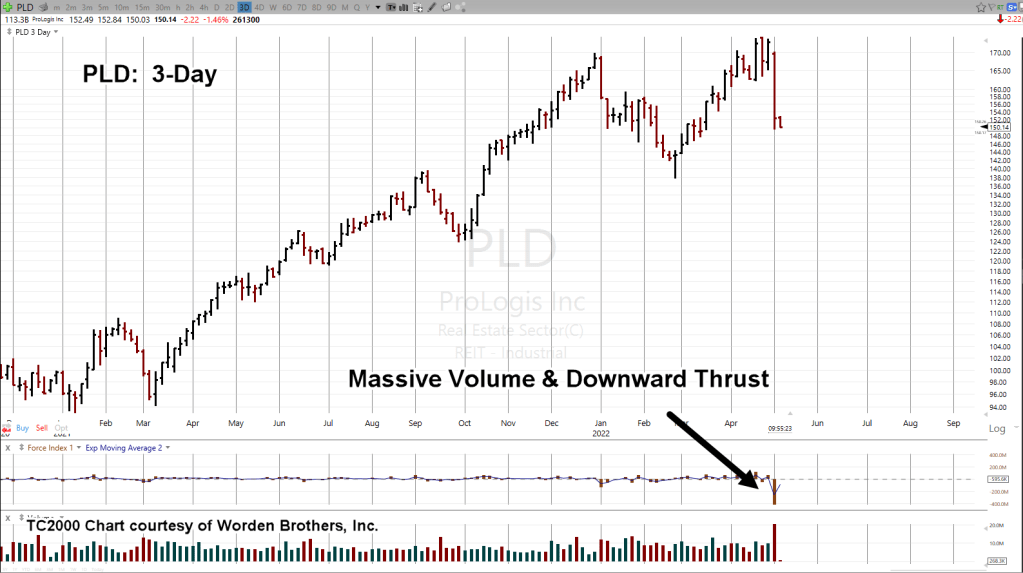
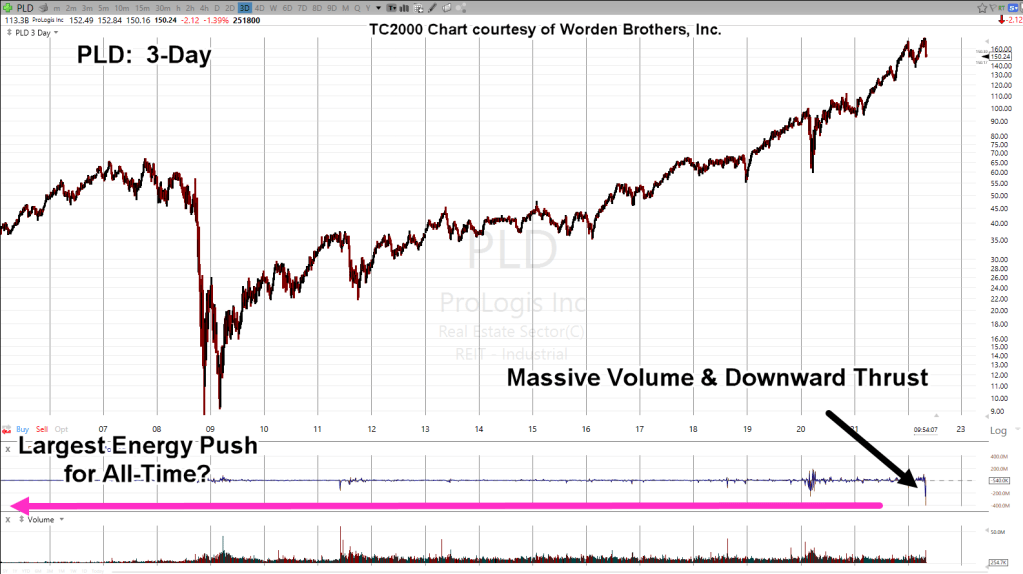
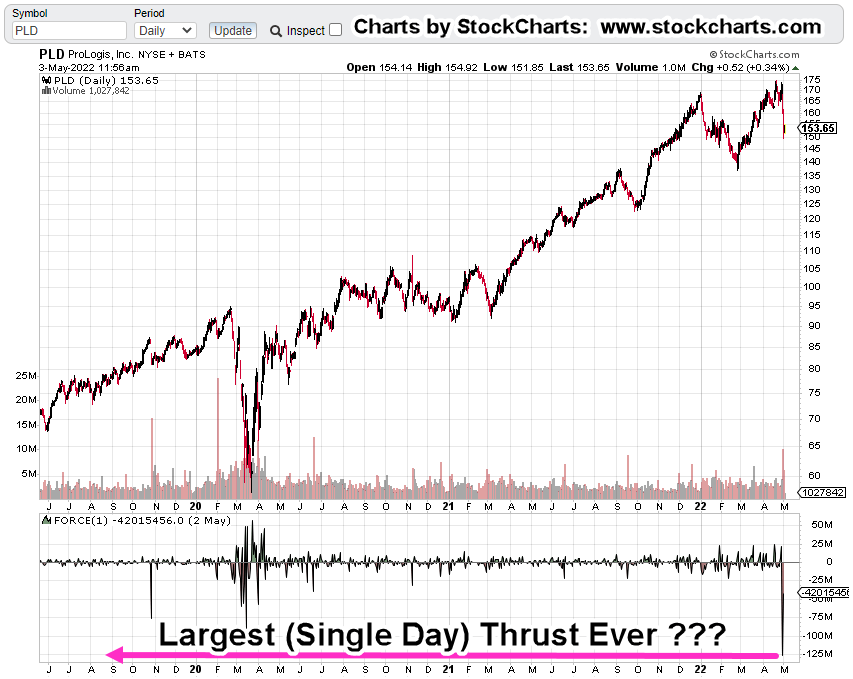
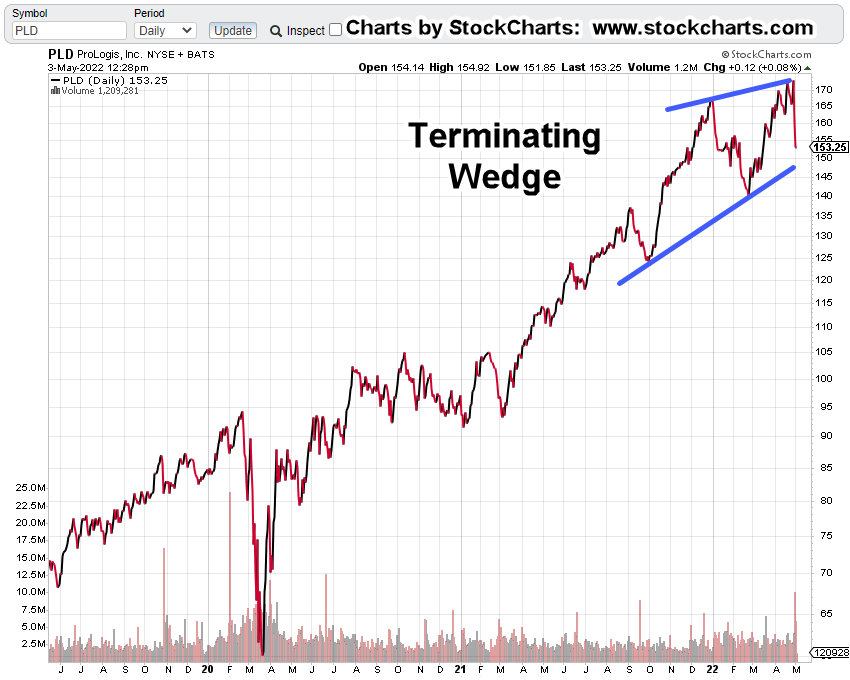
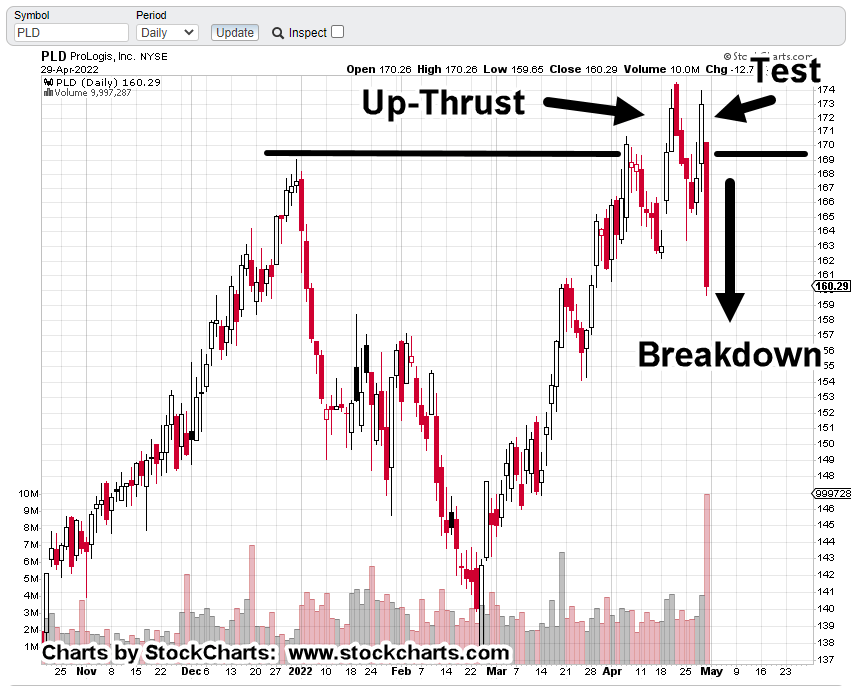
Real Estate, IYR, Daily Chart

The following chart contains a Fibonacci projection tool, showing levels from 23.6% to 100%.

Lower values such as 161.8%, are currently, off the screen.

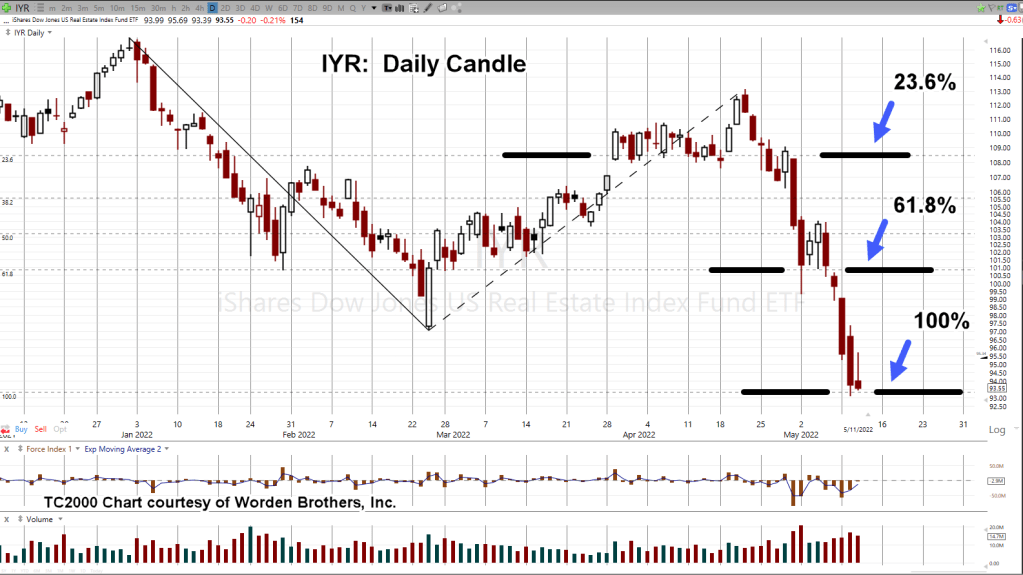
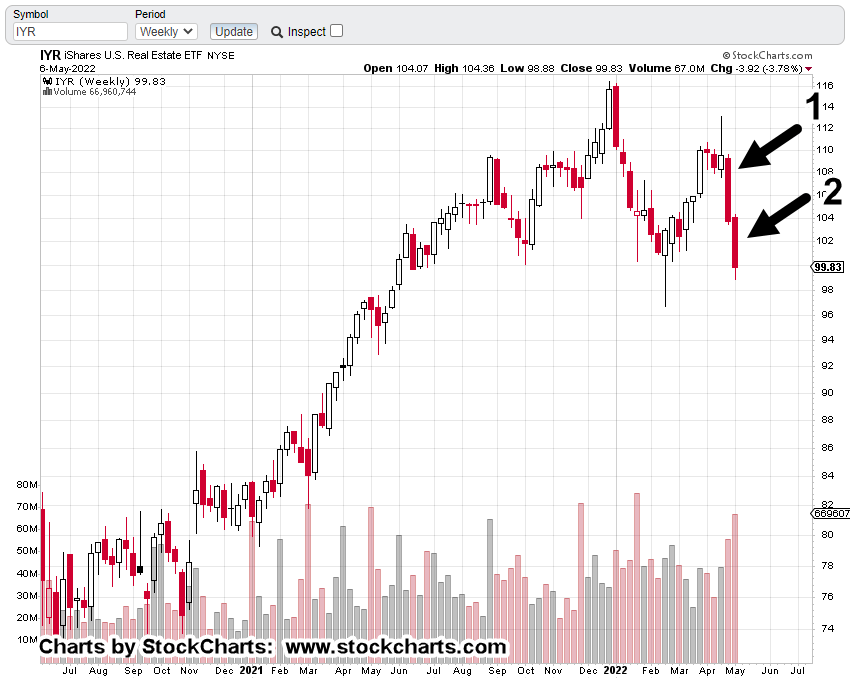
It’s obvious, the market’s ‘respecting’ these levels as it hesitates (to confirm) before continuing lower.

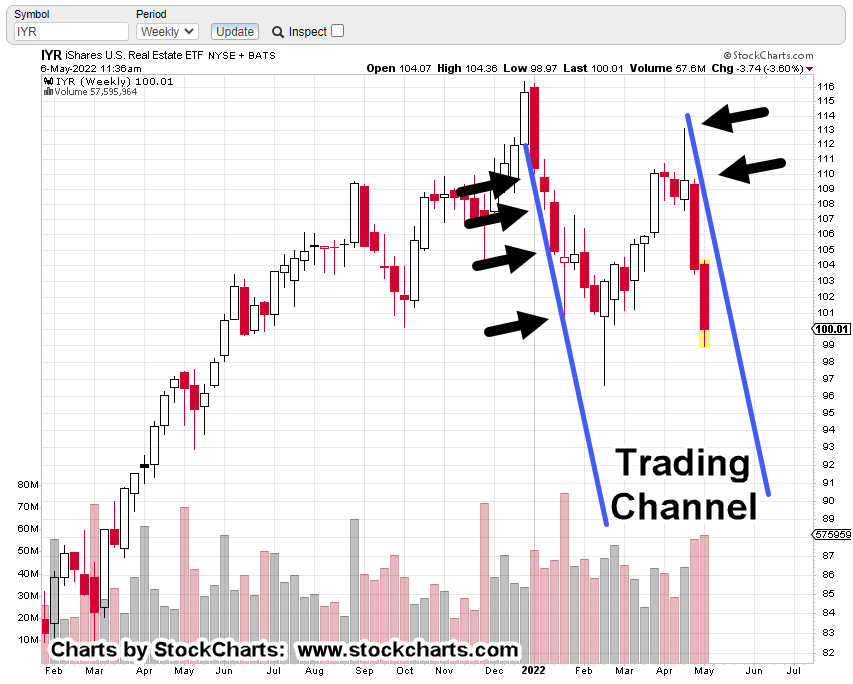
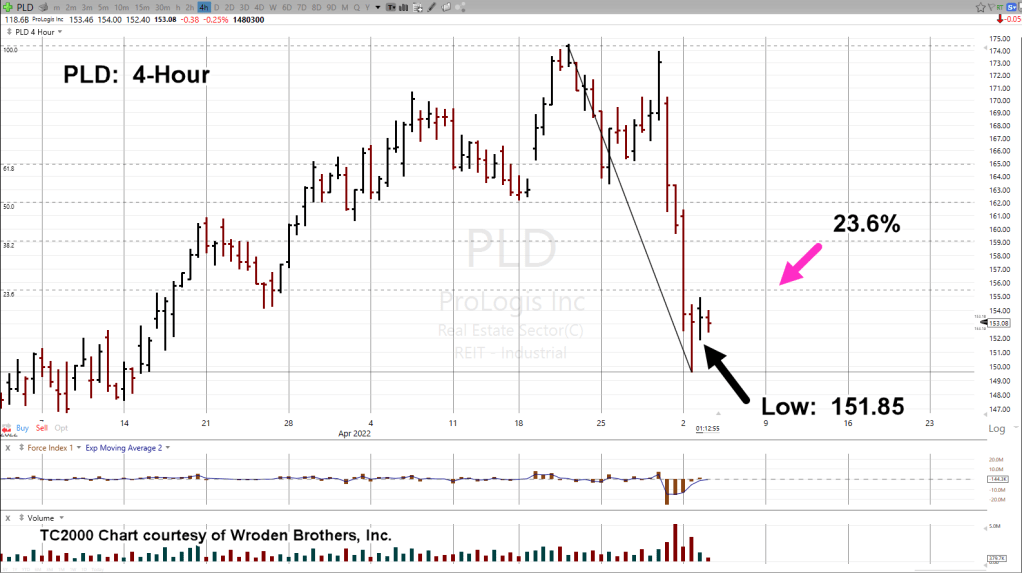
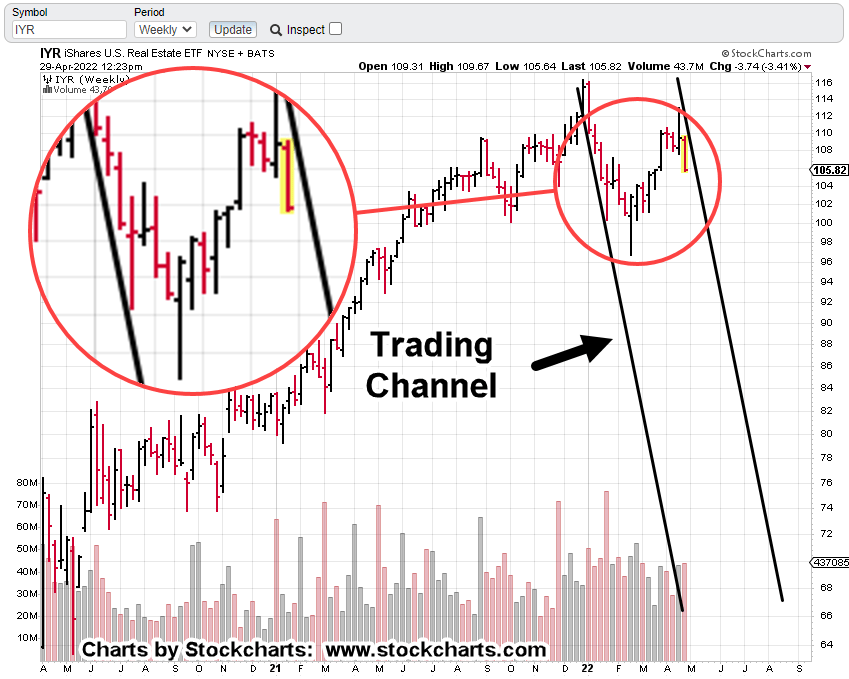
However, the real story is on the hourly chart below.

Yesterday’s bounce is shown as well as a trendline.

The scary part, or good part depending on one’s perspective, that trendline’s declining at approximately 99%, annualized … effectively straight-down.

E.F. Hutton, Vice Chairman, Loeb

The late Chairman of E.F. Hutton said in his book ‘The Battle For Investment Survival’:

‘Real opportunities are rare. When you find one, it must be used to its fullest extent’.

This site adheres to tenets laid out by three masters: Livermore, Wyckoff and Loeb:

Strategy, Tactics, and Focus.

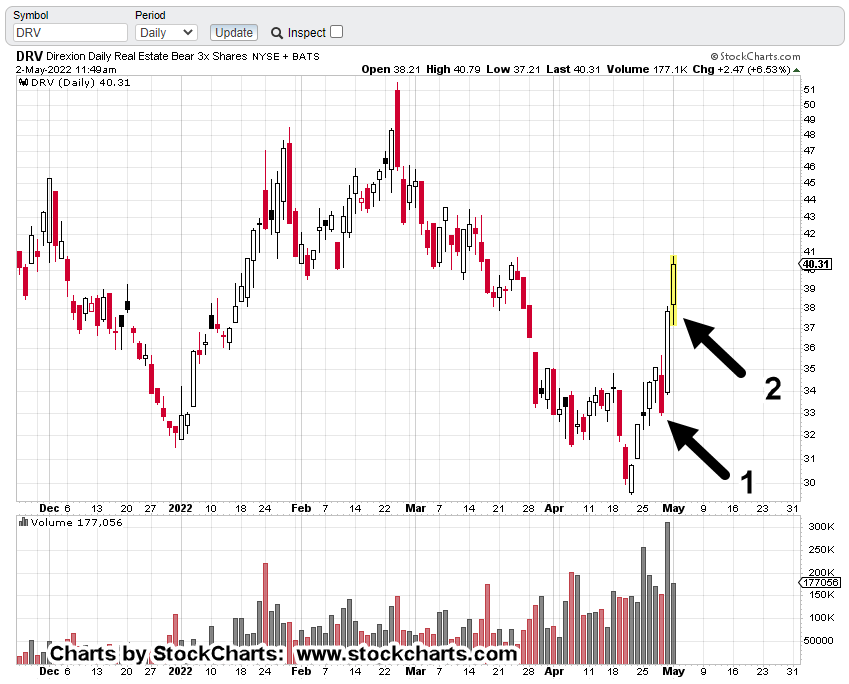
Shorting IYR via DRV (DRV-22-02) is our approach to what looks to be a significant opportunity (not advice, not a recommendation).

Summary

As long as IYR, price action continues to follow the trend lower, we’ll maintain short.

Anything can happen and the trend be violated … even at the next session about to start in 20-minutes.

However, at this juncture, probabilities for IYR, continue to point down.

Stay Tuned

Charts by StockCharts

Note:  Posts on this site are for education purposes only.  They provide one firm’s insight on the markets.  Not investment advice.  See additional disclaimer here.

The Danger Point®, trade mark: No. 6,505,279

Last Time … is not … This Time

The Rule of Alternation

That’s it in a nutshell. What happened last time, won’t happen this time.

The market reveals its own secrets; you just have to know where to look.

An entire industry has been (purposely) built to make sure the ‘average investor’ never finds the truth of the markets.

That industry is the financial analysis industry; the one with the P/E ratios, Debt-to-Equity, and so on.

Sure, it was a tongue-in-cheek post to use the fact that Carvana had no P/E (linked here).

I’m not certain if they ever had a P/E; probably not.

However, that financial, i.e., fundamental(s) fact, did not keep the stock from going up over 4,529%, in four years.

It should be noted, the Carvana analysis was done on a Saturday (as has this one). At the very next trading session, CVNA posted lower, started its decline in earnest and never looked back.

Not saying that exact thing (timing it to the day) will happen with our next candidate real estate; as said before, part of Wyckoff analysis (a lot of it, actually) is straight-up intuition.

The good part from a computer manipulated and controlled market perspective, intuition can’t be quantified.

So, that’s your edge.

Let’s move on to ‘last time is not this time’ and see what the real estate market IYR, is telling us.

Weekly Chart, IYR

We’ve got the weekly un-marked chart of IYR, below.

The ‘alternation’ is there.

Here it is, close-up.

The first leg lower had some initial smoothness but quickly became choppy and overlapping.

Not so, now.

We’re essentially heading straight down.

Fundamentals

From a fundamental standpoint, real estate is finished. However, it’s been finished for a long time.

The fundamentals won’t and can’t tell anyone what’s likely to happen at the next trading session … or any other session.

The market itself (shown above) is saying the probabilities are for a continued decline; posting smooth long bars until some meaningful demand is encountered.

As shown on the last post, if the trading channel is in-effect, that (chart) demand is a long way down.

Positioning

Shorting IYR via DRV, has been covered in previous posts (search for DRV-22-02).

The following weekly chart, is marked up with two arrows.

Arrow No. 1

Initial short position via DRV was opened late in the day on April 28th; the day before the market broke significantly lower (not advice, not a recommendation).

Arrow No. 2

As the market headed lower during the week just ended, the size of the DRV position was increased by 36%.

Currently, the gain on the total position is about +22%.

At this juncture, the DRV stop is located well in the green in the unlikely event we get a sharp IYR, upward move in the coming week.

Summary

Under ‘normal’ conditions one could expect some kind of upward bounce in the days ahead.

However, as shown already with big cap leader PLD, the situation’s anything but normal.

Highlighted in earlier posts, biotech is leading the way with SPBIO, currently down – 59.8%, from its highs.

Biotech IBB, with chief cook and (globalist) bottle washer Moderna (MRNA), is down – 36.2%.

As Dan from i-Allegedly has stated time and again, we’re already in a depression.

So, buckle your seatbelt Dorothy …

Stay Tuned

Charts by StockCharts

Note:  Posts on this site are for education purposes only.  They provide one firm’s insight on the markets.  Not investment advice.  See additional disclaimer here.

The Danger Point®, trade mark: No. 6,505,279

Real Estate … Channels Lower

Stay In The Lane

Real estate’s IYR, is trading in a channel that’s declining at around -94%, annualized.

The channel was identified and first presented, in this post.

Let’s take a look at how things are going thus far.

Real Estate IYR, Weekly Chart

The chart below, is a close-in view of current action.

The black arrows are ‘hits’ on the channel lines, providing confirmation of its existence.

From the lower-most channel line hit on the left side (the ‘demand’ side) to the first channel hit on the right side (the ‘supply’ side) is a Fibonacci 13-Weeks; adding more confirmation to the channel’s validity.

The next chart pulls out and extends the channel to show the potential of the move.

The ‘Damand’ Location identifies the point at which price action would need to decline (at this juncture) to contact significant demand if this channel is in-effect.

That is, if the channel has been identified properly. If so, it’s a long … long way down.

Summary

Currently maintaining short with trade DRV-22-02 (not advice, not a recommendation).

The stop location has been moved to DRV 37.80 and is most likely going to be moved higher depending on the close of the day.

Stay Tuned

Charts by StockCharts

Note:  Posts on this site are for education purposes only.  They provide one firm’s insight on the markets.  Not investment advice.  See additional disclaimer here.

The Danger Point®, trade mark: No. 6,505,279

‘Now, We See The Violence …

… Inherent In the System’

It may as well be a Monty Python skit.

The number of opinions forecasts, pontifications and gesticulations have reached levels beyond the absurd.

Everybody’s important and has some intellectual and/or philosophical missive to promulgate.

We have great levels of insight like the selected items below. As promised, these comments were taken from the article linked in the last post.

“I don’t need to pay some 78 year old to hold 1/2 my money in cash”

“What a joke. We’re heading for multi-year blow-off top”

“78 year old fund manager loses his azz … markets going nowhere but up”

“Parabolic increase to nosebleed levels and an epic explosion 3 years from now.”

Seems our idiot/lazy Boomers, Gen-X-rs, Millennials, Gen-Z-rs, and just about everybody else, is the genius in the room; except for the 78-year-old.

He’s just a buffoon.

If someone has no real skill, experience or initiative, they resort to trash-talk like we see above.

Getting the right experience is the hard part.

Having experience in the markets involves many years of education (i.e. losses).

Just for documentation’s sake, let’s take a look at two examples of what experience looks like; each in their own respective industries.

Exhibit A:

Go ahead, check out this Bubba from Amarillo, Texas.

His customers drive from neighboring states, hundreds, if not thousands of miles away to have him rebuild their transmissions.

Within the first 5-minutes of the video above, there’s probably 30-years of experience on display.

I would suspect his rebuilds go for top-dollar; rightly so.

Then, we have this:

Exhibit B:

Yesterday’s market action, and today’s, has happened before.

That is:

A sharp multi percentage point, headline grabbing spike higher (within a down market), that’s immediately reversed the very next day.

Not only that, but the reversal also signified a bear market had started in earnest.

S&P 500, SPY, Daily Chart

Let’s set the stage.

In our example, the S&P had already topped and reversed.

It spent the next seven months heading lower and then retracing upward to an eventual downside reversal.

The next leg down continued, but then a few days later, there’s a massive, headline grabbing, upward spike.

Is the bear market over?

Is this the signal to buy the dip like our ‘experts’ above think for the current situation?

The next day, price action reversed the entire gain (like it has done today).

The chart shows the result.

From a personal standpoint, a 78-year old that’s still mentally sharp enough to provide his services and is not an obvious (globalist) sell-out the likes of which are on CNBC, then I’m very keen on what he would have to say.

His message: It’s the biggest bear market of his life.

Secondly, as Dr. Elder has said, ‘Trading is an old man’s game’. A good memory is critical to creating an edge.

In our example, I remember that upward spike well.

It was a Thursday.

The next day, price action reversed hard to the downside.

It never looked back for nine months.

Summary:

Is the S&P scenario described above, where we are now?

History never repeats itself exactly.

However, one can propose with some level of confidence, if today was the kickoff to the next leg, it has potential to be the fastest, farthest down price action in market history (not advice, not a recommendation).

Stay Tuned

Charts by StockCharts

Note:  Posts on this site are for education purposes only.  They provide one firm’s insight on the markets.  Not investment advice.  See additional disclaimer here.

The Danger Point®, trade mark: No. 6,505,279

A Day To Remember

Was Today The Inflection Point?

There were so many comments on the ZeroHedge article (linked here) about the musings of a 78-year-old money manager (effectively saying he’s an idiot … a dolt), we’re going to use those comments for reference on a go-forward basis.

Everybody has an opinion but nobody’s actually looking at what the market is saying about itself.

That’s where the answers will be found … no matter one’s personal bias.

Looking at real estate IYR, we see that price attempted to get above the axis line shown but did not make it.

Before we go further, a correction: The last post said the stop on DRV-22-02 was located at DRV 32.71.

The stop is actually located at DRV 37.21. Numbers got swapped.

Real Estate IYR, Daily

It’s interesting to note, ProLogis (PLD), the largest cap in the sector did not close higher for the session.

If IYR, with other indices do not have a decisive follow-through (stopping out DRV-22-02, in the process) at tomorrow’s session, the Ponzi scheme’s in serious trouble.

As already stated, events may happen faster than anyone expects.

Summary

We’ll leave off with this just out from ice-age-farmer; linked here.

The collapse of the entire food supply has been building (sorry, in the planning stages) for years.

It’s intentional.

Does anyone think that ‘raising rates into weakness’ is not also intentional?

Stay Tuned

Charts by StockCharts

Note:  Posts on this site are for education purposes only.  They provide one firm’s insight on the markets.  Not investment advice.  See additional disclaimer here.

The Danger Point®, trade mark: No. 6,505,279

Real Estate … Doesn’t Wait

Moving Ahead of The Fed

Waiting, waiting, waiting … ‘gonna die, waiting.

For real estate IYR, the waiting part’s, already over.

This post back on April 27th, identified the trade set-up.

The prior all-time highs analysis for IYR, failed with an up-thrust reversal.

That told us, downside forces were in control.

Adding to that, we had the largest cap equity in the sector ProLogis (PLD), showing a massive downward thrust lower; possibly the largest one-day event, ever.

Now, there’s more.

The two charts below are in 3-Day increments. As of this morning, we’re in a new three-day period.

For three-days just ended, down-thrust energy for PLD, posted levels not seen since before February of 2005 !

Not even the wipe-out during the Financial Crisis of 2008, generated a similar 3-Day period.

What that means for PLD, at least, it’s in a territory of its own … literally off the chart.

ProLogis PLD, 3-Day

Compressing the chart to put it in perspective. The data below, goes all the way back to February 4th, of 2005.

The Fed-Man Cometh

All of that does not mean real estate can’t rebound higher after 2:00 p.m., EST (11:32 a.m. EST, as of this post).

Anything can happen.

The stop for the short position via DRV (DRV-22-02) is currently set at DRV 32.71 (not advice, not a recommendation).

Summary

At the open, IYR was lower and has continued lower but has not posted a new daily low.

That leaves the door open to the upside if there’s enough perceived ‘relief’ from any Fed comments.

The main objective of this post is to put forth the possibility, events may happen faster than anyone expects.

If there’s any kind of rally, it’s likely to be brief.

Stay Tuned

Charts by StockCharts

Note:  Posts on this site are for education purposes only.  They provide one firm’s insight on the markets.  Not investment advice.  See additional disclaimer here.

The Danger Point®, trade mark: No. 6,505,279

The ProLogis … ‘Push’

Shoved Off The Cliff

“Push” may not be the right word.

For ProLogis, it’s possibly the single largest downward thrust ever.

We’re using PLD, as the proxy for the real estate (IYR) sector as it’s the largest cap equity.

That’s true for now … but maybe not for long.

ProLogis PLD, Daily Chart

From the data available, it’s the largest single-day, down-thrust energy, going all the way back to May of 2016.

The daily close, shows a terminating wedge is in-effect.

So far, PLD is down about – 12.3%, from all-time highs and looks to be heading for the lower (wedge) trend-line.

PLD Behavior During a Market Rout

It’s straightforward.

Using 2008 – 2009, timeframe as the proxy, PLD was vaporized; straight down for two-months.

Hanging By A Thread

Getting in close to the action, we have the 4-Hour chart below.

It’s currently about 1:30 p.m., Eastern.

The first half of today’s session attempted to retrace the down-move. It did not even make it to the 23.6% level.

The low of that 4-Hour bar is marked … 151.85.

If the current 4-Hour bar penetrates 151.85, without moving higher, it may show PLD as ready to continue lower to the bottom wedge trendline.

Stay Tuned

Charts by StockCharts

Note:  Posts on this site are for education purposes only.  They provide one firm’s insight on the markets.  Not investment advice.  See additional disclaimer here.

The Danger Point®, trade mark: No. 6,505,279

Failure, Success: GLD & IYR

When A Spring Set-Up, Fails

The upside reversal (spring) set-up for gold, has failed.

When a high probability bullish scenario fails to materialize, it signals a market with potential to completely fall apart.

Nobody expects a major reversal in gold … nobody.

Yet … there it is

We’ve had the huge volume on March 8th, that looks more and more as changing of hands; from strong to weak.

Now, the apparent reversal has failed.

Anything can happen but at this juncture, the highs of March are getting farther and farther away.

Gold (GLD), Weekly Chart

Gold could always right itself and reverse from here.

We’ll keep an eye on it but let’s move on to a trade set-up that’s working; Real Estate, IYR and leveraged inverse, DRV.

Leveraged Inverse (-3X) Real Estate, DRV

The expectation for this morning’s session, was for IYR to retrace and test Friday’s breakdown.

It’s not happening … or at least, not at this point.

Wyckoff (along with Livermore) were obsessed with ‘what is’ and not what ‘should’ be.

The ‘what is’ at this point, IYR appears to be in a swift down move with minimal upside.

Trading actions have therefore been adjusted accordingly.

The chart of inverse DRV shows two entries marked as “1” and “2” (not advice, not a recommendation).

At this juncture, the short position in IYR via DRV (DRV-22-02), has been fully established.

The stop is now moved up to the session low @ DRV 37.21

Summary

At time stamp 8:10 at this link, The Maverick shows how far behind the curve interest rates are to what’s happened with Fed actions in the past.

If they repeat past behaviors, that of moving rates higher, it’s likely to be a massive shock.

The last place to be when interest rates rise sharply, is real estate; the most illiquid asset of all.

Stay Tuned

Charts by StockCharts

Note:  Posts on this site are for education purposes only.  They provide one firm’s insight on the markets.  Not investment advice.  See additional disclaimer here.

The Danger Point®, trade mark: No. 6,505,279

The ProLogis ‘Connection’

Largest Cap, In The IYR

The French Connection

As with Newmont Mining in the Senor Miners Index GDX, ProLogis is the largest market cap in the Real Estate Index, IYR.

When markets ‘thin-out’, when they reach the end of a long sustained bull move, capital exits the lower caps, the lesser performers, and is thrown into the last man standing; the largest cap(s) in the sector.

In can be argued, that’s where we are now with IYR.

Friday’s Wipe-Out

As expected, because of the near thousand point drop in the Dow, YouTube’s abuzz with everyone attempting to figure out what’s going to happen this coming Monday.

The Maverick does an excellent job (linked here) of posing the question, ‘Where are we’?

He doesn’t even bother with are we in a market collapse; that’s pretty much a no-brainer. It’s the ‘where’ in the collapse, that’s the question.

Real Estate … What’s Next?

From this site’s perspective, we’ll let the market itself tell us what’s likely to happen next.

Since the focus over the past week has been real estate (IYR), let’s look at the largest cap ProLogis PLD, to get clues on the next potential action.

ProLogis PLD, Weekly Chart

First, we’ll look at the big picture.

PLD was vaporized in the last market collapse.

We should also note, it took about 12-years to get back to pre-crash levels; good ‘ol ‘buy and hold’ 🙂

Of course, a multi-year covered call strategy could have been implemented if maintaining long. With that approach, PLD could have potentially become a cash-cow.

Crash Clues

Note on the chart above, PLD didn’t just up and crash; it gave clues well beforehand.

We’ll go into those clues in a later update.

For now, let’s look at next week’s probable action.

ProLogis PLD, Daily Chart

First, the un-marked chart to show where action finished up on Friday.

Next, we see an upthrust, test and sharp reversal.

Price action finished at support and just below the lows set on Monday, the 18th and Monday the 25th.

Wide, high-volume bars tend to get tested.

So, we’re below the lows with a wide high-volume bar. That puts PLD, in spring position.

Summary

Because PLD and IYR (and the rest of the indices) finished at or near their lows, there may be some downside follow-through this coming Monday.

Price action’s the final arbiter but there’s potential for some kind of upside test in the coming week(s).

As a courtesy, the DRV chart below shows the entry location for DRV-22-02 (not advice, not a recommendation) and the current stop.

Note how liquidity has picked up over the last two weeks.

Friday’s volume of 309,800 shares, was the largest ever for the inverse fund.

Stay Tuned

Charts by StockCharts

Note:  Posts on this site are for education purposes only.  They provide one firm’s insight on the markets.  Not investment advice.  See additional disclaimer here.

The Danger Point®, trade mark: No. 6,505,279

Real Estate & The Wrecking Ball

When The Short Squeeze Is Over …

Question:

How do you know it’s a short-squeeze?

Answer:

When it’s over, prices collapse.

That’s exactly what happened yesterday and today.

Yesterday was the squeeze; today, prices collapsed.

We’re about mid-way through today’s session and there could be a late-day test of the down draft. Even so, the action tells us, up moves at this time, can’t be sustained.

For the first hour of today’s session, price action went straight down. Not even a hint of an upward test.

Real Estate IYR, Weekly Chart

This is how the weekly looks currently.

The 105.50 – 106.00, is an area of support.

Price action may hesitate and use that support for an attempt to move higher.

However, there may be something else at work that’s not obvious without a mark-up.

That is, IYR could be in a downward trading channel; having confirmed the right-side yesterday and today.

As Dan from i-Allegedly, has repeated time and again:

‘We’ve had warning after warning … after warning’.

He even uses that phrase in his recent video, linked here.

In his view, along with access to other real estate professionals, the set-up is worse than 2007 – 2009.

The trading channel area is zoomed-in below.

Four channel hits on the left side and two on the right.

The lowest contact spike on the left channel line to the highest spike contact on the right, is a Fibonacci 13-Weeks.

Positioning

For the most part during yesterday’s session, the short position in SRS was maintained (SRS-22-01).

However, late in the session as price action spiked higher, that position was closed and a new one opened with the 3X-Inverse fund DRV; identified as DRV-22-02 (not advice, not a recommendation).

The downward bias on a triple leveraged fund(s) is significantly higher than a two-times fund (even counting for the additional leverage).

Now that significant countertrend moves may be complete for a while, I’m taking advantage of the additional 3X leverage (not advice, not a recommendation).

There was a slight loss on the SRS-22-01, position; somewhere around -0.21 %, … not significant.

Summary

Both Dan (i-Allegedly) and Jerimiah Babe keep getting asked “When’s the collapse?”

Their responses are near identical; “You’re in it, now”.

What do they (asking the question) expect?

Do they want to have the societal, financial and we now know for sure, genocidal collapse, live streamed through their Netflix?

Stay Tuned

Charts by StockCharts

Note:  Posts on this site are for education purposes only.  They provide one firm’s insight on the markets.  Not investment advice.  See additional disclaimer here.

The Danger Point®, trade mark: No. 6,505,279