Trader’s Discretion

For the current down-leg starting April 14th, the lowest risk point to go short the miners (via JDST) was at this post (not advice, not a recommendation).
Did I do that?
No, but I did the next best thing.
That was, aggressively position short at this post (not advice, not a recommendation).
An initial position was opened via JDST on May 15th with a hard stop at the session low; that position was doubled in size the next day when it was obvious, we’re in a reversal.
Too Late?
What happens now?
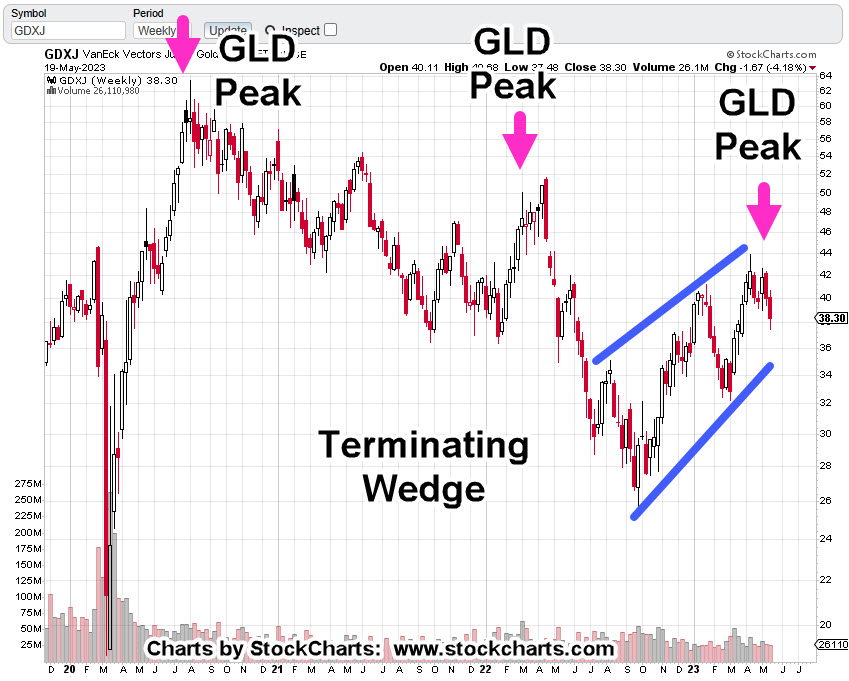
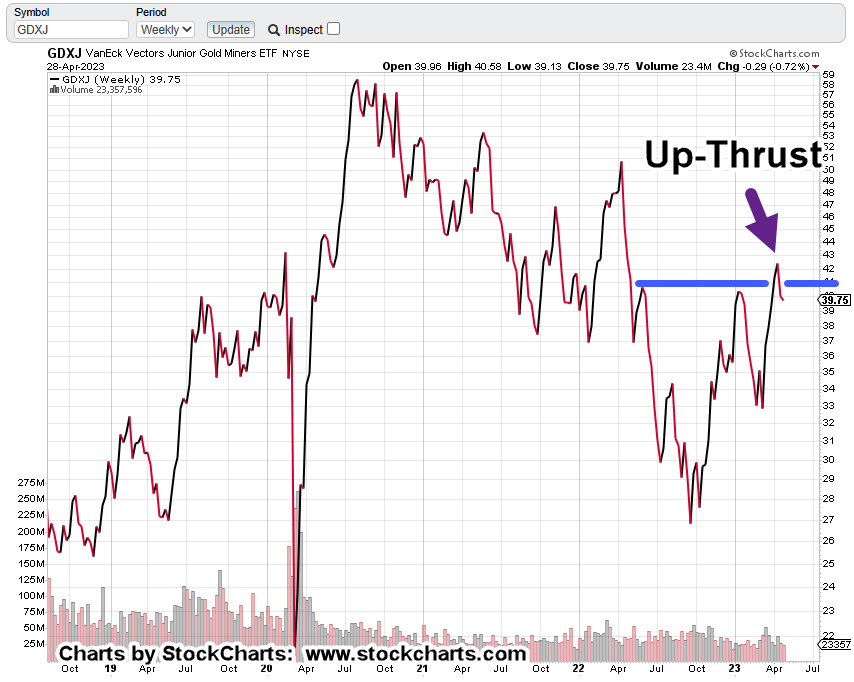
We’re about fifteen minutes before the regular session and GDXJ, looks to open slightly higher.
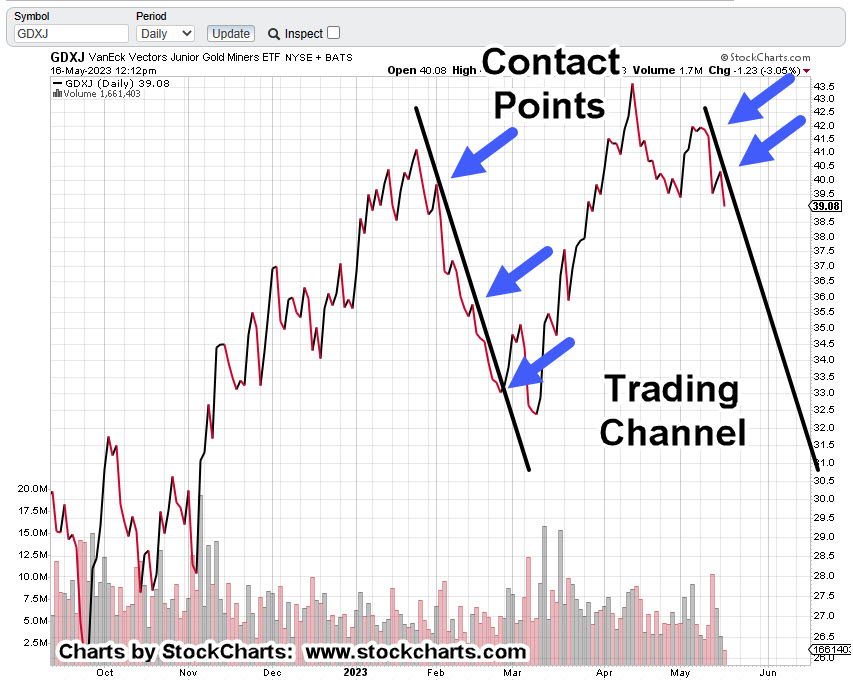
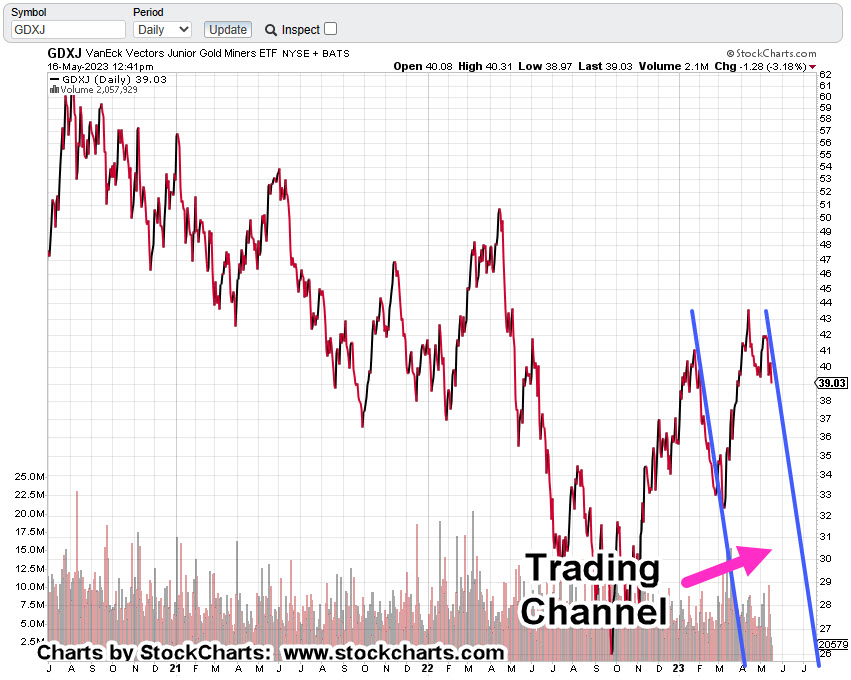
The Daily Chart of GDXJ below shows a penetration of the wedge with the market in position to test that break.
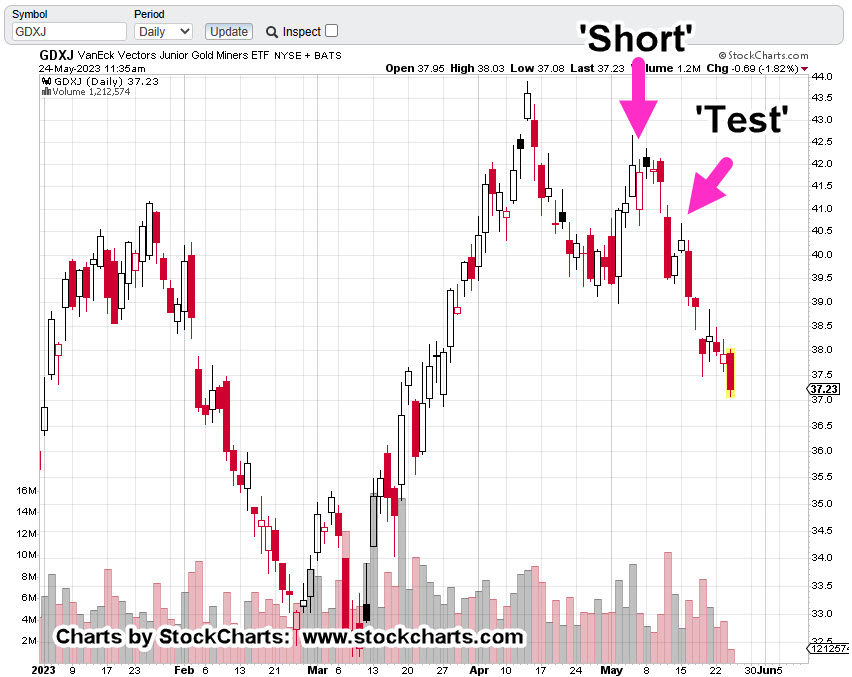
Junior Miners GDXJ, Daily Candle

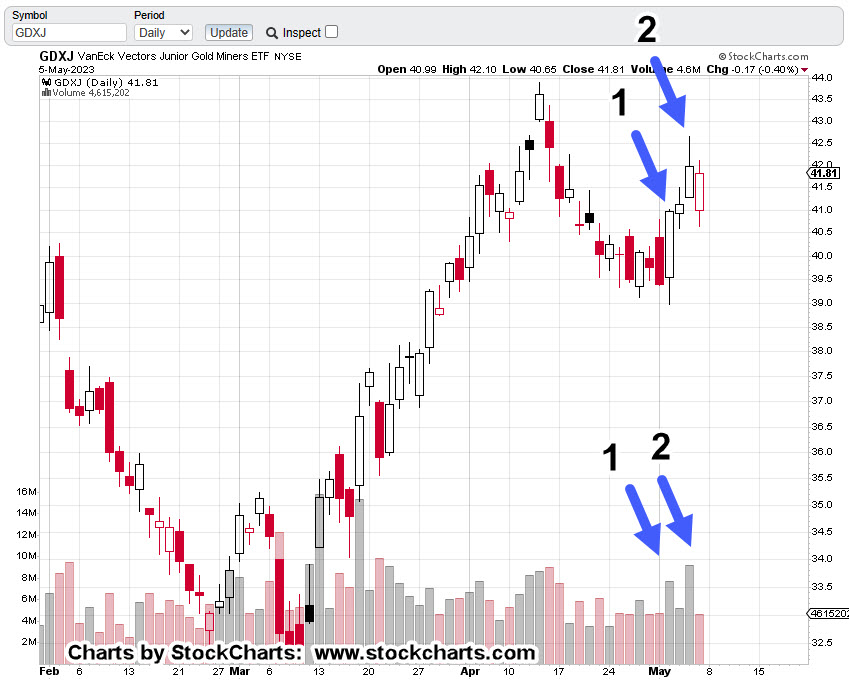
The zoom moves in closer to show the detail.
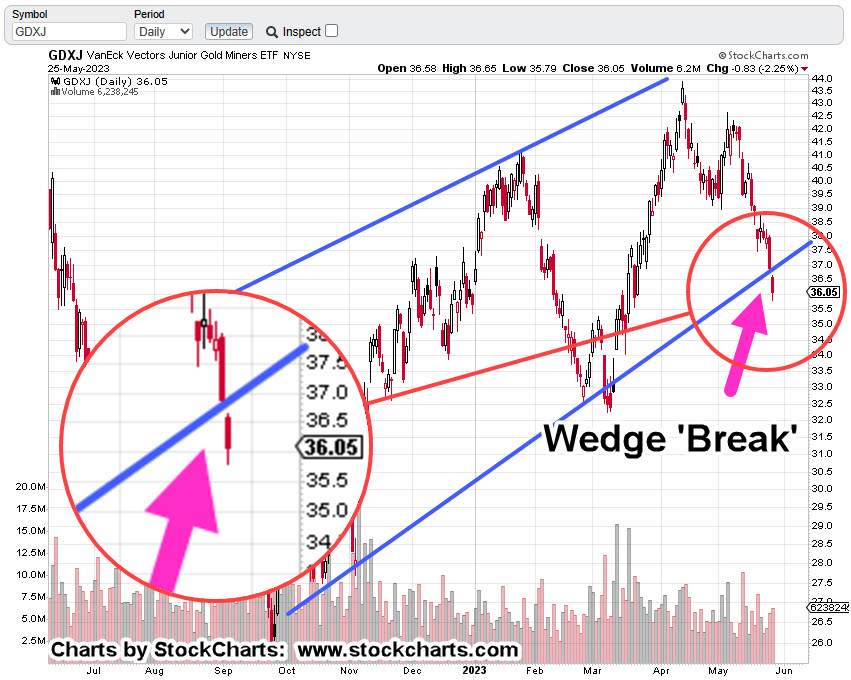
Note: The last push below the wedge trendline resulted in a reversal higher. Will that happen this time?

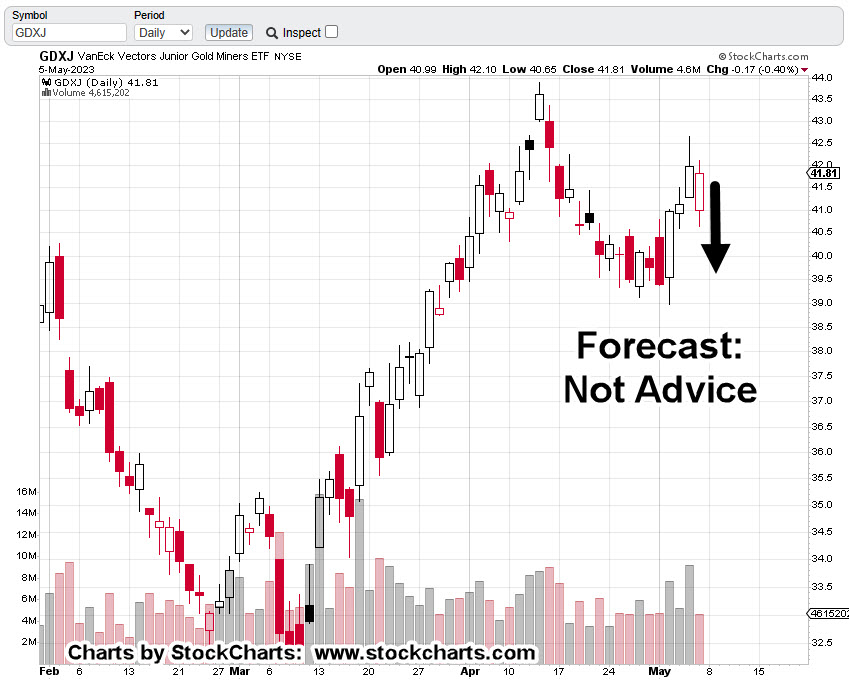
If we use the ‘rule of alternation’, that what happened last time is not likely to happen this time, probabilities favor a test and continuation to the downside (not advice, not a recommendation).
Is this an entry opportunity? Maybe.
Is it as low risk as the prior two pivot points? Probably not.
Then again, the bulls may be stunned at this point and usure what to do. Therefore, huge short positions may not (yet) be in play that don’t need to be squeezed out.
Stay Tuned
Charts by StockCharts
Note: Posts on this site are for education purposes only. They provide one firm’s insight on the markets. Not investment advice. See additional disclaimer here.
The Danger Point®, trade mark: No. 6,505,279