For the mining sector we’re about to find out if it’s bulls or bears.
With today’s overall (S&P, Dow, QQQ, etc.) down market and the press screaming in hysterical panic at the start of the day, you’d think the market had collapsed 50% or more.
The last update (over the weekend) had this to say about the S&P (emphasis added):
“So, here we are: The market (SPY) has rallied over the past week, giving the illusion that all is well.
However, it too is now in up-thrust (reversal) position.“
So, the SPY declines by just over 1%, everyone loses their head and starts talking about CBDC.
Moving on to the ‘knee-jerk’ sector for the day, let’s look at the miners and specifically GDXJ.
Junior Miners GDXJ, Daily Close
Admittedly, the prior update was unsure whether or not this sector had its up-thrust reversal ‘test’.
Note: Posts on this site are for education purposes only. They provide one firm’s insight on the markets. Not investment advice. See additional disclaimer here.
Gold’s reversal or potential for reversal, has already been covered here, here and here.
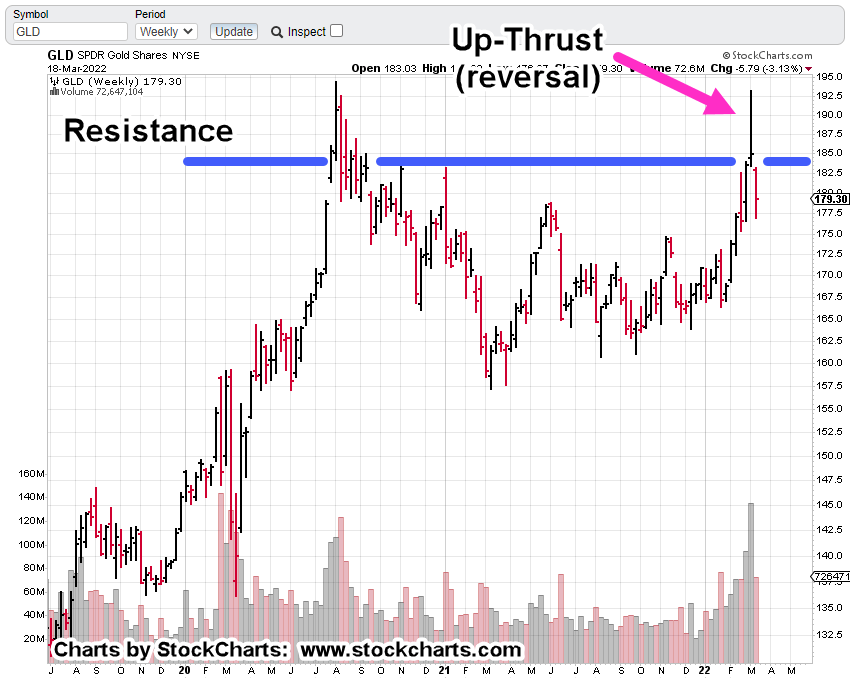
We’re going to focus on the Junior Miners GDXJ but start first, with an updated chart of gold (GLD).
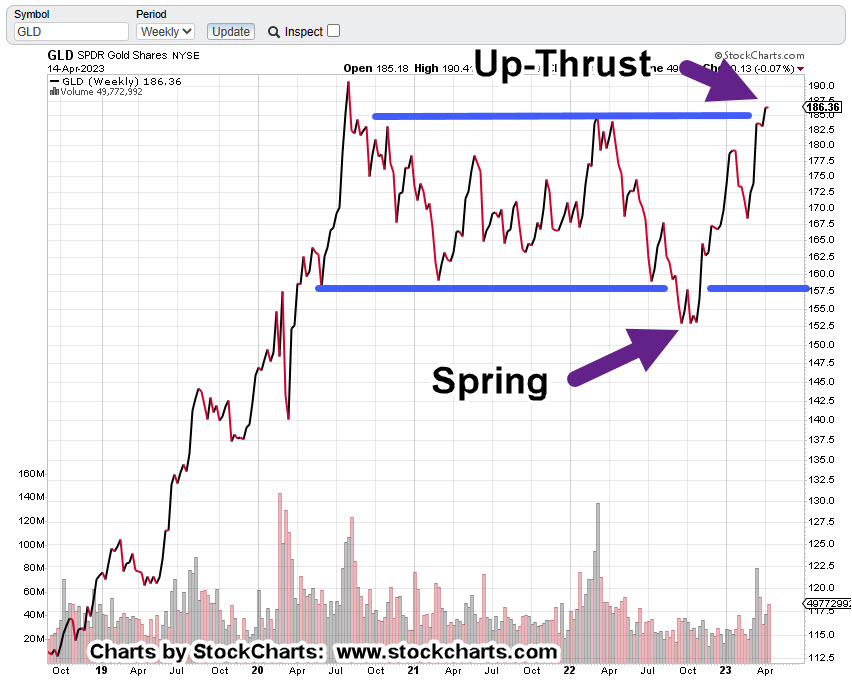
Gold GLD, Weekly Close
This is how it looked back on April 15th.
As of the close yesterday, we have this:
It’s arguable GLD, is now below the resistance line (completing the Spring-to-Up-Thrust) but that’s not the most important part from a trading standpoint.
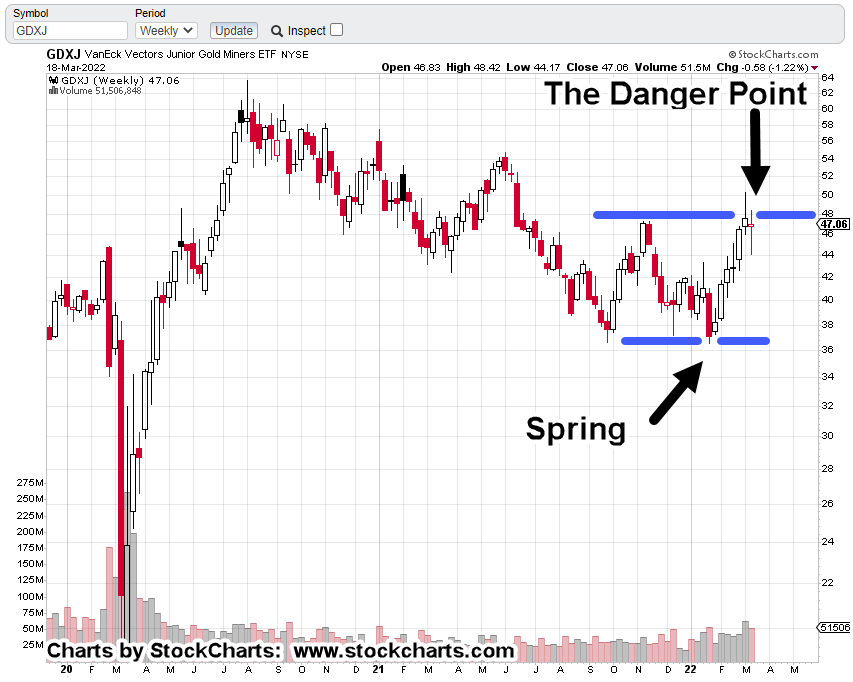
When looking at the Junior Mining Index GDXJ, there’s an ominous pattern.
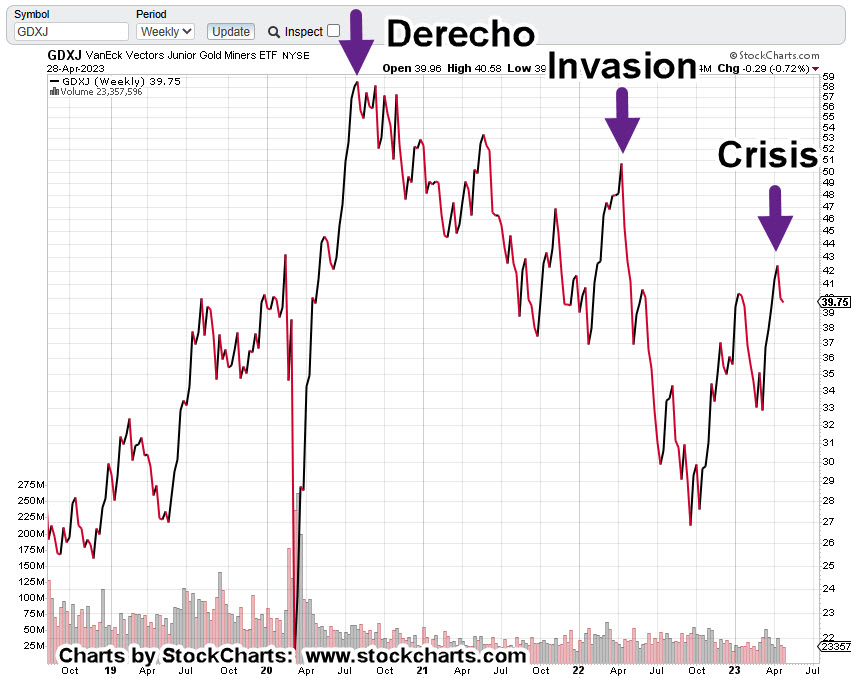
Junior Miners GDXJ, Weekly Close
Each extreme peak over the last three-years has been labeled; the Derecho of 2020, the so-called Ukraine ‘invasion’, and now, the banking crisis.
Note: The SVB bank failure was on March 10th. There was a ‘knee-jerk’ reaction by the public into gold and related components … that peak appears to have stalled at the location shown.
What’s going on is obvious; it’s a bear market.
Each major peak, lower than the last.
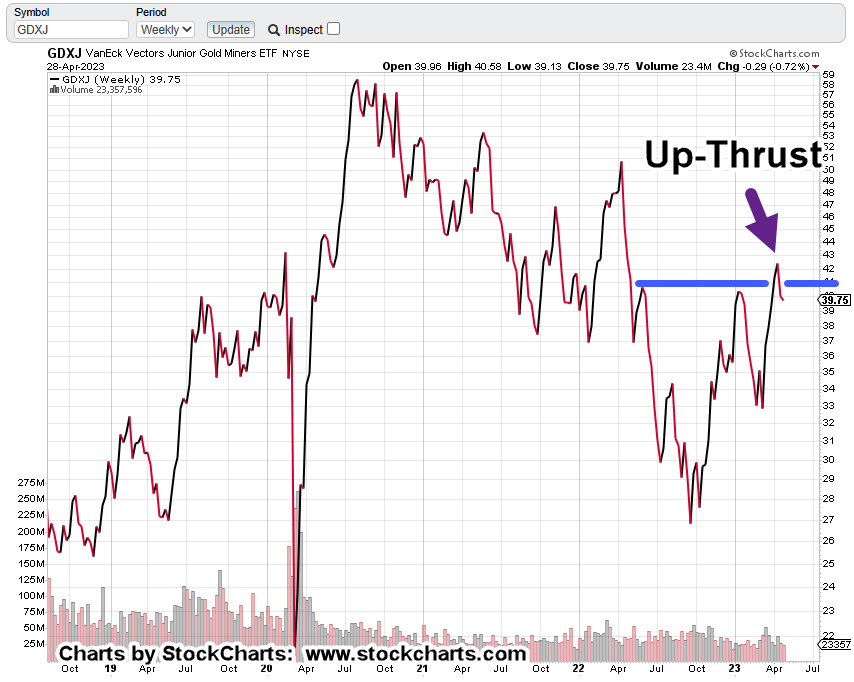
Now, the interesting part.
The Junior Miners are in Wycoff Up-Thrust condition.
In this case, price action’s solidly below the resistance line.
Looking at the daily (not shown), there may have been a ‘test’ of resistance this past week for a move higher; if so, it failed and GDXJ closed slightly lower.
Summary & Positioning
So, here we are: The market (SPY) has rallied over the past week, giving the illusion that all is well.
However, it too is now in up-thrust (reversal) position.
For my business accounts, it looks like being short the miners at this juncture is lower risk than being short biotech (not advice, not a recommendation).
Typical short vehicles that could be used (not a recommendation) are DUST and JDST.
As always, anything can happen. If the markets ‘implode’, they might be closed for any number of days or weeks.
Note: Posts on this site are for education purposes only. They provide one firm’s insight on the markets. Not investment advice. See additional disclaimer here.
Note: Posts on this site are for education purposes only. They provide one firm’s insight on the markets. Not investment advice. See additional disclaimer here.
As said in this update, the historic short-squeeze, while damaging to account P/L, was a huge public service.
This chart confirms the majority of short-positions have evaporated. Meaning, the potential fuel for relentless upside (from those shorts), is no longer there.
That fact is being mirrored in price action as we speak.
As covered above, two markets are hanging by a thread: biotech and real estate.
Both are bubbles on a world-wide scale, but biotech is the one that may affect all others.
Biotech SPBIO, Inverse LABD
As this post was being created, biotech leveraged inverse fund LABD, has just printed (as of 12:40 p.m., EST) outside-up; also known as a ‘key reversal’.
The daily chart is below.
LABD, Daily
To make it an official outside up, price action will need to close above yesterday’s close (LABD: 17.87).
We’ve already shown that SPBIO, price action has formed a huge bear flag lasting more than eight weeks.
Action from the past three days can be considered a Wyckoff up-thrust as well.
Now, we have a potential key reversal.
If so, this market may be in serious downside trouble.
Positions: (courtesy only, not advice).
Yesterday, JDST-22-05, was exited at 9.0341, with a loss of – 1.45%, so that focus (and capital) could be directed to biotech, SPBIO and inverse LABD (not advice, not a recommendation).
Note: Posts on this site are for education purposes only. They provide one firm’s insight on the markets. Not investment advice. See additional disclaimer here.
In fact, Wyckoff’s stock market training course, first published in 1934, (still available), says that until you can ignore the financial press completely, ‘You will never be successful in the markets’.
Price action itself, properly interpreted, will tell you where to look for the opportunity.
The Ponzi Implosion, Cometh
The market is littered with Ponzi schemes. Some have already imploded, CVNA, HOOD, Crypto; some have not.
Concerning Crypto, here’s an excellent update from Michael Cowan. Buried in that update, at time stamp 4:58, looks like HOOD, may be in even more trouble.
Biotech is in a class of its own and was discussed in yesterday’s update.
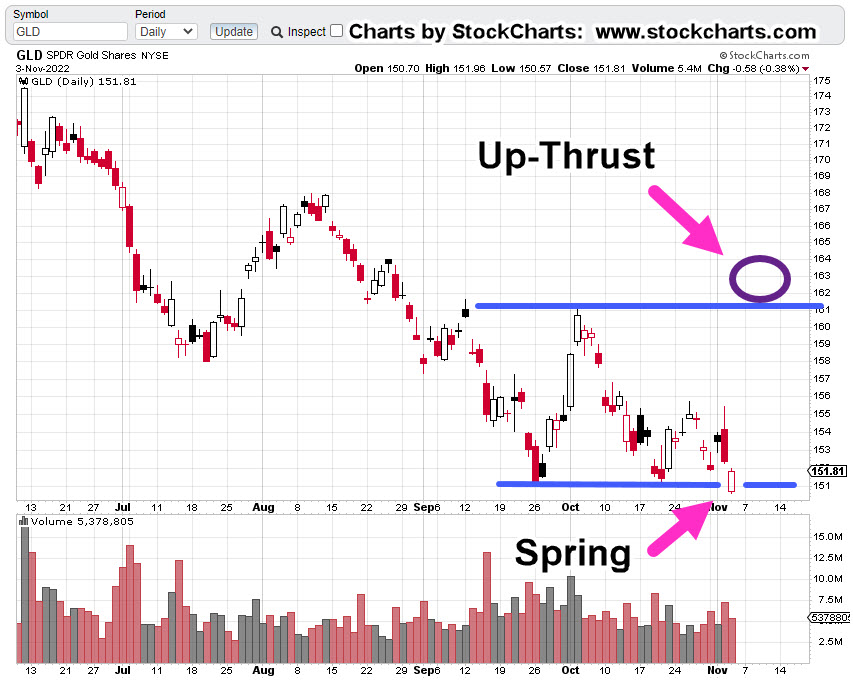
For gold, we’re going to look at the Junior Miners GDXJ, and last week’s action.
Junior Miners GDXJ, Daily Close
The Junior’s are the weakest in the sector; therefore, that’s where we look for a short opportunity (not advice, not a recommendation).
To move higher, above resistance, normal market behavior, is to come back to the lower blue line (i.e., support) to gain enough energy to move higher for a breakout.
To move lower, normal market behavior, is to come down to the lower blue line as a test which subsequently fails; the move continues lower.
Either way, normal behavior at this juncture, is to move lower. We’ll see.
Now on to the chief cook and bottle washer … Tesla.
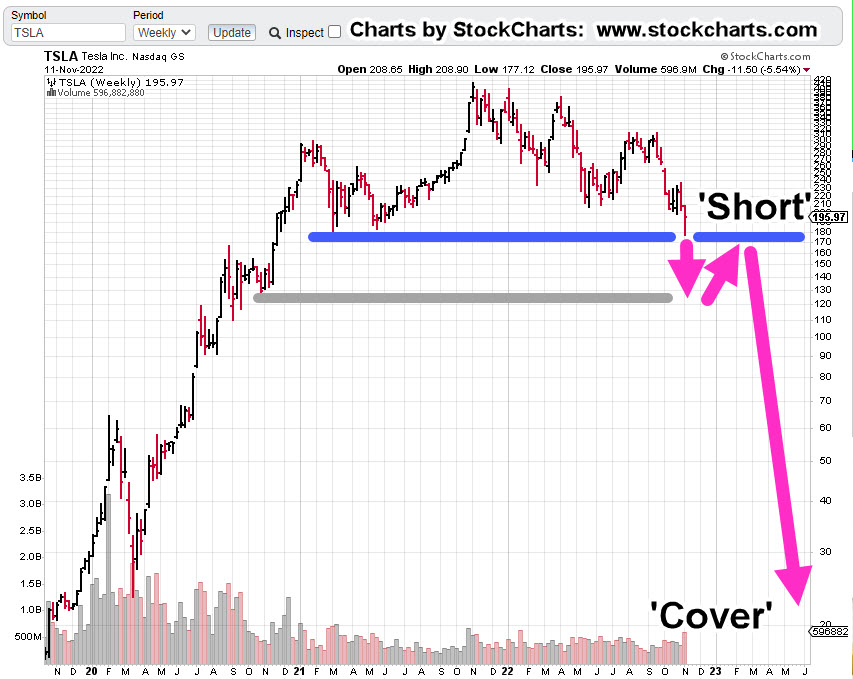
Tesla (TSLA), At The Edge
For starters, let’s recognize there’re a lot of moving parts; U.S. ‘parts’ and China ‘parts’.
If one’s going short, another task is to forecast under what conditions a short would have enough risk removed.
For that answer, oddly enough, we go to gold, GLD.
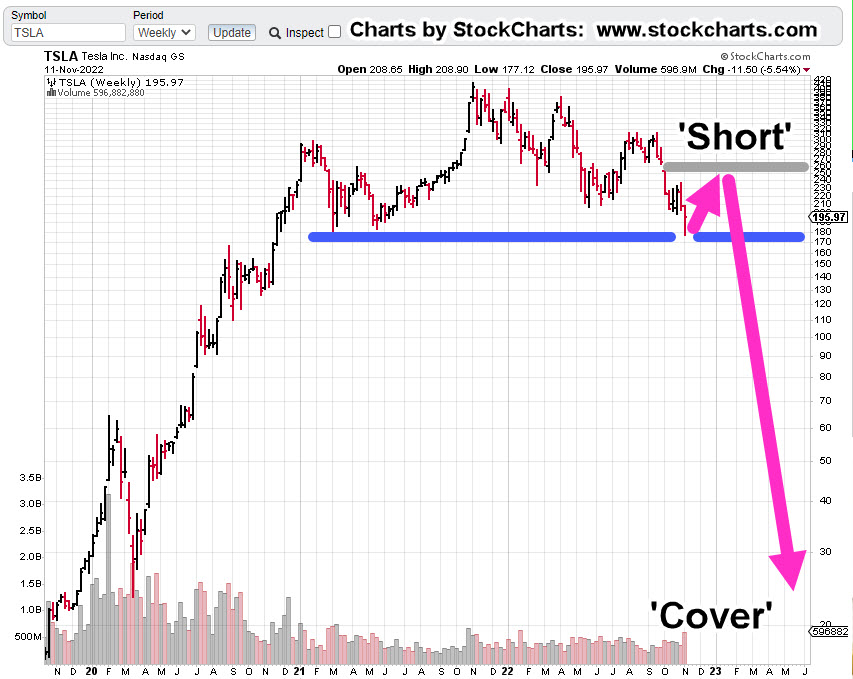
Gold GLD, Weekly: 2015 – 2017
GLD posted a massive upthrust above the blue line lasting over fourteen weeks before breaking decisively lower.
Then, it labored four weeks to come back up for a test.
After that, collapse; lower weekly closes for seven consecutive weeks.
In the chart above, the area identified as ‘Short’, has as much upside risk removed as possible, right at resistance.
Now on to Tesla.
Tesla TLSA, Weekly
Two scenarios are presented where risk may be reduced.
Chart 1
Chart 2
One of these may happen or neither of them.
Either way, for risk to be reduced, a short entry is needed to be at a known resistance level (not advice, not a recommendation).
Let’s move on to the current positioning.
Positions: (courtesy only, not advice).
One of three events will happen at the next session.
1: Both positions stopped out
2: One position stopped out
3: No positions stopped out
Each outcome will provide a data-point where to focus (or not) in the current environment.
LABD-22-10:
Entry @ 18.1398: Stop @ 16.83
JDST-22-05
Entry @ 9.1666: Stop @ 8.79
Note: Positions may be increased, decreased, entered, or exited at any time.
Note: Posts on this site are for education purposes only. They provide one firm’s insight on the markets. Not investment advice. See additional disclaimer here.
The market itself is telling us it’s not going to be ‘well behaved’, possibly for years to come.
According to Goldman, link here, we’ve just had the largest short squeeze on record.
Friday, must have pushed it over the edge from the previously reported, ‘third largest‘.
The ‘Pontificators’
Everybody think’s they’ve got it figured out; We’re going to have stagflation, no wait, hyperinflation, no wait, inflation/deflation simultaneously, no wait, dollar collapse, no wait, gold to the moon, no wait, and on it goes.
What we really have, which is obvious to those ‘awake‘, is something that’s never happened before.
That ‘something‘ is here every day, multiple times a day.
Flash Crash, 2010
Every so often just as a reminder, this event is posted as an example; until that day, it never happened before either.
“Paper comes in, a big seller!!!”
‘Paper’ is essentially anyone (banks, hedge-funds, institutions, and/or retail) outside the pit. Those in the pit are called ‘locals’.
Positioned At The Extreme
The largest short squeeze in history has actually performed a public service; the markets are at extremes.
With that, the short position in Junior Miners GDXJ, has already been discussed, link here.
We’re going to move on and talk about the elephant; more specifically, biotech SPBIO.
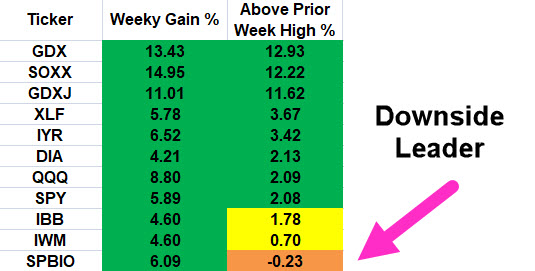
Biotech SPBIO
The table shows last week’s action when compared to the week prior. All major sectors had solid gains but it’s the right-most column that’s of interest.
The right-side column shows how far price action closed above the prior week’s high.
Once again, biotech shows overall weakness. It gets more interesting when looking at the weekly chart.
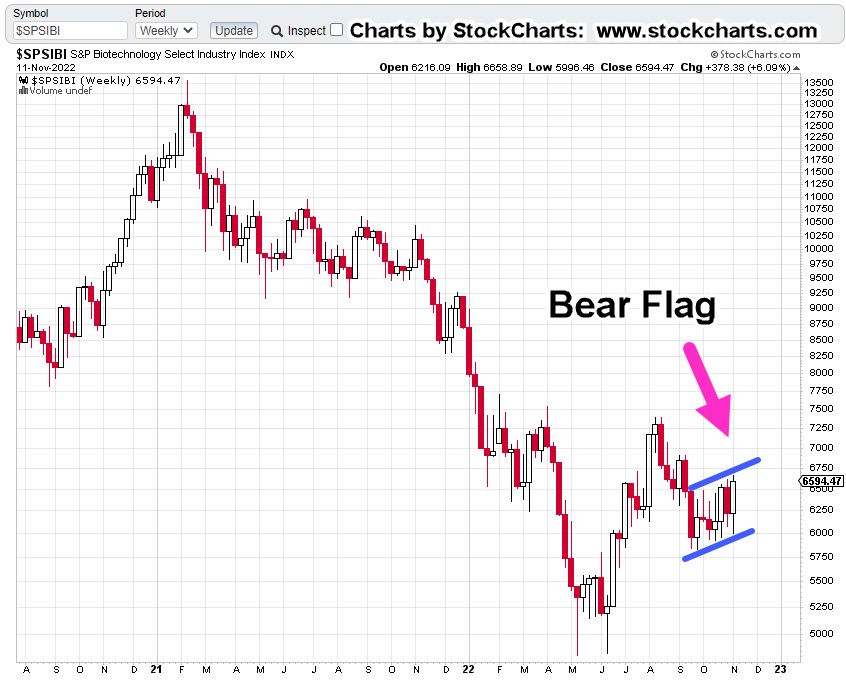
Biotech SPBIO, Weekly
It’s been three successive weeks of apparent up-thrust reversals that were negated each time.
Looking at the weekly below, what we have, is a huge bear flag that just so happens to be, Fibonacci 8-Weeks wide.
It’s possible, this congestion area is the mid-point of the overall move from the highs set during the week of February, 2021.
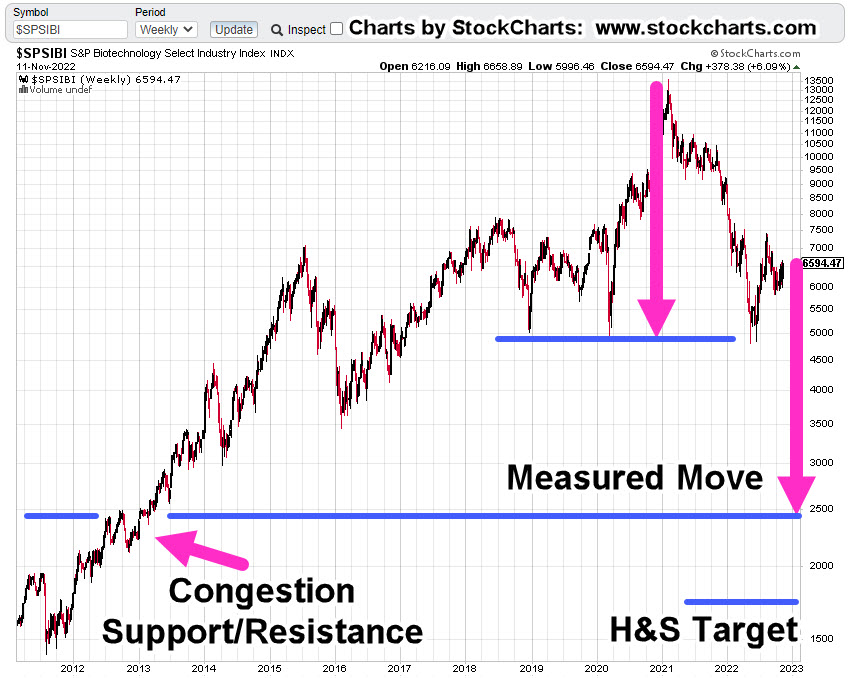
Compressing the chart and putting in a measured move target gives us the following.
If we have an actual Head & Shoulders top, that target is shown as well.
Either way, the downside potential is enormous; thus, requiring intense focus from a Wyckoff standpoint, i.e., during a bear market, identify the weakest sector for short opportunities (not advice, not a recommendation).
All of which brings us to positioning.
Positioning
On Friday, a discretionary exit was made from the entire LABD-22-09 position as (LABD) price action continued to decline with no end in sight.
Loss on the LABD-22-09, series was a drubbing of -12.2%
Then again, last week was the largest squeeze in history; taking that into account, the loss wasn’t -30% or -50%.
As the trading day progressed, LABD price action continued lower until low-and-behold, it reversed.
Once again, a position was entered (not advice, not a recommendation) but this time was different. Frist off, initial position size is smaller; about 60% smaller.
Secondly, the stop is an actual order that’s in the market (shown below).
Sounds obvious but we’re dealing with unprecedented times and market disruptions. Recall during the Flash-Crash of 2010, Kimberly Clark, or Colgate (if memory serves) went ‘no-bid’ and printed i.e., sold for 0.01.
That low print remained on the charts for years until it was ultimately removed.
If it can happen on the downside (i.e. when long), it can happen on the upside as well (when short).
Positions: (courtesy only, not advice).
LABD-22-10***:
Entry @ 18.1398***: Stop @ 16.83***
JDST-22-05***
Entry @ 9.1666***: Stop @ 8.79***
Note: Positions may be increased, decreased, entered, or exited at any time.
Note: Posts on this site are for education purposes only. They provide one firm’s insight on the markets. Not investment advice. See additional disclaimer here.
The day after the third largest short squeeze in market history, we have marginal new daily highs.
Gold was one of the markets that made news this week with it ‘leaving the station’. 🙂
Let’s take a look at gold (GLD) and how I used its message to position short (not advice, not a recommendation).
Gold (GLD) Daily
First, we’re going to re-print the original analysis below from November 4th.
And now, the result
We’re right at the edge. Any higher and it could be bona fide breakout.
The miners rallied in kind.
Senior Miners, GDX, is in an up-thrust of its own (not shown) along with the Juniors GDXJ; being a weaker sector it’s extended but not able to push as high as GDX.
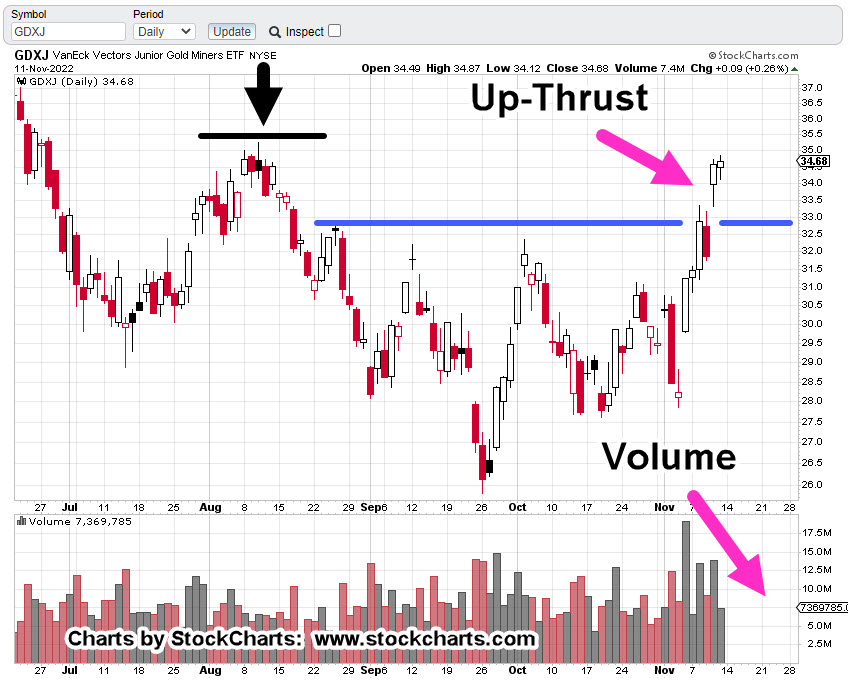
Junior Miners GDXJ, Daily
Note the black line and arrow.
Seniors, GDX, was able to penetrate this area on its own chart but GDXJ, has not (so far).
This gives us an extra layer of resistance for a short position (not advice, not a recommendation).
We can add to that as noted, it was the third largest squeeze in history and today was slightly higher … so what else is there? Risk has (nearly) been squeezed out.
About an hour after the open, a short was opened using GDXJ leveraged inverse fund JDST; JDST-22-05.
Position details and stop locations are to be provided in the next update.
Note: Posts on this site are for education purposes only. They provide one firm’s insight on the markets. Not investment advice. See additional disclaimer here.
Every market has its own personality, its own characteristics.
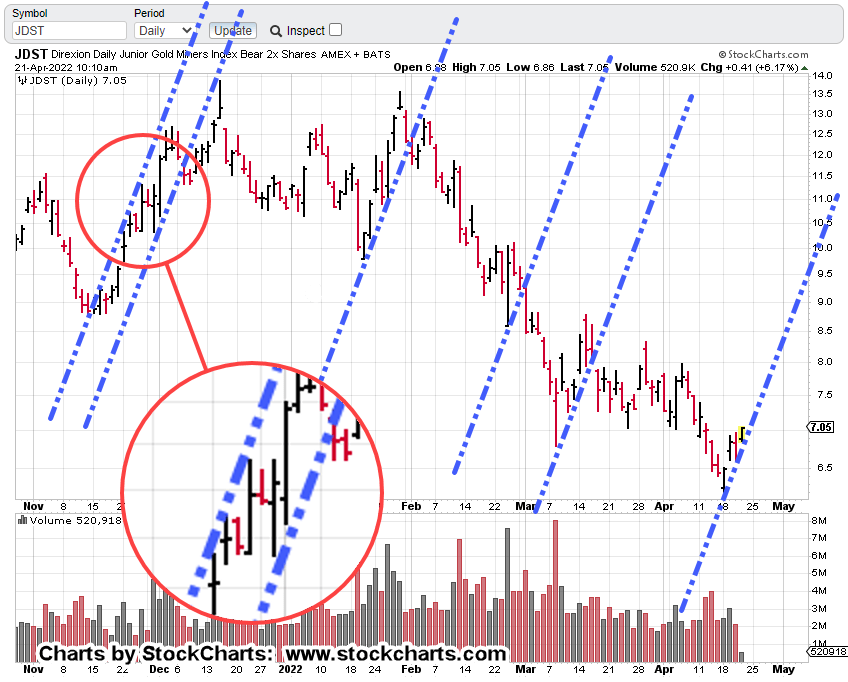
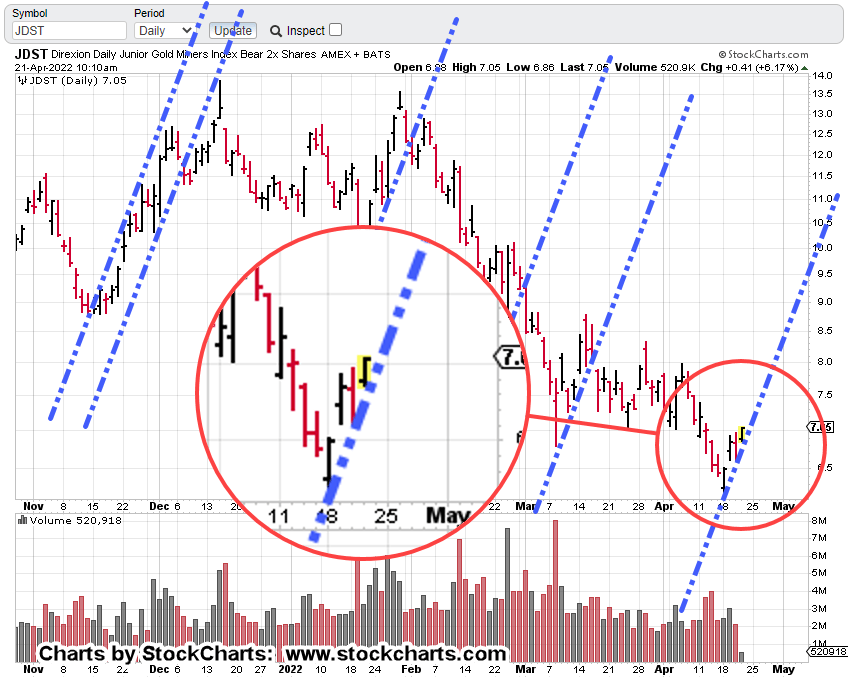
After working the gold mining indices GDX, more specifically GDXJ, a repeating trendline tendency was observed in leveraged inverse, JDST.
That repeating market behavior, shown below.
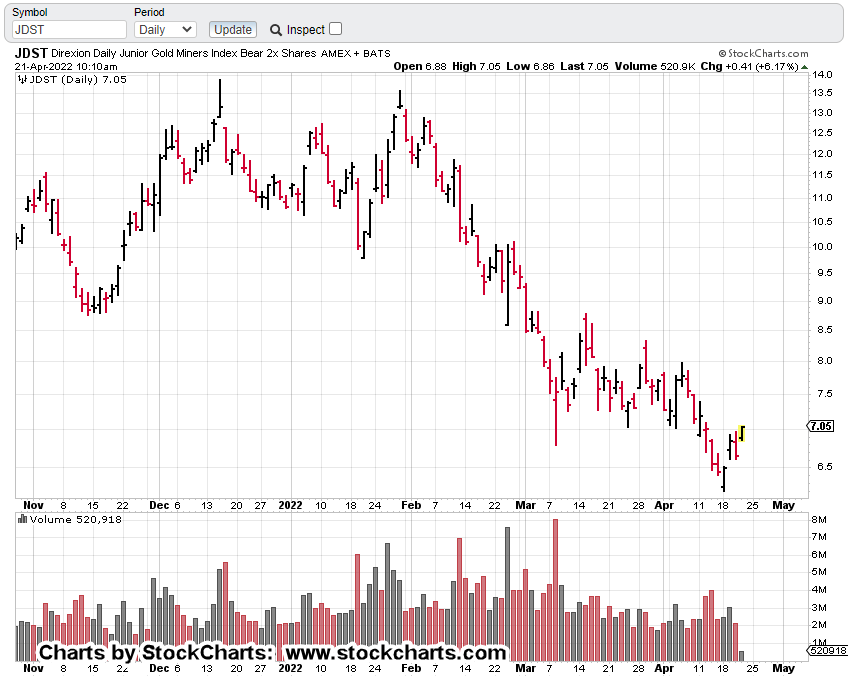
Junior Miners, Leveraged Inverse, JDST
The un-marked daily chart, first
Repeating trendlines
The next several charts zoom-in on specific areas.
Set The Stop
And walk away …
As the tagline in this post shows with JDST-22-04, we’re already short the Junior Miners via JDST (not advice, not a recommendation).
The current stop, is set at yesterday’s low of 6.61.
Depending on price action today, that stop will be moved up to the recent low (presently @ JDST 6.855).
Summary
GDXJ, reversed at Fibonacci 55-Days, 13-Weeks from the January 28th, low.
As presented in this update, we’re also Fibonacci 89-Weeks (+1), peak-to-peak.
Time correlation coupled with price action, along with incessant financial press ‘gold standard‘ narrative, gives a near perfect backdrop for a significant downside reversal.
The trade may or may not work out … price action is the final arbiter. However, we’ve already shown the trend characteristic of the market.
A simple but effective way to manage the trade is to follow that trend, raise the stop accordingly and exit when stopped out (not advice, not a recommendation).
Note: Posts on this site are for education purposes only. They provide one firm’s insight on the markets. Not investment advice. See additional disclaimer here.
All it might take, is one major ‘Carrington Event‘, Coronal Mass Ejection to rip the mask off Crypto; just as this link has done with the truth of ‘The Speck’ protection.
From a predictive programming standpoint, it’s interesting the typical symbol for crypto, the most popular ‘Bitcoin’, is colored gold.
Which brings us to the actual chart of gold (GLD).
Gold (GLD) Weekly
From a Wyckoff, tape-reading approach, we have to trust what the chart is telling us.
That is, gold has reversed.
Earlier posts on gold and the miners have effectively stated, there’s no more ‘fear’ to be had save an outright nuclear detonation.
If that happens, it’s doubtful that anyone will be running to the gold market for protection.
Does everyone have Potassium Iodide tablets? If there’s an ‘event’, they’ll be worth their weight in gold (literally).
The Noose Tightens
Constriction, elimination of the food supply (along with everything else) continues and is accelerating.
Fortunately, or unfortunately depending on perspective, we’re watching a potential major opportunity unfold.
That is, the opportunity to acquire hard precious assets when (nearly) everyone else liquidates.
Gold to Crypto
Is that even possible?
Would gold (and miners) be sold off to buy Crypto?
According to Kyle Bass in the link above, it’s already happening and has been for a while.
From a ‘beast system’ standpoint, it makes perfect sense, going from the pure (i.e., gold) to man-made, corrupt.
Note: Posts on this site are for education purposes only. They provide one firm’s insight on the markets. Not investment advice. See additional disclaimer here.
Gold (GLD) is hovering near all-time highs but the miners, especially the Juniors GDXJ, are far below.
What better way to show the disconnect than looking at the weekly close charts for both gold (GLD), and GDXJ.
GLD & GDXJ, Combined, Weekly Close
The next chart has been discussed in prior updates but is repeated here for refrence.
The difference is GDXJ’s, now in up-thrust (potential reversal) position.
Junior Miners GDXJ, Weekly Close
Closer in on the weekly candle chart, we have the following repeating pattern, ‘Spring to Up-Thrust‘:
We’re at the danger point where it won’t take much to see if action is to continue higher or reverse.
The case for reversal is shown on the daily below.
Note the energy of the upward thrusts Force Index, is dissipating (black arrow) while the energy on the downward thrusts is increasing.
GDXJ, Daily with Force Index
Summary:
The Junior Miners are not in a bull market and have not been for years.
They never fully recovered after gold’s decline during the 2012 – 2015, timeframe. In the meantime, they may have posted an ‘a-b-c’ corrective (bearish) price action.
Obviously, there have been upward spasms as has just occurred over the past six-weeks.
Now, it appears we’re at the juncture where action has set probabilities to favor a downside reversal (not advice, not a recommendation).
Note: Posts on this site are for education purposes only. They provide one firm’s insight on the markets. Not investment advice. See additional disclaimer here.