How The Game Is Played

Watch the video linked here, to see how veteran trader Richie Naso describes trading false breakouts and breakdowns, showing how to position in the markets.
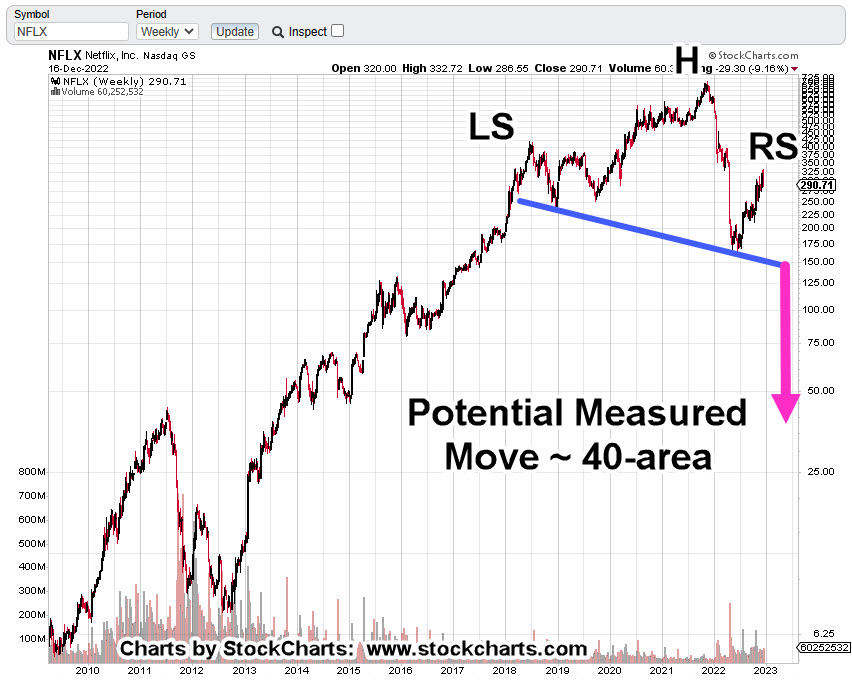
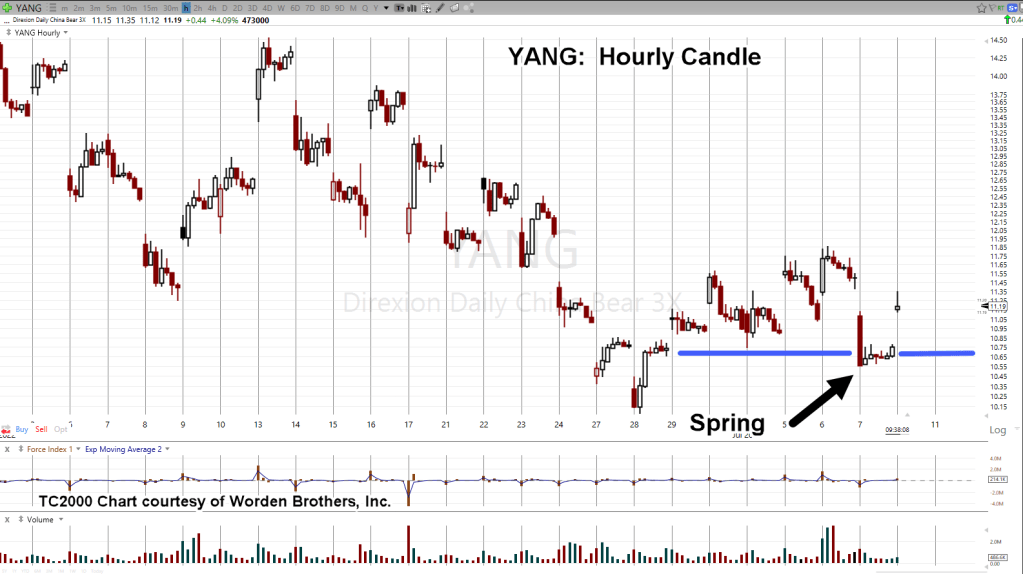
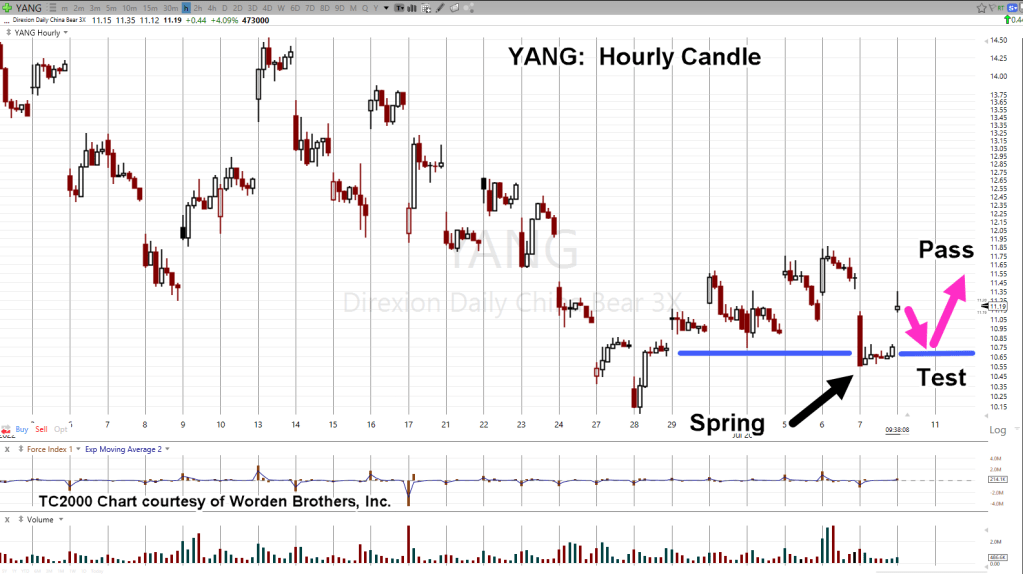
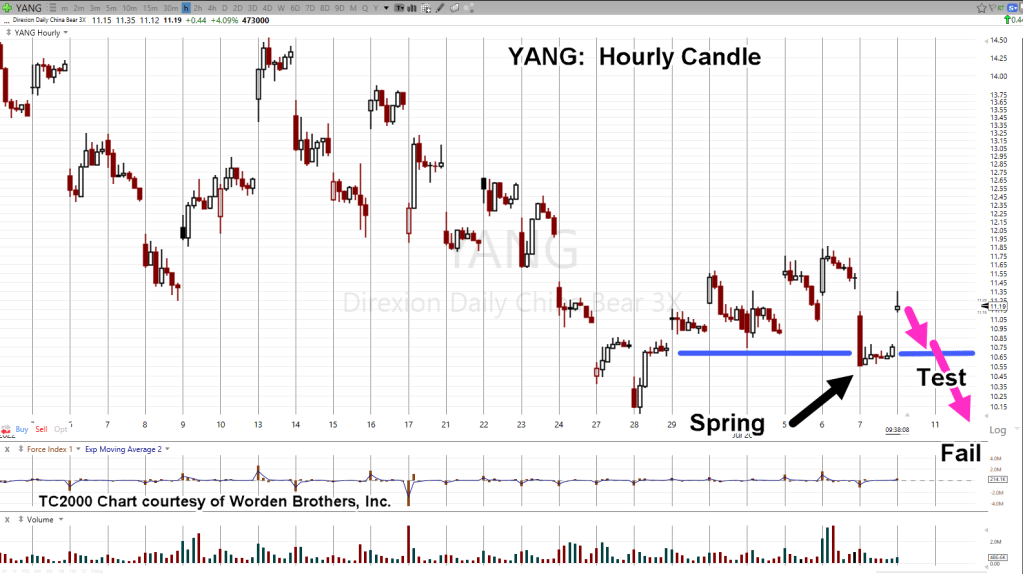
What he’s in effect describing is a Wyckoff Up-Thrust (false breakout) and a Wyckoff Spring (false breakdown).
Then he adds, you have to ‘think like a criminal’ to really understand who is doing what, to whom.
Note: No mention of the Fed, corporate earnings or any other ‘funny-mentals’ as Ed Seykota likes to call them.
Inflation Takes A Holiday
Not for long though.
Neil McCoy-Ward at this link, describes how inflation is coming back (time stamp 21:00).
The Imaginary Friend
We’ve had the markets launch on ‘Imaginary Rate Cuts’ as Uneducated Economist calls them, while in the background, more inflation (i.e., supply destruction) is in the works.
Which brings us to biotech and specifically, SPBIO, $SPSIBI, and XBI.
Biotech XBI, Daily
We may have just had the largest market fake-out (up-move) in history; time will tell.
With all of that manipulation, price action (for biotech, at least) has come back to near prior peaks … but not above.

As this post is being created (3:05 p.m., EST), XBI is starting to back off its intra-day highs.
Internalize It
Referring back to Undedicated Economist, the comment sections of his videos have the usual ‘So, what do I do?’.
His response is a good one.
He says to ‘internalize’ the message he’s presenting. For example, in this case, it’s possibly the biggest market fake-out in history. Then he says you will ‘intuitively’ know what to do (not advice, not a recommendation).
Stay Tuned
Charts by StockCharts
Note: Posts on this site are for education purposes only. They provide one firm’s insight on the markets. Not investment advice. See additional disclaimer here.
The Danger Point®, trade mark: No. 6,505,279