Note: Posts on this site are for education purposes only. They provide one firm’s insight on the markets. Not investment advice. See additional disclaimer here.
Similar to yesterday’s update, showing a wedge pattern for CRWD, we have another (long term) wedge pattern in Agnico Eagle Mines (AEM).
Focusing on ‘strategy’, when market patterns show up, especially in the longer timeframes, we’ll take notice.
Before getting to the chart, here’s a compilation of Richie Naso quotes and insights that have been reviewed over the past week. It’s always good to hear thoughts from a renowned trader.
Note: Posts on this site are for education purposes only. They provide one firm’s insight on the markets. Not investment advice. See additional disclaimer here.
Note: Posts on this site are for education purposes only. They provide one firm’s insight on the markets. Not investment advice. See additional disclaimer here.
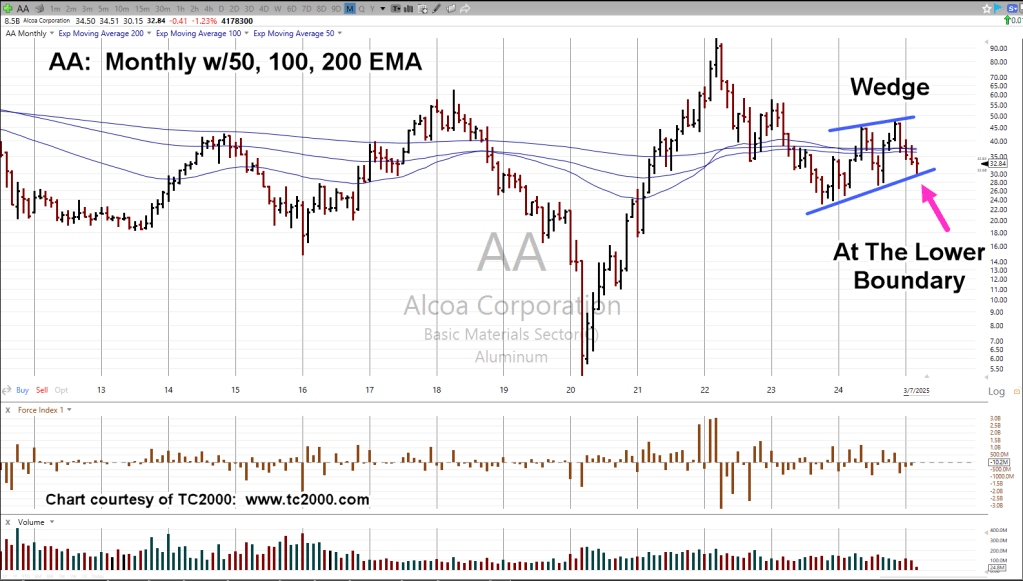
Yesterday, biotech had moving average compression; today, it’s Alcoa.
In this case, we’ll present the monthly chart, showing the long-term picture.
As we’ll see, moving average compression is rare, especially when using the longer time-frames.
In the case of Alcoa (AA), you have to go all the way back to 1978, to find a similar event.
The Big Bubble
Referring to Prechter’s analysis link here, he states that we’re [potentially], in the largest asset bubble since the South Sea, over 300-years ago.
Let’s keep that in mind. Events are happening on such a massive scale; the typical observer may not be aware of the significance and/or the rarity.
Alcoa AA, Monthly
The zoom areas are side-by-side to show the similarity.
Expanding the chart and including the wedge notation, also shows price action at the lower boundary.
It should be noted, AA, is part of the ‘Basic Materials’ sector, with tracking ETF as IYM.
Included in the IYM components, is NEM, and RGLD; this sector is correlated with the miners, GDX, GDXJ.
Positioning
It’s the trader’s discretion as what to do at this point.
This site may or may not execute a direct short of Alcoa, just as it might do with Carvana (CVNA), and maybe others (not advice, not a recommendation).
Note: Posts on this site are for education purposes only. They provide one firm’s insight on the markets. Not investment advice. See additional disclaimer here.
From a price action standpoint, we have an outside down weekly bar as well as (potential) monthly reversal.
Despite fever-pitch, ‘the world’s ending’ talk on gold and (supposed) silver breakouts, we’re reminded here (time stamp 3:10) to expect a downward spike in gold should there be (serious) international trouble (not advice, not a recommendation).
Newmont’s the largest cap in the GDX; let’s take a look at the sector.
Senior Miners, GDX, Weekly
GDX, in the same vein as IWM, NVDA, SOXX, SPY, and TLT (to name a few), posting its own terminating wedge.
Noted in the chart, GDX has entered back into the wedge formation after a ‘throw-over’; typically, a bearish sign (not advice, not a recommendation).
Note: Posts on this site are for education purposes only. They provide one firm’s insight on the markets. Not investment advice. See additional disclaimer here.
As usual, we have the rabid gold and silver bulls, breathless; ‘This is it!’, ‘This is the big one!’, ‘Dollar collapse, imminent!’
All the while, nobody’s reporting the fact, that ever since ‘The Speck’ was introduced in 2019, and of course, Speck ‘protection‘, gold production has dropped to 2014 levels, and has not recovered (source, Statista).
Is it as simple as ‘supply and demand’? Is the ‘inflation’ narrative, just another ruse?
Even as gold and silver are rising (for now), the mining sector’s GDX, GDXJ, are far below their all-time highs.
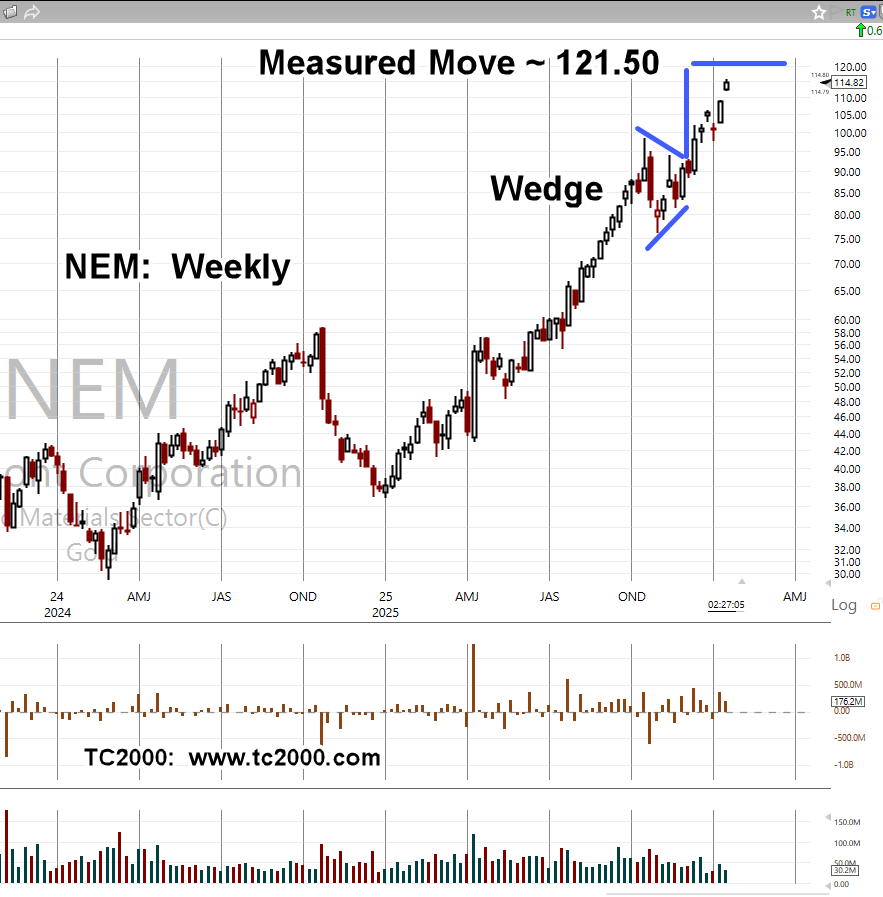
As if to put icing on the cake, Newmont, appears to have reversed (not advice, not a recommendation).
Newmont Mining NEM, Daily (inverted)
Similar to recent biotech analysis, we’re inverting the chart to show the potential.
Note: This ‘inversion’ technique is a psychological exercise covered in one of Dr. Elder’s books (here and here).
It’s a basic fundamental for un-biased analysis.
Back in the day, while publishing on SeekingAlpha (a whole story in itself), users of that site would complain about charts being ‘upside down’. 🙂
Moving on, we have the following:
There’s a lot going on in this chart.
Price action has recoiled off the support (resistance non-inverted) and is now at a point where it may attempt to retrace for a test.
MACD has become successively bullish; now has a crossover signal.
As shown in prior updates here and here, the support level’s in the vicinity of the 23.6%, retrace.
That indicates bullishness on the chart above or weakness on non-inverted (not advice, not a recommendation).
Note: Posts on this site are for education purposes only. They provide one firm’s insight on the markets. Not investment advice. See additional disclaimer here.
Gold’s near all-time highs, silver’s rebounded, testing recent highs; yet Newmont’s at a paltry 23.6%, retrace.
So, you tell me. What’s likely to happen to Newmont, if gold or silver head back lower, even just a little bit?
That dude in the picture, needs to keep on diggin’. 🙂
Wyckoff, In-The-Know
Years ago, Wyckoff told us not to pay any attention to the financial press, the local circus.
However, that does not mean he didn’t know what was going on. He did, and sometimes down to the penny.
We don’t know for sure what’s (really) happening with Newmont and the mining sector but among other things, it might have something to do with this, this, and this.
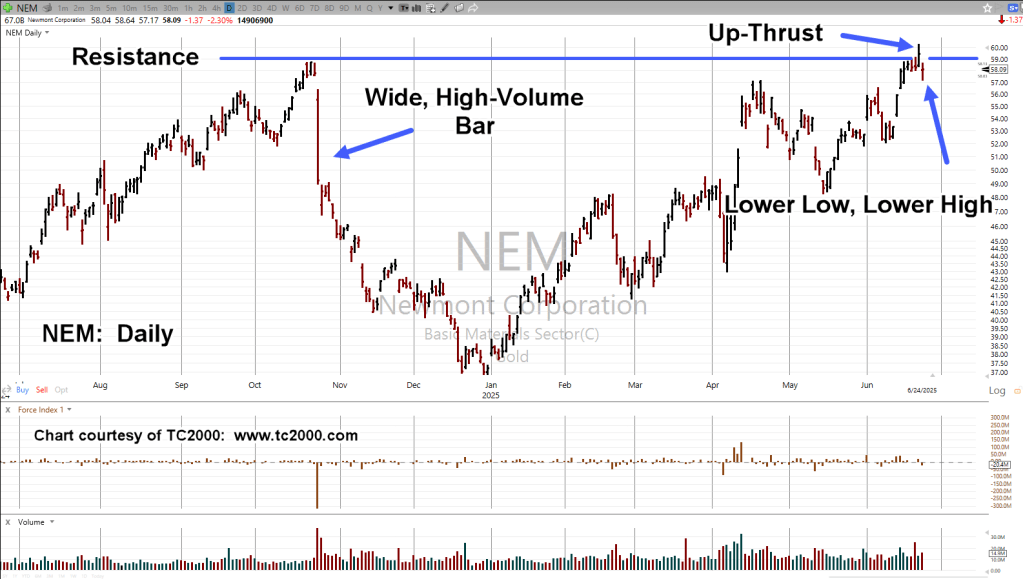
Even so, price action’s the truth; let’s look at our chief cook and bottle washer’s progress since the last update.
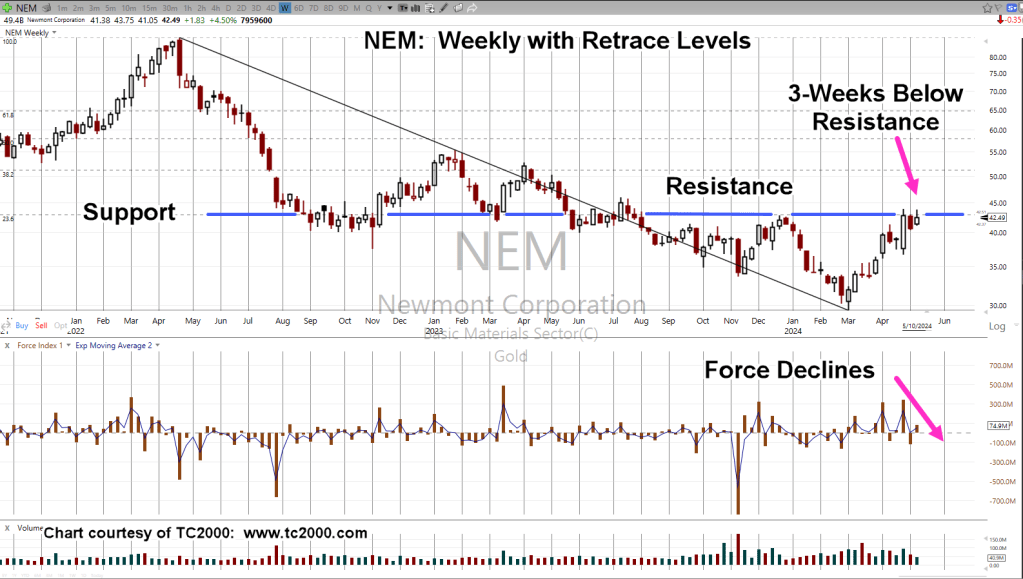
Newmont Mining NEM, Weekly
The chart has expanded the Force Index (middle panel) for better clarity.
Going back to the last update, it had this to say:
“A reasonable expectation is NEM, retraces, testing the wide bar and volume before continuing to the downside or moving back higher to a breakout.”
Price action has done exactly that. It came down to test the wide (4/25/24) bar and then back up to resistance, where we are now.
The only thing missing at this point, is the breakout or reversal (not advice, not a recommendation).
Show Me, The Money
Anyone with two Latte’s rubbing together, knows the economy may (already) be in full-blown collapse.
Anecdotal (and factual) evidence of that can be found here, here and here.
Adding, Nemont itself is not doing well as evidenced by this recent (February) article about dividend cuts, asset sales.
Note: Posts on this site are for education purposes only. They provide one firm’s insight on the markets. Not investment advice. See additional disclaimer here.
If there’s one market attracting huge numbers of grifters, carpetbaggers, peddlers, and all-around crazies, it’s precious metals.
I’ve been hearing from this crowd, ‘the government’s going to collapse, the dollar’s going to collapse’, since the early 1980s.
As said many times before, I like precious metals as much as the next guy.
However, from a strategy standpoint, with each passing day, we see it’s the food supply (here, and here) that comes first (not advice, not a recommendation).
What’s currently taking place is so much more complicated (in my opinion) than just ‘stacking’.
Let’s not forget the flood of ‘fake’ or ‘diluted‘ precious metals and other chicanery; like having your coin-shop bank account closed for no apparent reason.
Well, we have to keep the loonies on the path which brings us to our case in point, Newmont Mining, NEM.
Newmont, Good News is Bad News
Gold price has moved higher over the past four to five months and expectedly, that’s been noted in Newmont’s latest Quarterly release, link here.
NEM, stock price at ‘nine-month highs’, what’s not to like?
It’s when we look at the chart, we see a different story.
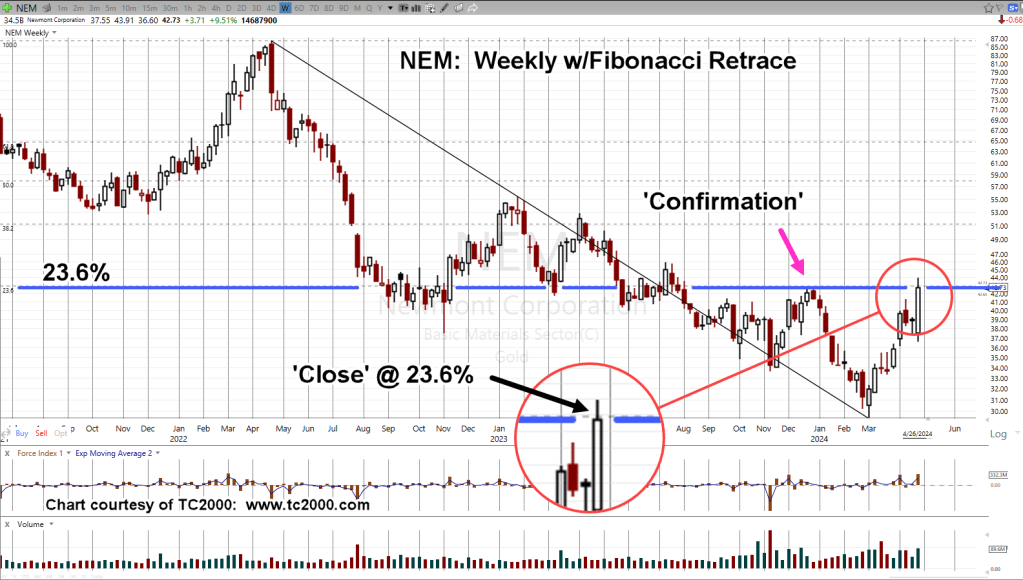
Newmont Mining, NEM, Weekly
After all the ‘good news’, NEM has only retraced an anemic 23.6%, of its overall downside move.
Note the close on Friday was right at the 23.6% level, giving it even more significance.
This level has also become an ‘axis line’ as exhibited by price action going back to August of 2022.
By The Numbers
When looking through the major sectors, retrace (and reversal) from 23.6%, is becoming more frequent.
Two other indices posting and reversing from that level (measured from recent highs), are biotech XBI, and real estate, IYR.
NEM, What’s Next?
Thursday, 4/25, was a wide bar with heavy volume.
We’ve stopped at the retrace, which is also resistance, confirmed by price action in late December. ’23.
A reasonable expectation is NEM, retraces, testing the wide bar and volume before continuing to the downside or moving back higher to a breakout (not advice, not a recommendation).
Note: Posts on this site are for education purposes only. They provide one firm’s insight on the markets. Not investment advice. See additional disclaimer here.
Note: Posts on this site are for education purposes only. They provide one firm’s insight on the markets. Not investment advice. See additional disclaimer here.
Like a movie script, price action will play with your emotions.
As Richie Naso says, that’s what the market’s designed to do.
The miners GDX, GDXJ, launched higher over the past four trading days, giving the impression that, ‘this could be it, the big move’; however, the truth, the price action itself, tells a different story.
Let’s look at one of the big caps in the sector, Newmont.
Newmont Mining NEM, Daily
Newmont has pushed past known resistance (magenta line) straight into the 38.2% retrace area.
When this type of breakout occurs, it’s called Wyckoff ‘Up-Thrust’ position; that is, a potential false breakout.
When we have the largest bubble conditions in market history, there may be no safe place to hide … that could include the miners as well (not advice, not a recommendation).
Note: Posts on this site are for education purposes only. They provide one firm’s insight on the markets. Not investment advice. See additional disclaimer here.