Intel … Off the Cliff

Four-Year Top

Kick-Off … To The Downside

A massive four-year top, along with the latest ‘road-map‘, has this one going down; most likely, for good.

While other chip makers, have gone to near stratospheric levels such as Nvidia, with its 23,960% gain from 2009, lows, Intel has languished.

The rest of the markets, S&P, Dow, QQQs, have pushed on higher while INTC, has spent the last four years, in a trading range.

A sideways market is a bear market.

Intel never recovered its luster after the Dot-Com mania of the 2000s. Price action spent eight years heading sideways-to-down before bottoming out in early 2009.

After that, it’s been a long struggle to current levels.

Now, the markets have reversed and the economy’s collapsing. We’ve likely seen market highs that won’t be repeated in the lifetimes of anyone reading.

Friday’s announcement may be the kick-off for sustained price action to the downside.

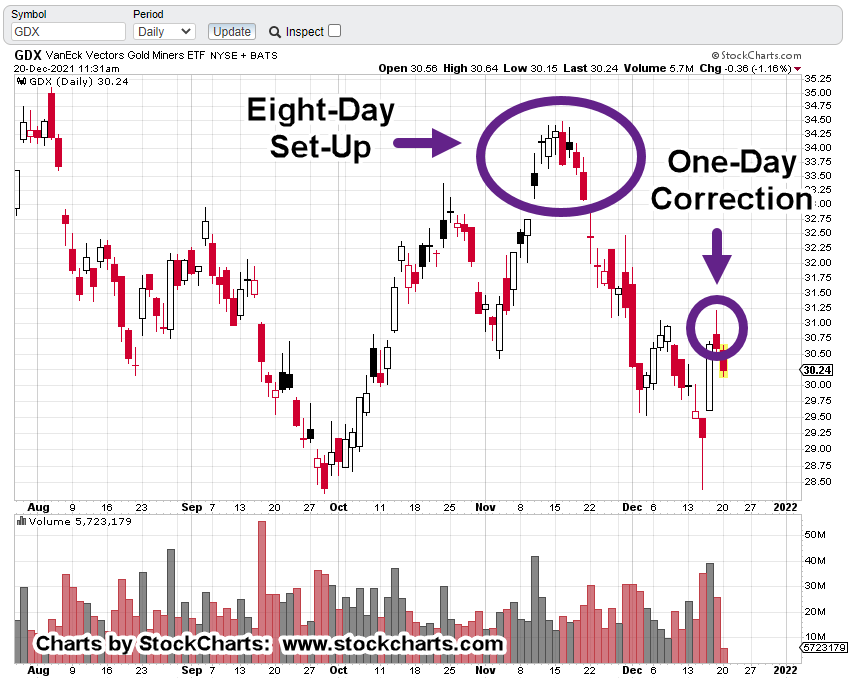
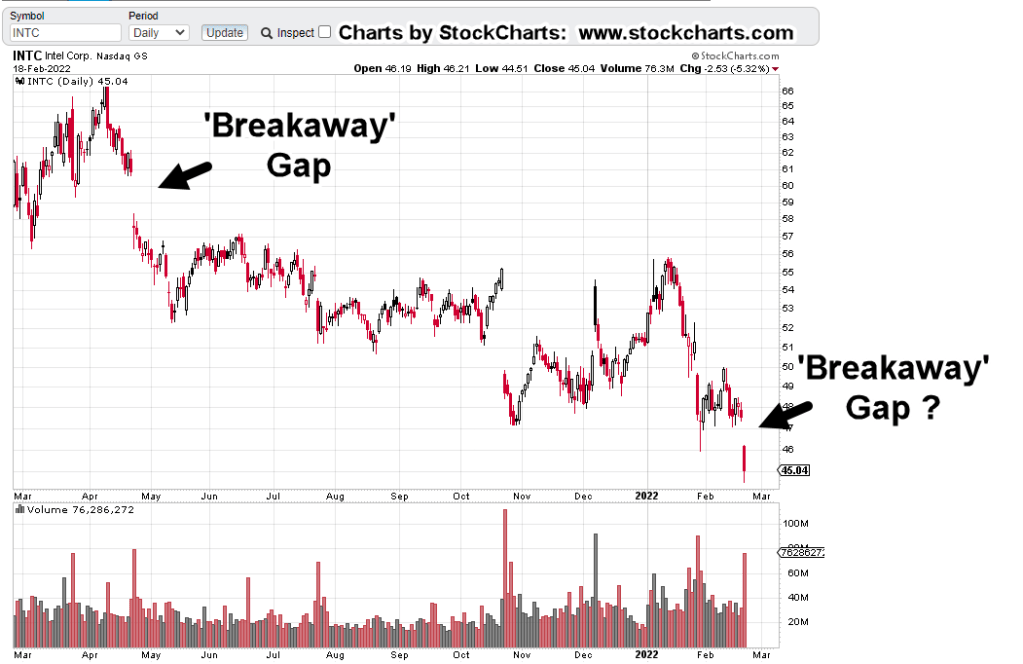
INTC, Chart Analysis

The daily chart shows at least one breakaway gap and possibly two.

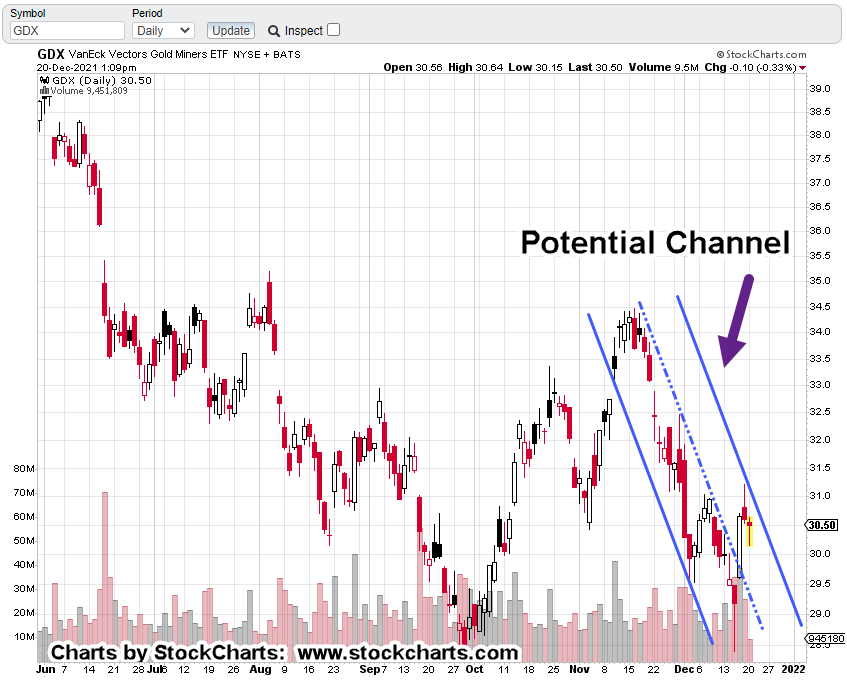
The next chart is on the weekly timeframe and identifies the long, multi-year, topping pattern.

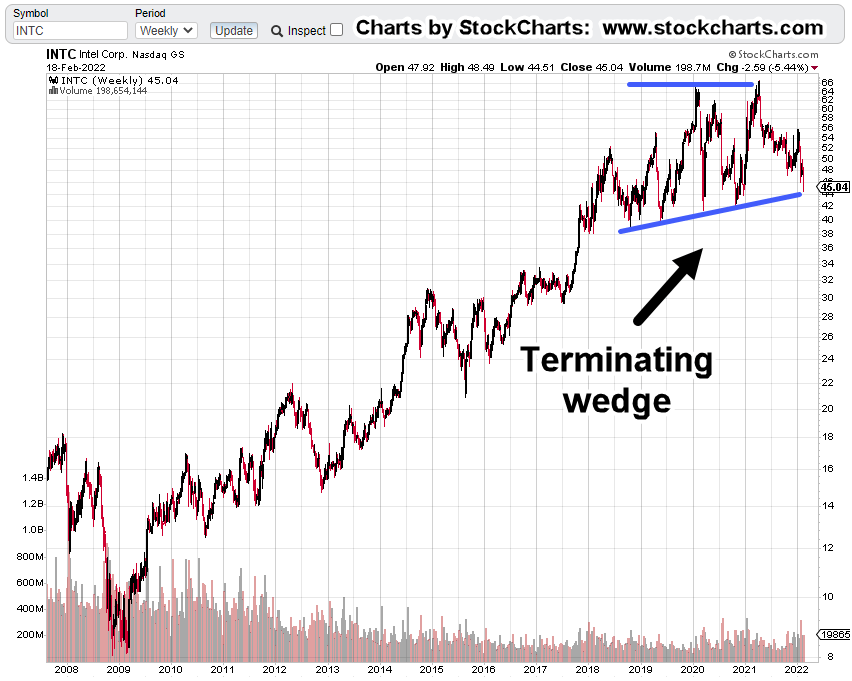
When looking at these patterns, be reminded about the scale of what’s happening.

This wedge is massive … at least four years in the making.

Note: Price action finished the day right at the lower support. There could be a rebound on Tuesday (market’s closed Monday) or we could just keep going lower.
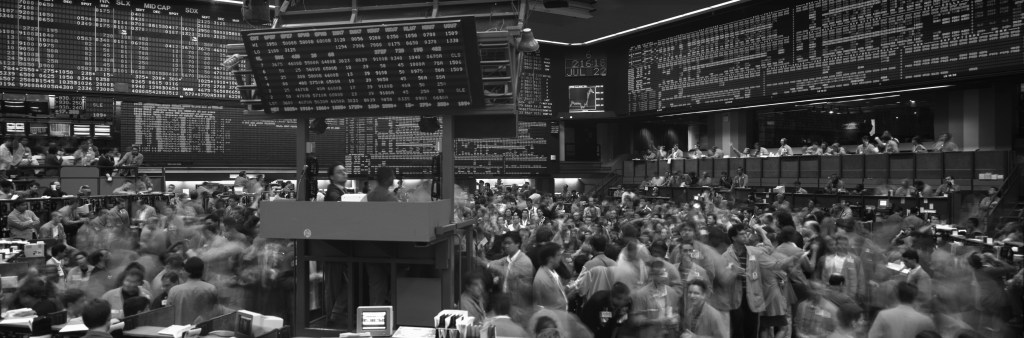
The SOXX Connection

Intel’s fifth in market cap of the SOXX, with Taiwan Semiconductor (TSM) at the top of the list.

Even the leader TSM, may not be immune to trouble.

Here are Fab locations for Taiwan Semi, located just off the coast of mainland China … nothing bad going to happen there, right?

And then, there’s this:
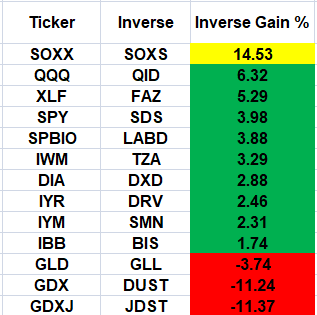
The SOXX, Drops

The SOXX, has been analyzed using Elliott Wave and Wyckoff.

Each method indicated potential for reversal.

In the case of the ‘wave’ analysis, if it proves correct, we’re possibly in for a sustained ride lower.

The daily chart of SOXX, shows each analysis point where a reversal lower was projected.

It’s clear from the chart and documented links, both methods nailed it … to the day.

Elliott was earliest and caught the exact point of inflection.

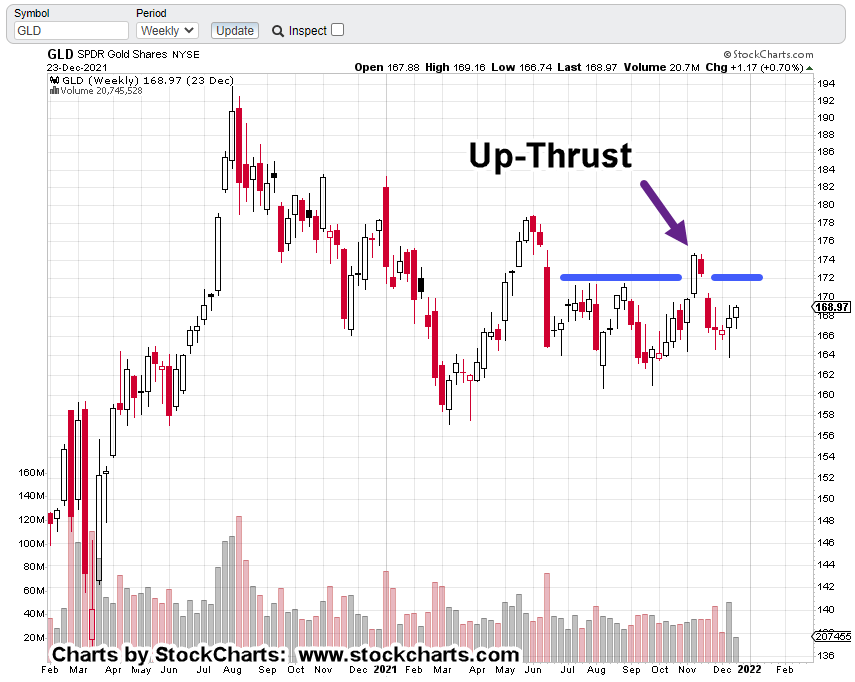
Wyckoff caught the test of the up-thrust.

Here’s the important part:

Wyckoff is a practical, bread and butter method. It looks at what the market’s saying about itself … is price action showing pressure to the upside or down?

Elliott Wave looks at where the market could be or is going.

If we’re really in an Elliott Wave Three down, it’s likely to be a decline like no other.

There are other indicators not market related, giving us hints, a massive collapse is ahead.

A Decline of ‘Biblical’ Proportions

Warning:

The following contains scriptural references.

Those who are in ‘it’s all a myth and fairy tales’ crowd, feel free to scroll to the ‘Summary‘.

For the rest of us, the secular world calls it ‘systems collapse’. The spiritual world calls it ‘judgement’.

Stated many times on this site, ‘the church’ is corrupt. Here’s just the latest salvo proving that point.

Along with the corruption, we now have the strong delusions prophesied over 2,000 years ago.

In reference to a Stew Peters broadcast, linked here, on the numerous media lies, is this comment (emphasis added):

“The only people to blame for this Stew are the ones who put on the mask, who distanced, who took the shot, who harassed other people and who advocated for my freedoms being taken away. Without doing five minutes of research.”

It’s not too much of a stretch to say, those who voluntarily injected themselves were (or are) in a place of delusion.

“And for this cause God shall send them strong delusion, that they should believe a lie:”

Also said many times, ‘The Speck’ as we call it, is a hoax. It’s a lie. It does not exist.

However, the injections are no lie … but the reasons for those injections are false.

Can this (spiritual assessment) really connect with what’s happening in the markets? How does it relate to actual price action?

Obviously, it can’t and shouldn’t be said that any specific price movement has been prophesied.

However, we can use the scriptural references to point us to the probability of events; the big picture, the situation at hand, the signs of the times.

The probability that we’re at some kind of major inflection point of Biblical proportions, seems exceedingly high.

Summary

Both Elliott Wave and Wyckoff Analysis, support the probability of lower prices ahead for the SOXX.

Because Intel (INTC) has been a laggard in the sector for years, suggests it may be one of the downside leaders.

As if to confirm the assessment we’re past the pivot, that generational highs have been reached, we have this just out, on ZeroHedge.

At the very bottom of the article, is a quote.

No, they’re not quoting from the King James Bible of 1611; they’re quoting from Shakespeare’s Richard III, of 1594.

Stay Tuned

Charts by StockCharts

Note:  Posts on this site are for education purposes only.  They provide one firm’s insight on the markets.  Not investment advice.  See additional disclaimer here.

The Danger Point®, trade mark: No. 6,505,279

.

Herd Behavior … After The Top

Correction, Or Collapse

Structural Damage, SOXX

Even though technical conditions show we’re at least in a correction, if not outright reversal or collapse, record inflows for 2022, vs. 2021, present the herd-driven behavior of the public (and funds), to go long.

According to the link above, flows have been out of bonds and lesser performing equities, into equities that have gone down less.

In addition, you can see some of that flow (not addressed in the article) going into gold and the mining sector.

Stepping Back

Pulling away from charts and indicators for a moment, figuratively closing one’s eyes to get a ‘feel’ for what’s happening, it looks like the following:

We’re in a (potential) massive juggernaut reversal that’s been decades in the making; possibly having origins going all the way back to the ’87, crash, the ’95, bull market and then, repeated bubbles of 2000, ’07, and now.

At this point, it looks like the ‘average investor’ is doing the only thing they know how to do … that is, go long.

Those with at least some market knowledge, just got decisively whacked with their ‘put buying‘ strategy as the market has rallied strongly off the lows.

Pavlovian Panic

We’re witnessing the knee-jerk reactions of a public that’s been conditioned for decades, not to ‘think’, but only ‘do’.

Expect this type of behavior to go parabolic if the markets really do turn lower on a sustained, long-term basis.

Prechter has written extensively about crowds or the herd; especially in his text The Wave Principle of Human Social Behavior.

We can see this visceral behavior real-time, in other seemingly unrelated markets. Two examples below:

First, we had oil futures going negative for the first time in history; then we have LNG tanker rates going negative first time as well.

The model seems to be:

“Everybody wants it, and then, they don’t”.

The crowd runs to and fro, effectively leaderless.

With that said, one can make a case we’re just beginning, or already in an economic collapse; now being followed by the early stages of a market collapse.

Meanwhile, The Elephant Gets Bigger

Let’s not forget the massive elephant that’s just now getting so large, it can’t be ignored (time stamp 2:40).

Recall the example at this link … disparate crowds have a tendency to come to the same decision and modify behavior, all-at-once.

You have to wonder, when that crowd is going to simultaneously press the Sell, button.

Hit, In The SOXX

Unprecedented events are everywhere. That includes the massive, ‘never before seen‘, thrust lower in the SOXX.

The uptrend shown in the weekly chart of SOXX, has been decisively broken and with enormous volume.

The week ending Friday January 28th, saw 16.7-million shares traded … the most ever for the index (ETF).

More detail on trend break

Then, There’s Elliott Wave

Before the ‘Elliotticians’ get miffed by the previous (cookie cutter) comments, here’s this:

When this method works … it’s great.

It provides good projection areas and the useful ‘Fourth Wave of Lesser Degree’, targeting.

Note: A quick internet search for this Fourth Wave method (authored by Prechter) turns up nothing.

Logging onto ‘Club EWI‘, putting in ‘Fourth Wave’ has no items found.

One can try contacting Elliott Wave International, to request a copy of this targeting method. It may still be available (for a price).

The data used by this author to target the 4th wave retrace (shown below), is from a hard copy, dated, 1/8/2003. That information was excerpted from The Elliott Wave Theorist, July 9th, 2002.

First, the 2-Hour chart from Thursday’s update is repeated below with the ‘lesser degree’, added in magenta font:

Getting closer-in on the 4th-wave area below:

It’s subtle and difficult to spot. The price action congestion area is the ‘4th wave of lesser degree’.

Summary:

The previous update showed entry points for what is now SOXS-22-01 (not advice, not a recommendation).

Friday’s price action put this position well in the green; getting it to +24%, based on the close.

The table below are the ETFs being tracked along with the leveraged inverse fund tickers.

The percentage gain/loss, is for this past Friday’s action and shown for the inverse funds.

Obviously, the semiconductors were hit the hardest on Friday and so, SOXS, had the largest gain.

A good stop level for SOXS would naturally be Friday’s low (not advice not a recommendation). If we really are in an Elliott Wave 3, down … price action’s expected to continue its decline with haste.

Stay Tuned

Charts by StockCharts

Note:  Posts on this site are for education purposes only.  They provide one firm’s insight on the markets.  Not investment advice.  See additional disclaimer here.

The Danger Point®, trade mark: No. 6,505,279

SOXX, Downside Reversal

The Elliott Wave, Connection

A couple of things first.

Number One:

This site does not use Elliott Wave as a primary analysis tool.

However, to be aware of the technique, will at times provide an additional edge … like now.

Number Two:

Once again, gold and the mining sector have become unbearable to watch.

The amount of hysteria, hype and bloviation serves to make this market all about ego. Ego is a four-letter word for the professional speculator/trader.

We’re leaving it alone for now and moving on to the market at hand: Semiconductors (SOXX).

Semiconductors, SOXX

On a Monthly basis, the chart below is the entire trading history for the sector:

The next chart zooms into the area(s) of interest.

This market, the semis, had its most powerful thrust lower in January, for the entire history of the sector.

The following chart is where it gets interesting.

Elliott Wave labeling as shown. If correct, Wave 3, down has just started (not advice, not a recommendation).

Warning:

My former mentor, the late David Weis, who once worked for Prechter, said the approach is a “cookie cutter” (his words) attempt to force the markets into a pre-defined construct.

With that caveat in hand and the understanding the ‘wave’ could fall apart at any time, let’s see what it would project if price action followed the current labeling and structure.

The daily chart shows a Fibonacci projection based on the Elliott Wave labels:

The projections are in percentiles of the first wave distance.

Elliott Wave rules are that ‘Wave 3’ can’t be the shortest wave. If the structure holds, that means Wave 3 (if that’s what we’re in) would go below the 100%, level and potentially to 161.8%, level.

To Trade, or Not To Trade:

This structure was spotted late yesterday … after abandoning the gold sector. There had already been the pre-requisite hype about CPI numbers and such giving the ‘excuse’ for markets to rise.

That meant risk of a short position (yesterday, early today) was low: not advice not a recommendation.

The chart below of leveraged inverse fund SOXS, shows entry points for what is now: SOXS-22-01

Summary:

Taking a cue from the late Dr. Martin Zweig, on his words during this broadcast, he was very hesitant to use the word ‘crash’.

So, this update is hesitant as well.

However, if the forecasted move of SOXX, to the Fibonacci projected 161.8% level (or more) is realized, it’s a decline over – 37%, from current levels.

It would be significant … crash or not.

Stay Tuned

Note:  Posts on this site are for education purposes only.  They provide one firm’s insight on the markets.  Not investment advice.  See additional disclaimer here.

This Week’s Usual Suspects

Old Paradigm, Continues To Unravel

Bogart

One of the qualities that define leadership is the ability to recognize shifts in power or (public) perception that may lead to a complete change of direction.

Once that’s done, the change or new thinking is crafted into an approach whose objective is to successfully navigate (for however long) what will eventually become a ‘no-brainer’ way of thinking or acting.

As the old way(s) disintegrate, those who refuse or are unable to recognize this change, are likely to start ‘acting out’ in bizarre fashion as they realize the old method doesn’t work anymore.

They’re not able to see the shift as they were never leaders (to begin with) in the previous construct.

In part, this is what Buffett (not an endorsement) may have meant when he said … ‘It’s only when the tide goes out, that you find out who’s been swimming naked.’

Well, the tide’s going out in a big way and the water is receding with ever more rapidity.

As said before, what’s happening right now, is a fantastic public service for those paying attention.

A more efficient way could not have been constructed to reveal who has the best chance to be left standing (and surviving) as, or if, we come out the other side.

‘Acting Out’

Two links are going to be provided but not the ones to the specific examples at hand. Clicking on the links below will enable one to follow the rabbit trail and perform their own investigation.

Those links are here and here.

Into The Void

As the old way continues to self-immolate with what looks like increasing speed, a huge (leadership) void is opening.

Actually, that void was always there; posers were only posing, fooling the easily fooled.

Now, the jig is up.

The smart ones in this on-going collapse have already realized, probably a long time ago, ‘certifications’ and lots of letters after your name mean absolutely nothing when it all hits the fan.

They either are themselves, or are looking (and rightly so) for hardened leadership and/or experience.

As a result, we see real men (and women) stepping into the void: Men like Bjorn Andreas Bull-Hansen, Stew Peters and Dr. Vernon Coleman.

Women like Good Patriot.

Interestingly enough, at time stamp: 12:40 in her link she gives reference to Genesis 41. Coincidence? No.

Acceleration Ahead

Look for everything (supply chain, market implosion, The Speck, as we call it) to accelerate.

We can also get our popcorn ready for the self-imposed demolition of the ‘wealth management’ industry.

Prechter said it decades ago, ‘the next mega bear market will bring this sector to its knees’.

However, that’s an in-depth topic for another time.

In the meantime, go ahead and check for yourself. Pick any wealth management firm and go to their website.

I randomly went to three, just now.

One has a YouTube presence; one is local, and one is nationwide with over 7,000 ‘associates’.

All of them, every last one, are talking about the latest employment figures as if they are real.

Even Jerimiah Babe and Dan from I-Allegedly have stated the figures are false.

Remember, these outfits are “certified” by the same (combined) entity that’s pumping out the false data.

Just sayin’ 🙂

Stay Tuned

Note:  Posts on this site are for education purposes only.  They provide one firm’s insight on the markets.  Not investment advice.  See additional disclaimer here.

The Danger Point®, trade mark: No. 6,505,279


Talking Turkey

Lessons From Mr. Partridge

From Reminiscences of a Stock Operator, ‘Turkey’, aka Mr. Partridge, was much older than the rest.

The rumor in the broker’s office was that he was rich.

Even so, he was not contributing to heavy commissions (i.e. day and swing trading) as far as Livermore could tell.

The other thing was, that he never offered advice.

If a stock tip worked out, he would thank the tipster … if not, you never knew if he took a position or not.

Losing The Position & Psychological Impact

Turkey’s ‘losing the position’ remarks impacted Livermore the most. He recognized that Partridge wasn’t some old duffer; he was an astute speculator.

Losing the position: Not the same as holding a loser.

Maintaining a profitable position during a correction while at the same time, recognizing a big move could be in the works, requires (mental) strength; let the market itself say when to get in and out.

This link has Prechter’s ‘missing out’ story on big gains.

Continuing on with Turkey.

In the book, he said he ‘paid a high price for his tuition’ and does not want to incur a second fee.

Attempting to ‘play’ the market in and out then repeat, by definition, leaves one out of the big move.

It’s not the move itself; it’s the recognition that fiddling with the position and losing it, has resulted in a lost opportunity that will never come back.

The psychological damage is immense.

It’s worse than taking major loss. Watching a move take off without you when you had planned for months (or years) for the set-up, may have left no way to recover.

Which brings us to the market at hand.

Gold (GLD):

This site is not advice, and it does not make market ‘calls’.

Presented here, are posts documenting how Wyckoff analysis is being used to spot market set-ups.

Those set-ups have shown themselves over time to be potentially profitable (not advice, not a recommendation).

The weekly chart of gold (GLD) shows the up-thrust that was months in the making.

We’re going to invert the chart and so, the ‘up-thrust’ now becomes a ‘spring’.

Note:

Back in the day, when I wasted time posting on SeekingAlpha, I would get numerous complaints about ‘inverting the chart’.

They wanted it spoon-fed and did not have the mental plasticity to look at situations from the opposite perspective.

The ‘inverting the chart’ came from none other than Dr. Elder, himself … discussed in Trading For A Living or Come Into My Trading Room if memory serves.

The main interest on the ‘Alpha’ site seems to be pontificating about how sharp your pencil is; how close you can come to guess what earnings (or some other meaningless fundamental) will be at the next release.

I have not been back in years … they’re probably out there still arguing … only this time, the banter may be about which “masks” are most effective. 🙂

But I digress.

Months To ‘Spring’, Weeks To ‘Test’:

The inverted chart of GLD shows it took months for price action to penetrate support and create a spring condition.

Since then, we’ve had a move higher and now lower coming back near support.

Is this a test or a failure of the move?

It was a short week. However, it may still provide actionable data. For example, range of GLD, GDX and NEM, all narrowed. Volume contracted as well.

The inference is, thrust energy is weakening and thus weights the probabilities to a ‘test’ and not a ‘failure’.

Deflation Pivot:

Interestingly, we’re starting the see the consumer has finally reached the limit of their spending. Price are staring to edge lower as reported here and here by Economic Ninja.

Another data point, a bit esoteric, is ammunition. Pices are starting to taper off as well. Most notable is 22-LR.

A couple of months ago, 22-LR was about 0.10 per round (bullet). Looking at this site, we see the cheapest price has dropped to .080/round.

That does not look like much but it’s a 20% decline.

Summary:

Everyone has their own time frame and market approach.

Taking a cue from Turkey, referenced above, I would rather sit through a correction, incur the erosion of profit than exit and ‘click my heels’ as Prechter puts it; then watch the original position move for a huge gain without me aboard (not advice, not a recommendation).

We’re likely to find out very soon if this is a major pivot lower or if somehow, gold (GLD) bulls gain control and drive prices higher.

Stay Tuned

Charts by StockCharts

Note:  Posts on this site are for education purposes only.  They provide one firm’s insight on the markets.  Not investment advice.  See additional disclaimer here.

The Danger Point®, trade mark: No. 6,505,279

Gold Bulls … Trapped, Again ???

Turn The Screws

Thumbscrew

Having been on the wrong side of major moves numerous times, I have first-hand experience on what’s likely to happen next.

If the bulls are trapped for a second time, those in control, the bears, are going to put the screws to those on the wrong side (not advice, not a recommendation).

It could be a straightforward downward thrust or a slow capital draining grind.

We won’t know how bad it’s going to be (for them) until it’s over; Keeping in mind at all times, anything can happen.

Rule Of Alternation

Yesterday’s update said the following:

“Price action permitting, we’ll discuss how this first correction may be a brief one as opposed to a drawn-out choppy affair.”

Price action in GDX, has posted a new daily low (below last Friday’s low); a potential indication we could be starting the next leg lower.

The basis of that assessment is from a technical discussion published by Robert Prechter, Jr., in the early 2000s (’02, ’03, if memory serves) as ‘the rule of alternation’.

Basically, what happened last time, won’t happen this time.

Senior Miners, GDX

The daily chart shows the eight-day up-thrust, along with current action.

The mark-up makes it clear

It was eight days above resistance battling it out between bulls and bears.

Now, we’ve had one day above resistance (level posted on, 12/7) followed by a new daily low.

Correction Complete ?

The following (DUST-21-01), is the trade sequence currently being used.

Based on the above analysis, we’re going to tentatively call ‘The first correction’ as complete (not advice, not a recommendation).

Trade: DUST-21-01

  1. The Set-Up: Complete
  2. The ‘test’ or ‘gut-check’: Complete
  3. The first ‘correction’: Complete
  4. Continuation or Failure
    1. Trend identification
    2. Potential channel(s)
  5. Exit process
    1. Scale out
    2. Full exit
  6. Post trade evaluation

Looking For The Trend

Next up in the trade sequence, is identification of a trend or trends … if any.

For now, we have the potential channel shown below.

Now comes the part most traders/speculators find difficult; That is, wait.

As Livermore said in Reminiscences, (paraphrasing): ‘It wasn’t the thinking that made me money … it was the waiting’ (not advice, not a recommendation).

Stay Tuned

Charts by StockCharts

Note:  Posts on this site are for education purposes only.  They provide one firm’s insight on the markets.  Not investment advice.  See additional disclaimer here.

The Danger Point®, trade mark: No. 6,505,279

Tech Talk: Gold Miners (GDX)

Fibonacci Channel

Is there more pain ahead for the gold bulls?

Short answer: Yes

That is, unless the current patterns in price action change.

From a professional trader’s standpoint, one has to be on-watch for two things:

First:

Be mentally flexible enough to recognize the trade is falling apart and then exit.

Second:

As Prechter put it years ago, be mentally prepared to accept the huge gain.

At this juncture, what is the chart of GDX, telling us?

Senior Miners (GDX), Daily

The un-marked chart.

Marking-up with Fibonacci time sequence.

Adding-in some trend lines.

Zoom out to show the big picture.

Summary:

From low-close, to high-close, the counter trend move took a Fibonacci 34-days.

In the process, it appears that price action is now moving within a trading channel.

In addition, the counter-trend print high on 11/16/21, was close to a 38%, retrace level (not shown) of the entire move from the peak on 8/5/20, to the 9/29/21 low.

Positioning

The last update detailed how a short position was opened in the miners (not advice, not a recommendation).

At this juncture, price action continues to indicate lower prices ahead.

The short is being maintained.

Stay Tuned

Note:  Posts on this site are for education purposes only.  They provide one firm’s insight on the markets.  Not investment advice.  See additional disclaimer here.

The Danger Point®, trade mark: No. 6,505,279

Gold Miners … Going Short

The Battle From The Trenches

To date, there’ve been 232 transactions in the firm’s main trading account.

Each one has its own story.

The big one for now, is shorting the gold miners GDX, via DUST (not advice, not a recommendation).

We’re going to pull out the ‘card catalog’ on that one and take a brief look.

As a reminder, this post identified the breakout target for gold (GLD), months before it actually happened.

Also, in a prior post, it was discovered the miners had 3:1 downside response to recent down moves in gold.

Therefore, at this point in time, using leveraged inverse fund DUST, at -2X, the miners, gives an estimated, 6:1, market exposure.

Short entries were opened (shown below) once the gold market and miners broke to the upside.

Hysteria First

Those who’ve been here a while, already know part of the short set-up, was the necessary hysteria needed to get nearly everyone on the wrong (bullish) side.

Senior Miners, GDX

Just for reference, the daily chart of GDX, is below.

The arrow is the last known transmission of the gold bulls.

Early in the morning it was (6:30 a.m.).

I suppose it must have been from behind enemy lines, with one of the gold updates warning us about archrival, Russia.

As we can see from the price collapse, the Russians must have found our gold bulls. 🙂

Meanwhile, Back At DUST

The daily chart of leveraged inverse DUST, shows trade entry locations to date (not advice, not a recommendation).

The hourly chart below, gives a closer look.

The next chart is a zoom-in of the entries.

Positioning in this market for now, is essentially complete.

At this point, it’s time to monitor and track for any potential trend reversal or trendline break.

Early Or Late

Years ago, sometime around late 2007, or early 2008, Robert Prechter Jr., said concerning his trades, he tends to be a little bit early.

That implicitly means he might suffer through adverse action including loss-exit, if action goes counter enough.

There’s no perfect entry. Early or late, take your pick.

Fixing Entry Errors

As can be seen on the hourly chart, every trade entry was on a red (declining price) bar.

The risk is, price action will just keep on going red.

The benefit is a big one; I’m not chasing the market.

If I’m chasing, it means I’m not on my game or I never had a game or worse, a coward that can’t pull the trigger on a trade without more ‘confirmation’.

David Weis covers in his video, how to properly get aboard a market that’s already underway.

After the initial entries, DUST banged around the bottom (GDX at the top) for eight trading days.

In retrospect and looking at the chart, the adverse action was not much lower but it did not feel like it at the time.

Because of the months of planning, there was an inference the size of this reversal would be significant.

So far, it is.

In the process of reversing, price action itself has fixed trade entries made a little too early.

Summary

Future updates will show potential trend and/or channel action as well as Fibonacci time correlation.

At this point, the DUST trade is well underway.

A reasonable stop area would be in the vicinity of DUST 19.37 (not advice not a recommendation).

Stay Tuned

Note:  Posts on this site are for education purposes only.  They provide one firm’s insight on the markets.  Not investment advice.  See additional disclaimer here.

The Danger Point®, trade mark: No. 6,505,279

Silver, Going To Single Digits ?

It’s A Depression

And

It’s An Industrial Metal

They don’t call it ‘silver solder’ for nothing.

As the link above says, it’s almost ‘impossible’ to substitute.

Silver goes into nearly everything electronic.

Depending on whom you believe, the mainstream says the Future’s So Bright … right?

However, the charts say we may be headed much lower.

Remember the silver ‘short-squeeze’ and the little guy putting-it to ‘The Man’?

At this point, the only silver put around is on the little guy.

The Man’s going merrily along; short the sector that was so recently hyped with gold to “$3000 In Months, Not Years”

In Steven Van Metre’s latest update, he said no fewer than three times, the Fed ‘does not print money’.

It’s a false belief (by the public) they’re not about to change.

At the end if his video, he promised a report … or to make accessible his research on how that (not printing) is so.

Bringing us to the market at hand.

Silver (SLV)

Monthly un-marked chart.

The main thing to note above, SLV, is not at new highs.

In fact, at today’s price, SLV is down over 57%, from its all-time high set in April of 2011.

That in itself, should say there’s something wrong with the inflation, hyper-inflation, narrative.

Using a standard Fibonacci projection tool and tagging the 2011 high, the 2020 low, and the 2021, retrace high, we get the following:

It’s a little hard to see … so we’ll zoom in on the right side.

The 50%, Fibonacci projection, is somewhere between SLV: 9.00, and 9.50.

The premise for declining past 38% (around 13.70) and getting at least to 50%, is predicated on the collapse of the economy and subsequent evaporation of silver demand … at least from an industrial standpoint.

The precious metals ‘stacker’, discussed below, might become more interested in obtaining food than continuing to stockpile something that in times of famine, has very little use.

With the SLV chart above, is that even possible?

SLV, to single digits?

Well, can oil futures go negative?

Enough said.

Food As The Weapon

This site’s been steadfast in thinking, it’s the food first, then silver and gold.

Here are two more links to add to our ‘stack’ supporting that assessment.

The Stage Is Set

Famine Comes Next

As Bjorn says in ‘famine’, come this spring, when the masses realize there will be no (or very little) food and/or you need ‘papers’ to buy food, market pandemonium (if not already) is the likely result; precious metals included.

When To ‘Stack’

So, when will be the time to acquire precious metals (not advice not a recommendation).

It’s deceptively simple; ‘When you don’t want to’.

The time to acquire an asset, is when nobody else wants it … including you.

Positioning short the gold miners GDX, was done when everybody and their dog was a manic bull; screaming an upside breakout was “imminent”.

As Prechter said, positioning opposite the herd involves overriding the limbic system of the brain.

It’s an intellectual (logic-only, thinking) process.

However, overriding the lower brain, i.e., going against the herd, is physically painful.

Excruciating, is a better description.

He went on to say, some of the best traders/speculators he ever knew, were former Marines.

Positioning

Coming up (most likely tomorrow) will be a chart showing positions opened in GDX inverse fund DUST (not advice not a recommendation).

There’s no obligation on this site’s part to reveal that information.

However, it will help explain how the market itself directed trading actions.

It will also show how the on-going reversal corrected several entry errors on my part.

Stay Tuned

Note:  Posts on this site are for education purposes only.  They provide one firm’s insight on the markets.  Not investment advice.  See additional disclaimer here.

The Danger Point®, trade mark: No. 6,505,279

Random Notes

The Usual Suspects For The Week

No. 1

Institutional Destruction

The short video clip by Mark Dice, linked here, shows how former successful and possibly even meaningful (on a rare occasion) movie productions/franchises are being systematically destroyed.

This phenomenon is not just Hollywood but nationwide.

To be specific, the same type of destruction is occurring in the ‘wealth management’ industry.

One of the latest salvos is this ‘initiative’ to make that industry more diverse.

The comments section talks about the ‘talent going elsewhere’ to start their own business.

That may be true but remember, ‘Fiduciary Responsibility’ requirements make sure the person with the least amount of knowledge is in control … the client.

Which brings us to the next bullet item.

No. 2

The ‘Average Investor’

Years ago, somewhere around the early 1990s, Tony Robbins interviewed Robert Prechter Jr.

One of the questions Robbins asked was this:

‘What should the average investor do?’

Prechter’s response was timeless. He said:

‘Quit being the average investor’

Absolutely brutal but true.

It was a polite way of saying to get busy; stop being the ignorant, lazy, average American.

Study and learn the markets. That way you won’t be subject to the corruption and villainy that permeates the financial services industry.

Don’t think that statement’s true?

Just watch a couple of episodes of “American Greed” and see how many involve financial scams that fleece an unsuspecting investment public.

In the above link, our ‘professional’ positions short in a biotech company, Orexigen Therapeutics.

If there’s one thing an aspiring market trader speculator learns at the start, it’s never, never, never go short on biotech (at least the individual equity).

Anything can happen … and it did.

No. 3

Flash Crash Ready

This just out from ZeroHedge; Is another Flash-Crash in the cards?

First off, let’s review what a flash crash looks like.

Link to the 2010, crash.

“Paper” = Big institutional selling

’79s are trading … all the way down !!! ‘

Even way back in my SeekingAlpha days, I proposed the next major market hit would be like nothing else.

Possibly a 20% – 50%, drop overnight or something similar.

Is it not better to plan, analyze and position (not advice, not a recommendation) with a Black Swan event in mind or just go merrily along thinking you’re as close to the entry door as the exit?

Stay Tuned

Note:  Posts on this site are for education purposes only.  They provide one firm’s insight on the markets.  Not investment advice.  See additional disclaimer here.

The Danger Point®, trade mark: No. 6,505,279