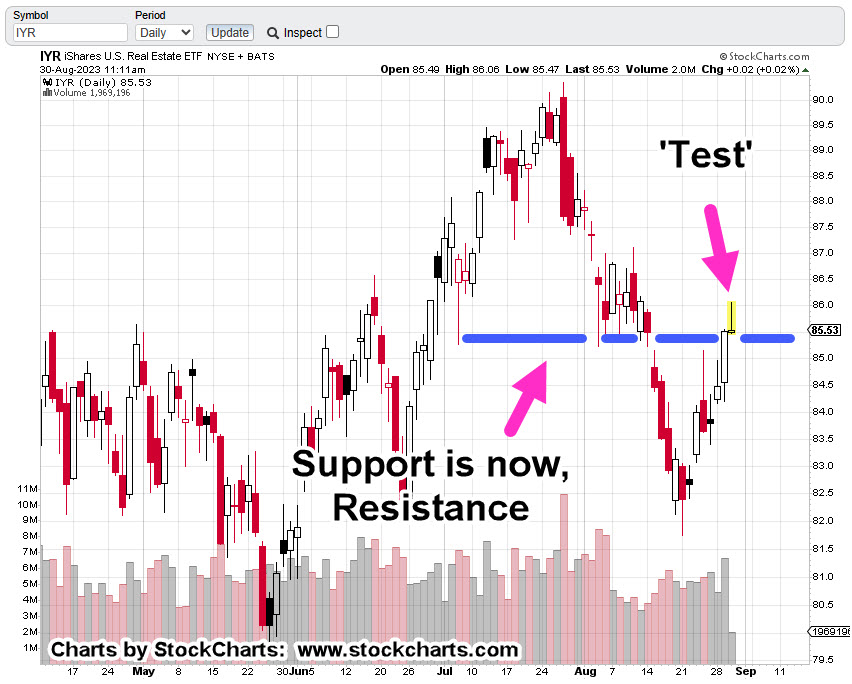
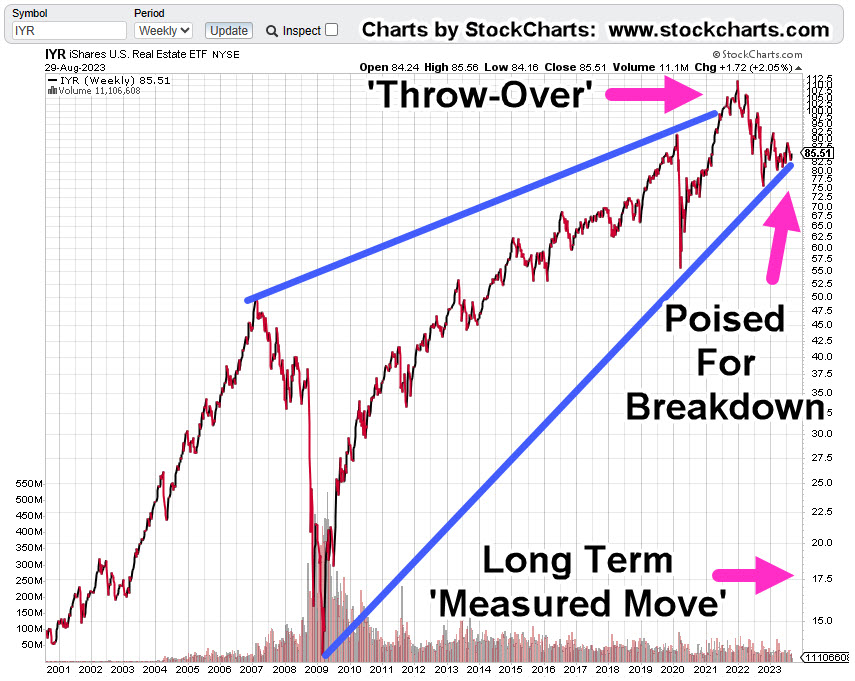
Real Estate’s Massive Channel

Charts by StockCharts

Note:  Posts on this site are for education purposes only.  They provide one firm’s insight on the markets.  Not investment advice.  See additional disclaimer here.

Real Estate’s Failed Test

Charts by StockCharts

Note:  Posts on this site are for education purposes only.  They provide one firm’s insight on the markets.  Not investment advice.  See additional disclaimer here.

Santa Clause Rally?

Charts by StockCharts

Note:  Posts on this site are for education purposes only.  They provide one firm’s insight on the markets.  Not investment advice.  See additional disclaimer here.

Real Estate … The Breakdown

Charts by StockCharts

Note:  Posts on this site are for education purposes only.  They provide one firm’s insight on the markets.  Not investment advice.  See additional disclaimer here.

If Real Estate Goes …

Charts by StockCharts

Note:  Posts on this site are for education purposes only.  They provide one firm’s insight on the markets.  Not investment advice.  See additional disclaimer here.

Real Estate … Poised To Break

Charts by StockCharts

Note:  Posts on this site are for education purposes only.  They provide one firm’s insight on the markets.  Not investment advice.  See additional disclaimer here.

Key Reversal … Yet Again

Junior Miners Take Another Hit

With today’s outside-down (as of 2:43 p.m., EST), that makes it two key reversals for GDXJ, in the past five trading days.

While it looks like the whole herd is focused on the new mania, Artificial Intelligence, back at the ranch, the miners are painting an ominous picture.

Rendezvous With Destiny

The first two-minutes and ten seconds, at this link, are all that’s needed to get the idea of what’s likely to come.

The market recovered (fairly quickly) from 1987 … this time, may indeed be different.

The Elephant Sleeps

Ah, yes. The elephant no one talks about … or more accurately, are afraid to talk about.

Three links here, here and here, show us the elephant may be about to awake.

Even Fox News admits, it was all a lie.

Junior Miners GDXJ, Trend & Channel

From the bottom, May 25th to now, is a Fibonacci 13-Days.

Is that important?

Here’s a prior analysis on Real Estate IYR, that shows how Fibonacci can identify the pivot point, trend and/or trading channel.

Now, back to the Juniors.

The mining sector appears to be under pressure. Each attempt to rally is being thwarted.

Compressed view of the channel, below.

The Fed announcement at 2:00 p.m., EST tomorrow, may or may not have any material effect. The sector may just continue lower …. slowly, without much fanfare (not advice, not a recommendation).

Stay Tuned

Charts by StockCharts

Note:  Posts on this site are for education purposes only.  They provide one firm’s insight on the markets.  Not investment advice.  See additional disclaimer here.

The Danger Point®, trade mark: No. 6,505,279

Real Estate … After The Reversal

Trading, In The Cannel

Real estate reversed at Fibonacci Week 34, on schedule, as identified in this update.

Since then, it’s been three weeks of closing lower.

‘Boots on the ground’, have been done by numerous YouTubers such as Jerrimiah Babe, Economic Ninja, Dan from i-Allegedly, and others.

Real estate from a fundamental standpoint is in free-fall (not advice, not a recommendation).

Supporting data can be found at this link; time stamp 3:10 and 5:25, specifically for real estate.

From the realm of ‘You can’t make this stuff up’, go to time stamp 7:25, in the above link and look at the price of Telsa.

However, let’s not wander too far off and get back to the ‘implosion du jour’, real estate. 🙂

Real Estate IYR, Weekly

If this channel is in-effect, meaning the ‘demand’ side is a long way down, the trading potential is enormous (not advice, not a recommendation).

With that said, let’s look at the daily chart and potential Put option trade.

Real Estate IYR, Daily (Close)

The market itself, the weekly above, has shown us it’s following a Fibonacci sequence … for now.

Getting down to the daily, on a close basis, we’re presenting one of an infinite number of potential moves.

It’s the upward move (if it happens) to test the channel line that’s the spot to watch.

During such a rebound, short dated put options would be decreasing in price significantly.

According to the economic calander, next Friday March 3rd, will have Fed representatives speaking at 11:00 a.m. and 3:00 p.m., EST.

Stay Tuned

Charts by StockCharts

Note:  Posts on this site are for education purposes only.  They provide one firm’s insight on the markets.  Not investment advice.  See additional disclaimer here.

The Danger Point®, trade mark: No. 6,505,279

Biotech Bobsled, Starts … Down

Slowly, At First

Of all the major indices for today’s (Wednesday) session, biotech’s SPBIO, Leveraged Inverse Fund LABD, had one of, if not the largest gain @ +10.48%.

The last update identified two sectors to watch for short positioning: Real Estate IYR, and Biotech SPBIO; Short positioning via leveraged inverse funds DRV, and LABD, respectively (not advice, not a recommendation).

Since that post, DRV is up + 1.74%, and LABD is up + 8.58%, both measured on a close basis.

The ‘Big Reveal’

Remember: When price action turns south, that’s when the bad news comes out.

If this is the big reversal and biotech is the downside leader, unfortunately, that could mean a planned ‘reveal’ by the mainstream media.

Anyone going to alternative sites such as BitChute, ZeroHedge, Rumble, know full well what’s happening.

Maybe we’ll have another distraction like the 100-th (at last estimate) food processing plant fire or even something totally retro, like a balloon flying across … oh, wait. 🙂

Biotech SPBIO, Leveraged Inverse LABD

We’ll get straight to the point as prior updates have built a substantial case for a long term, significant reversal.

Recall, LABD is the leveraged inverse of SPBIO. The daily chart shows the current set-up.

This site does not provide investment advice.

With that said, one could infer from this prior post (at the bottom), a position in LABD had already been established and included a hard-stop.

That was indeed the case.

Next Steps

There’s no guarantee on how far or how long a directional move will go.

However, for SPBIO, one can observe since the February 2021, reversal from all-time highs, a sustained, directional move typically lasts 4 – 6 weeks.

The next update will show the best chart timeframe (multiple days) that resulted in capturing the majority of the directional moves since the February 2021-high.

Stay Tuned

Charts by StockCharts

Note:  Posts on this site are for education purposes only.  They provide one firm’s insight on the markets.  Not investment advice.  See additional disclaimer here.

The Danger Point®, trade mark: No. 6,505,279

The Moderna ‘Channel’ … Redux

… And The Weekly, ‘Summary & Strategy’

The last update about our chief cook and bottle washer of gene ‘modification’ had this to say about price action.

“We’re about forty minutes into the session; Moderna (MRNA) has just confirmed the up-thrust reversal discussed in the last update“.

From that point Moderna (MRNA) declined for seven weeks for a total of around – 31.5%.

However, that’s not the most important part.

In that update, a trading channel was shown which at the time, was declining at – 93.7%, on an annualized basis.

Well, the channel is back.

Only this time, probabilities and price action have come together to set up for a potential sustained decline.

Moderna MRNA, Weekly

Above, we have a Wyckoff ‘Up-Thrust’ and a test that has since turned lower.

Next, we have a series of repeating trend or channel lines.

Additional data has modified the downward slope to be declining at approximately – 90%, annualized.

From a fundamental standpoint, the data set is enormous on the events of the past three years.

At some point that data could provide a huge tailwind for downside action.

For now however, let’s stick with what price action is telling us and go to the Summary & Strategy

Summary & Strategy

The past week has identified two areas of position or trade execution and two areas for possible short-term options execution (not advice, not a recommendation):

Position or Trade: Real Estate IYR, and Biotech SPBIO

Options: Carmax KMX, and Moderna MRNA

As a reminder, most if not all trade analysis is for the short side (not advice, not a recommendation).

Final Thoughts

Since we have possibly the largest bull trap in market history with huge numbers of VIX Call options, the following week may be subdued by going modestly up, sideways or down, slowly.

With that said, options positioning (if any) could be slated for the week of 2/17/23.

As always, price action is the final arbiter.

Stay Tuned

Charts by StockCharts

Note:  Posts on this site are for education purposes only.  They provide one firm’s insight on the markets.  Not investment advice.  See additional disclaimer here.

The Danger Point®, trade mark: No. 6,505,279