Now, It Gets Interesting

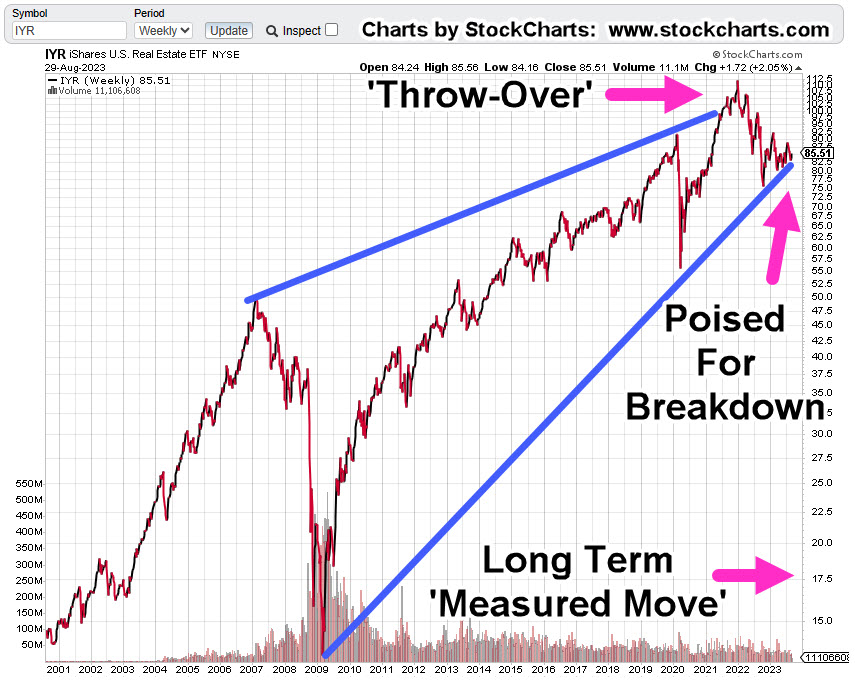
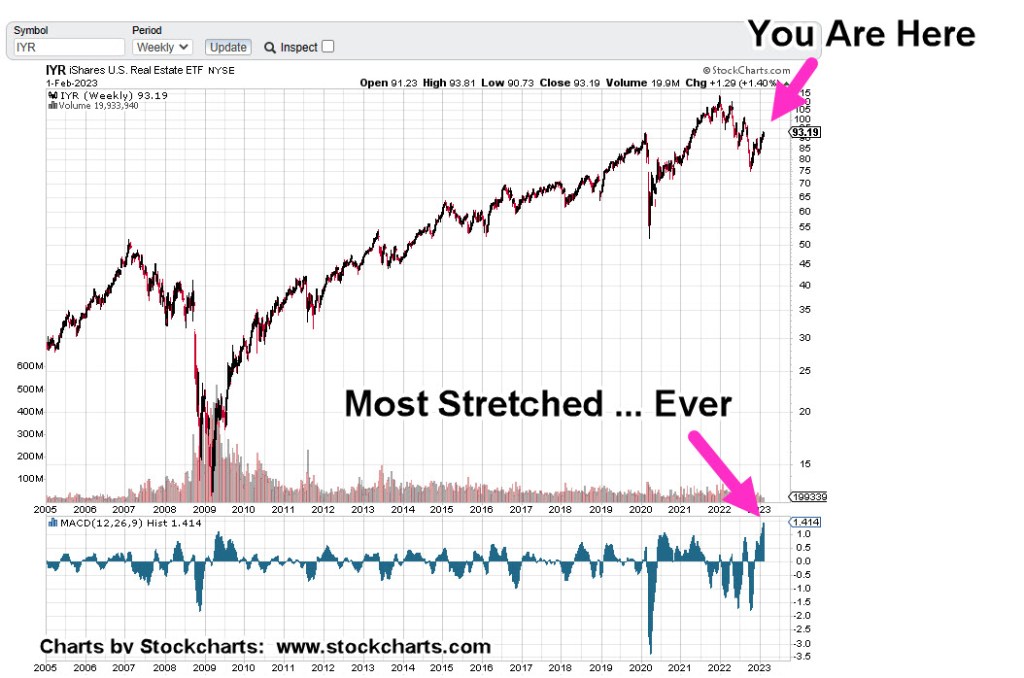
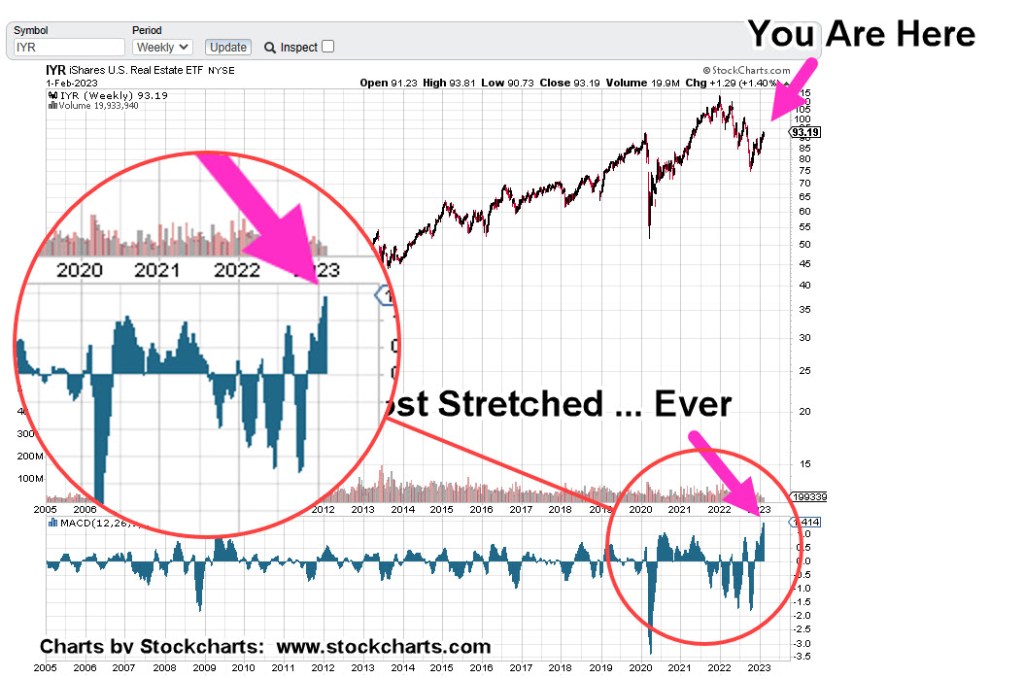
Back in August, this post identified the potential for a long-term breakdown in real estate, IYR.
Since then, IYR broke its trendline.
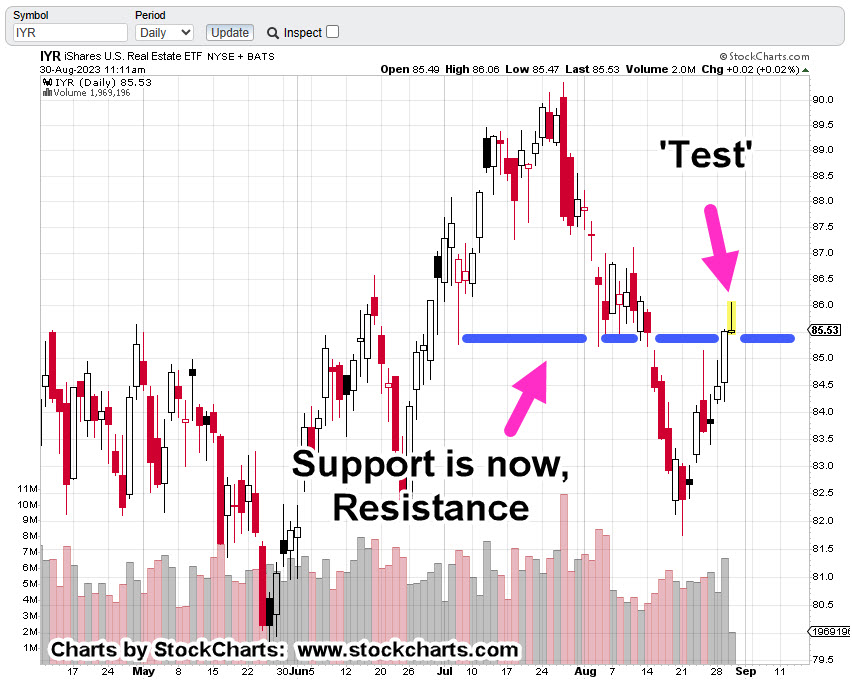
As of today, we have a potential test of that break.
Real Estate IYR, Weekly Close
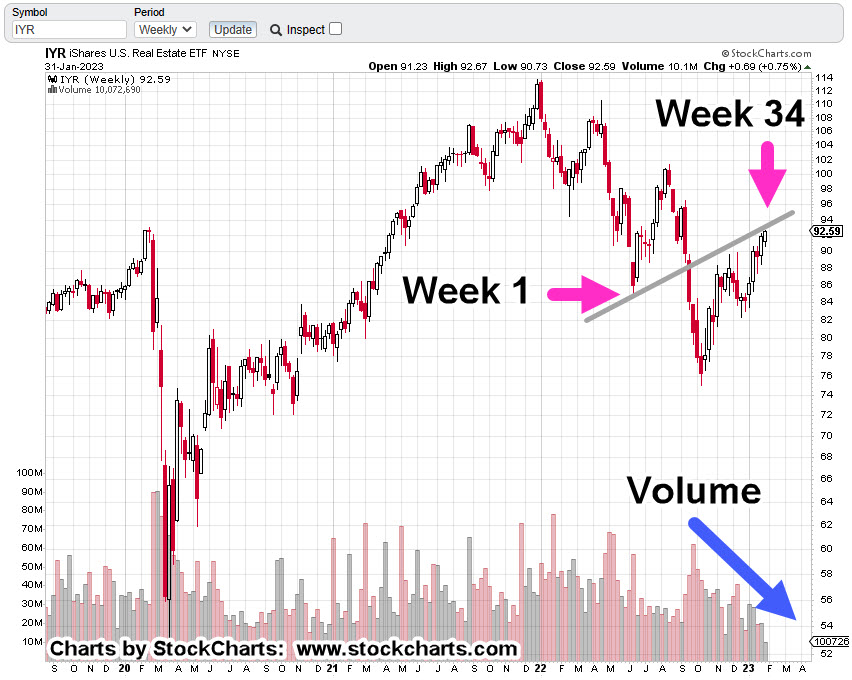
The chart shows the breakdown from the wedge and now, an underside test.

Subsequent updates will get closer-in on the action (daily chart) to show the breakdown and test.
Positioning
Right around mid-session, IYR price action appeared to be making its highs. At that point, a short position via Leveraged Inverse Fund SRS, was initiated at SRS 19.02 (not advice, not a recommendation).
Trade identification is, SRS-23-03.
The stop has yet to be determined (will be set next session) but is likely going to be today’s SRS low @ SRS 18.70 for a ‘risk’ of about, 0.32-pts.
Stay Tuned
Charts by StockCharts
Note: Posts on this site are for education purposes only. They provide one firm’s insight on the markets. Not investment advice. See additional disclaimer here.
The Danger Point®, trade mark: No. 6,505,279