All Quiet, on Labor Day Weekend

Gold, silver, and the S&P are essentially unchanged (as of 6:44 p.m., EST).
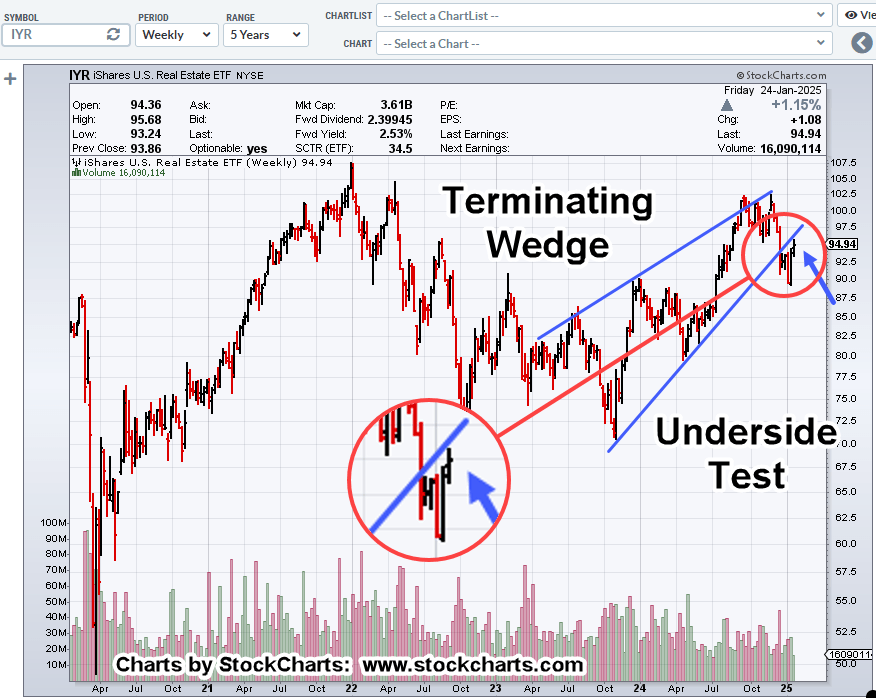
Although it appears to be a quiet weekend, we should at least take note of the terminating wedge pattern in the S&P.
The S&P is probably the most computer controlled, most manipulated, most algorithmed (if that’s a word) market in the world.
From a personal standpoint, I do not trade it and have not for over 15-years.
There are better ways to engage and not volunteer oneself to get whacked every day by a mass of computer algorithms (not advice, not a recommendation).
With that said, we’ll look at it anyway. 🙂
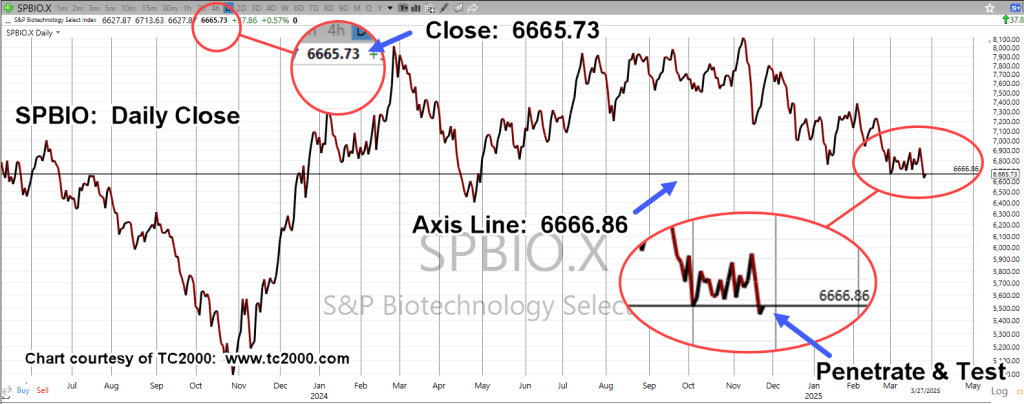
S&P 500, SPY, Daily (segment)
We’re oscillating into a wedge pattern. A wedge typically occurs at the end of a move, whether it be up or down.

With the Nvidia earnings release out of the way, the tone of the overall market may have changed.
We’ll see if that’s true in the coming week.
Stay Tuned
Charts by StockCharts
Note: Posts on this site are for education purposes only. They provide one firm’s insight on the markets. Not investment advice. See additional disclaimer here.
The Danger Point®, trade mark: No. 6,505,279