As Promised, Amgen

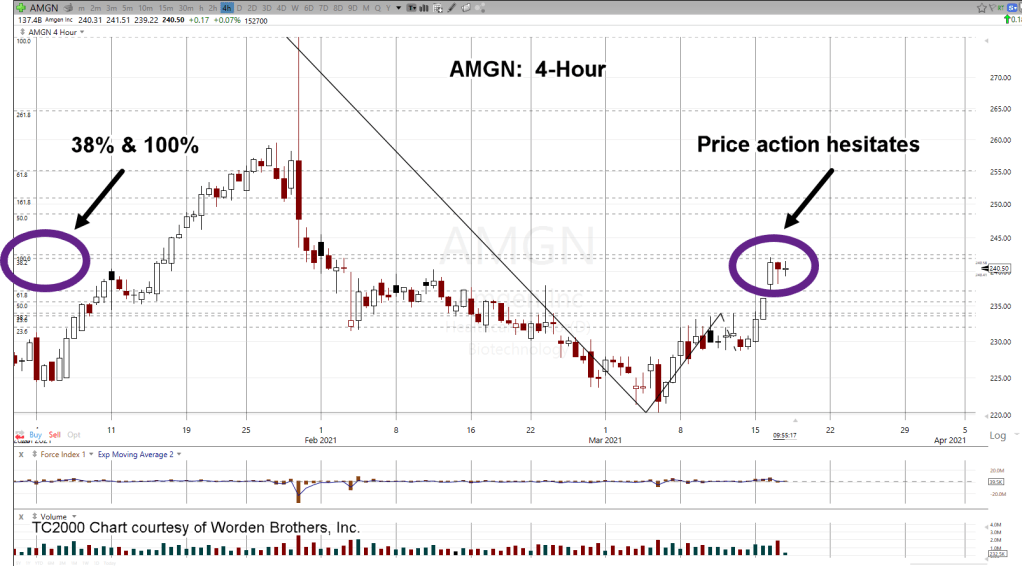
AMGN’s at a confluence of Fibonacci projections.
Yesterday’s update hinted that AMGN was in a special situation. This is a brief detail of conditions.

First, let’s understand that momentum indicators, MACD on monthly, weekly and daily, all point higher.

If we’re at the downside reversal, the inflection, we’re documenting in real time how it’s taking place.

On the chart, two Fibonacci tools are in use; a retrace tool and a projection tool.

The retrace is from the all time high posted on 1/28/21, to the most recent low on 3/4/21.

The projection tool has been placed on the recent upward action from that low and estimating where the a-b-c (corrective) waves are terminating.

The market itself determines what levels are important. This is one of the main Wyckoff tenets presented by him over a century ago.

It’s clear price action is hesitating at the confluence of a 38% retrace and 100% projection (‘a’ and ‘c’ waves equal) on the chart.

Since AMGN is the largest cap in the IBB, ETF, its behavior has an outsized effect.

A downside reversal from this point, the 38% retrace level, would indicate significant weakness for AMGN.

We also have today as Fibonacci Day 34, from the all time high.

The retrace high may have been yesterday or we may get it today … right around 2:00 p.m. EST, at the Fed announcement.

Update: As this was being written, AMGN just posted a new retrace high.

Stay Tuned

Note:  Posts on this site are for education purposes only.  They provide one firm’s insight on the markets.  Not investment advice.  See additional disclaimer here.

High Yield, The Canary

The canary in the coal mine could be High Yield, HYG

Since early last year, this site has been discussing growing parallels of the current market environment to that of August 1987.

Just recently, ZeroHedge began to pick up on the idea as well.

What’s becoming very obvious when looking at 1987, we’re in something much larger; possibly an order of magnitude (or two) larger.

Here’s the latest from Jeramiah Babe. Important time-stamps below:

2:15, Crypto (try it when the power goes out)

3:00, Inflation

3:30, Agricultural prices

3:40, Lumber prices

4:10, Middle Class destruction

5:00, Last longer than Great Depression

7:30, Dramatic shift (never to be the same)

10:00, “We’re in 2021 now. Anything is possible“

A quick review of longer term momentum indicators on the major indices (or ETFs), below:

Technology based indices all have significant downside momentum.

The financial press may have pawned this off as ‘rotation’. Of course, that remains to be seen.

Our view, high yield tells us something much larger than a sector rotation’s occurring.

It’s possible, the most debt (interest rate) sensitive indices are reversing first which could be a sustained, long term reversal.

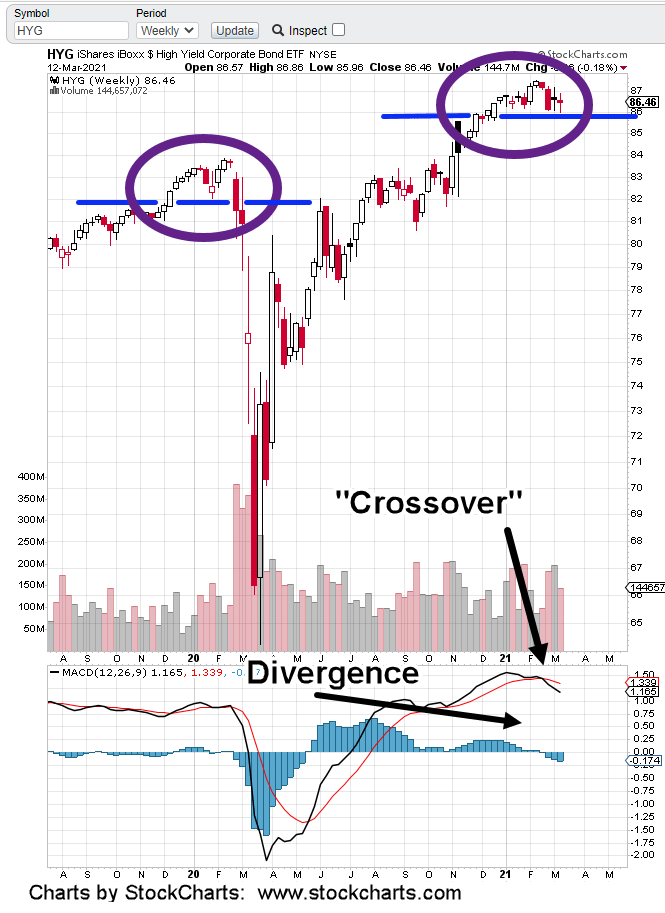
The HYG weekly chart pattern is similar to the prior reversal (magenta ovals). This time however, MACD has spent over nine-months in a divergence and has crossed to the downside.

There could be a new high … low probability but it could happen (after all, it’s at support). If it does, weekly MACD may post an even larger divergence.

In response to the HYG reversal, we’re watching (and are short) the biotech sector, IBB (not advice, not a recommendation)

Of the three noted above with negative momentum, IBB is the weakest. Last Friday’s action has tentatively confirmed the resistance areas and trading channel reviewed in this update.

Friday’s IBB lower action was nearly imperceptible but it was there. Major reversals can happen this way … a little at first.

Wyckoff said it in 1910, ‘It’s as if the weight of a feather can determine the next direction’.

We’ll see if there’s follow-through to the downside on Monday.

Stay Tuned

Charts by StockCharts

Note:  Posts on this site are for education purposes only.  They provide one firm’s insight on the markets.  Not investment advice.  See additional disclaimer here.

Off With Their Heads

Head & Shoulders patterns are showing up in several markets.

First, there’s biotech IBB … and now the SOXX.

The SOXX is higher in pre-market around +2.5% , +2.70%, near 385.25.

Conversely, inverse SOXS is down -9% to -10% near the 14.00 -area.

Today could be the day where risk is minimized to position short via inverse SOXS (not advice, not a recommendation).

If SOXX remains below yesterday’s high of 397.71, it has set itself up to break the neckline. Once that’s completed, we’d then have a measured move lower to around 320.

If short via SOXS, the stop would theoretically be yesterday’s low of 13.21.

We all know however, inverse funds and especially the 3X versions, have significant negative erosion.

If during the regular session, SOXX price action persists throughout the day near yesterday’s high (397.71), inverse SOXS will continue to erode below its own prior daily low.

A different view is the Right Shoulder has not been completed. We’ll know that if SOXX makes a new daily high.

It’s a myriad of scenarios and the professional understands there’re an infinite number of outcomes. However, at times, risk is reduced enough to take a position on a probable direction.

At this juncture and given the above conditions, the most probable direction is down.

One last caveat.

SOXX has broken below well established support. That puts it in Wyckoff spring position. The market will automatically attempt to rally as we see in the pre-market.

Based on the conditions described, we’re expecting that spring attempt (to new all time highs) to fail.

Charts by StockCharts

Note:  Posts on this site are for education purposes only.  They provide one firm’s insight on the markets.  Not investment advice.  See additional disclaimer here.
Test, Then Reverse

Today’s price action in real estate (IYR) looks like a test of the failed breakout (up-thrust) from February.

This session, price action came all the way back to support (87.90), which is now resistance.

The important part, the level did not hold. Late in the session there was erosion and retreat to close well below the day’s highs.

This type of behavior is near textbook for a significant reversal.

From a trading perspective, the short position via DRV was maintained (not advice, not a recommendation) except for reducing the position by about 2.5% … essentially negligible.

Today’s test and erosion is one of those few times where probabilities are high; the market’s tested the up-thrust (failed breakout) and we can expect prices to decline from here.

One last note adding weight: Today is Fibonacci Day 8, from the high on February 25th.

With conditions noted, posting a test high today, then backing off … indicates downside ahead.

Charts by StockCharts

Note:  Posts on this site are for education purposes only.  They provide one firm’s insight on the markets.  Not investment advice.  See additional disclaimer here.

Failed Rally Attempt: Real Estate

Nothing gets sharks in the water faster, than a failed move.

Last Friday, real estate IYR closed below support (black line). Doing so, put itself in Wyckoff spring position.

‘Spring position’ is a technical condition of instability where price can reverse dramatically.

At the open yesterday, that’s exactly what happened. IYR launched nearly instantly to a 50% retrace.

From there it was a long day of moderate price erosion all the way to the last hour; then it all went south.

IYR closed just 0.22 points higher or +0.25%, after being as high as +1.73 points (+1.98%), early in the session. In addition, that close was back below support on the heaviest volume since February 2nd. … another bearish sign.

We can see momentum, MACD has exhausted itself and posted numerous bearish divergences.

On the fundamental side, just in the past 24-hours, there’s been a raft of news articles posted showing commercial real estate’s in serious trouble.

A short list of what has been found is below:

Mortgage market.

Mall values crash.

Bond tipping point.

Bond market calls Fed’s bluff.

U.S. Spending plummets.

Rising yields are now good for the markets?

IYR could still rally from here. However, with the conditions described in this post, it’s not likely.

Summary:

We’ve been short this market in a big way (not advice, not a recommendation) via DRV. The plan is to increase position size as long as price action allows low risk entries.

Charts by StockCharts

Note:  Posts on this site are for education purposes only.  They provide one firm’s insight on the markets.  Not investment advice.  See additional disclaimer here.

Trading Tip: Trailing Stop

Here’s one method to use for a trailing stop; Have the market itself tell you were it goes.

The reason brokerage trading platforms have so many options with an endless list of indicators, is that’s what the (retail) public wants.

It has nothing to do (as usual) with what works best.

Wyckoff himself said the market defines the course of action. The “tape” as he called it, was the master for decision making and no other.

Let’s look at what the tape is saying about LABD, the 3X inverse EFT of Biotech (IBB).

The sector has already been traded profitably last week. Shown on the chart below is another entry. Also shown, is what may be the most efficient method for stop placement.

For LABD over the prior weeks, we could have extracted a large part of its move using a trailing stop based on the 4-Hour chart.

LABD itself has defined that 4-Hour looks best at this point in time.

So, that’s what we’ll do (not advice, not a recommendation). The stop will be at the nearest 4-Hour low (currently, 16.27).

At mid-session today, we’ll move it up to the next 4-Hour low and so on until stopped out.

Note:  Posts on this site are for education purposes only.  They provide one firm’s insight on the markets.  Not investment advice.  See additional disclaimer here.
Miners, GDX Accelerates Lower

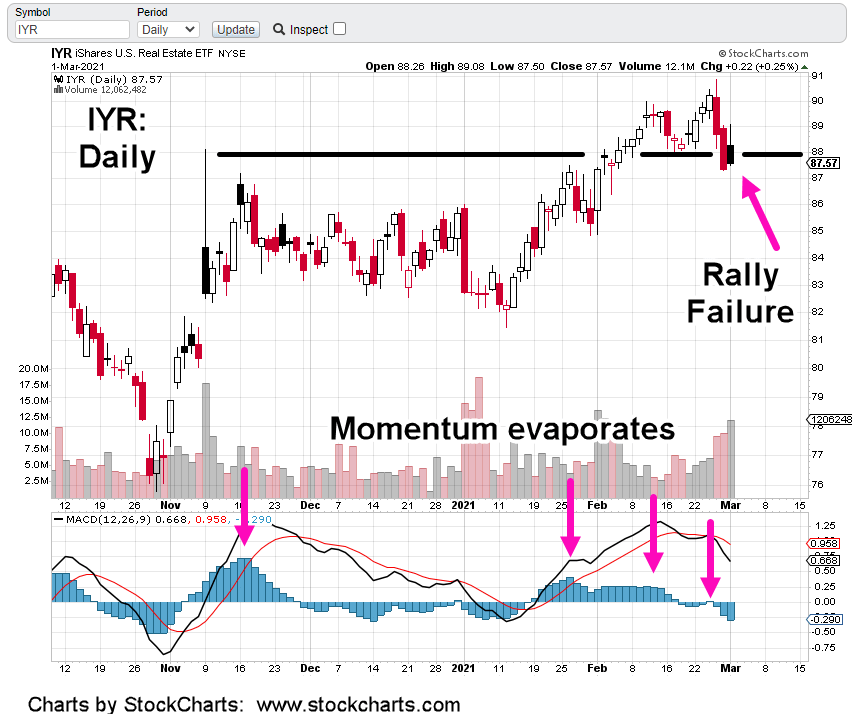
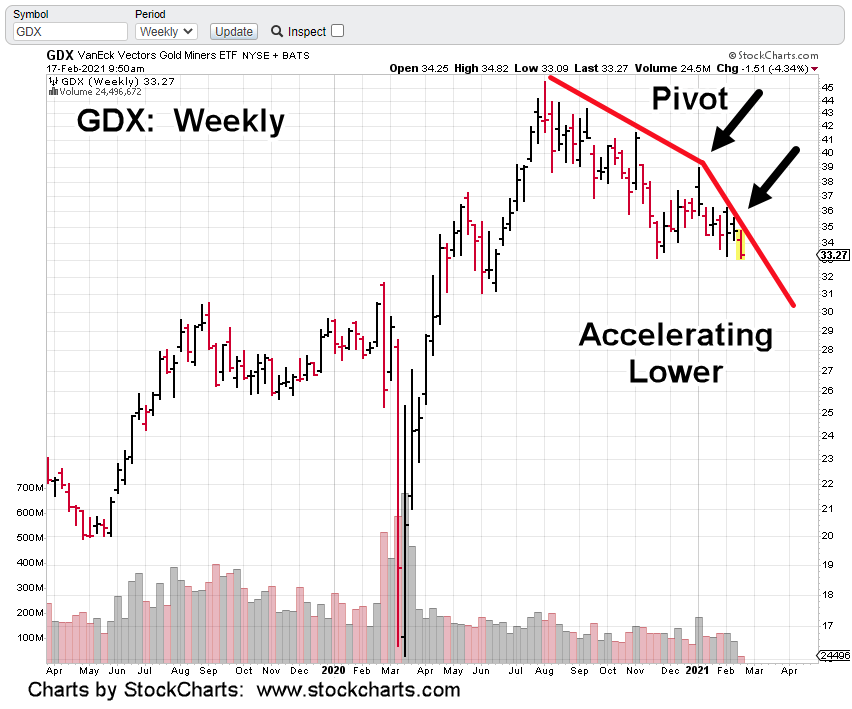
With GDX posting a new weekly low (below 33.23) early this session, it’s helping to confirm a pivot and acceleration to the downside.

Bullish or bearish, it’s a crowded trade that we’re avoiding (not advice, not a recommendation).

It took over a week of oscillating price action before GDX decided to post below the February 4th, low.

Even so, when an established low is penetrated, it puts the market in “Wyckoff Spring Position’.

That means there’ll (potentially) be some type of rally or rally attempt. If that happens, it’s just more oscillations that result in erosion of leveraged inverse funds.

Other areas of the market are performing better on the downside. Real estate IYR, looks like it may post a narrow range day (as of mid-session).

It’s typical action when at support. If there’s no break lower today, then IYR could make an attempt higher at the next session.

Based on previous analysis, that attempt (if it occurs) is expected to be short lived.

Charts by StockCharts

Note:  Posts on this site are for education purposes only.  They provide one firm’s insight on the markets.  Not investment advice.  See additional disclaimer here.
Silver Short Squeeze, Over

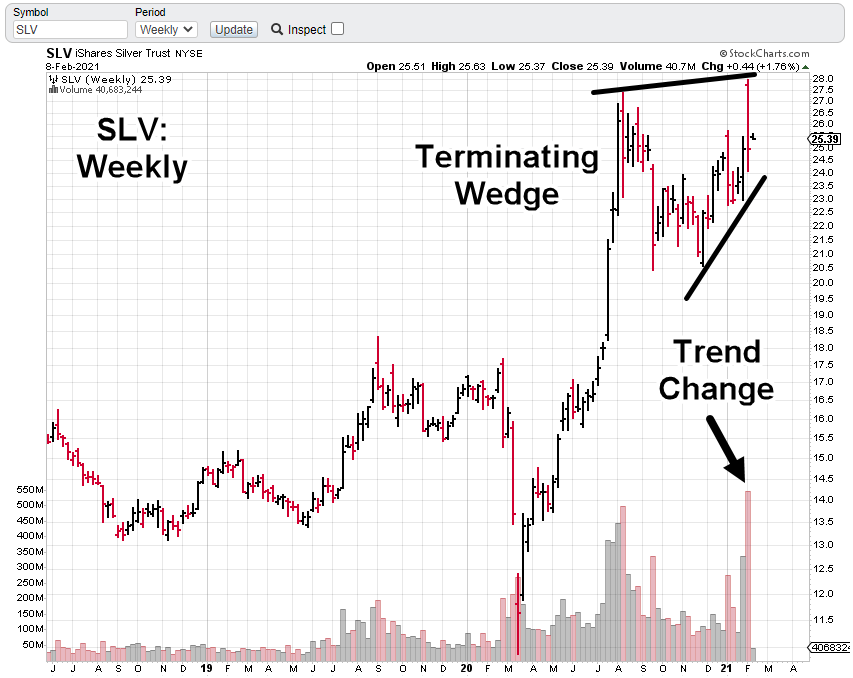
Massive volume in SLV, points to significant reversal.

Not since the week of May 13th, 2011 has there been higher volume.

The week prior in 2011, was the highest volume ever, for SLV at 1.1-Bilion shares.

Those two weeks culminated in a crash over -31% and were just after SLV reached its all-time high.

Total down-draft for the three weeks combined (the top and two weeks following) was nearly -34%.

Will it be any different now?

Probably not.

At this point, it’s important to re-state, this site is following principals and techniques set down by three market masters of the early 1900s; Livermore, Wyckoff and Loeb.

Markets do not change. Using the techniques outlined by those early masters are still applicable today.

Arguably, the father of technical analysis was Wyckoff.

The terms “accumulation, distribution, support and resistance” originated from him.

His technical publications had the largest subscriber base in the States at the time; larger than all other publications combined.

At one point he got so successful, his buy or sell recommendations were beginning to move the markets all on their own. The year was 1918.

Instead of stroking his ego on how ‘his recommendations’ were affecting the markets, he saw it as a disservice to his clients.

In May of 1919, he discontinued his newsletter publication ‘The Trend Letter’. It had become so popular, it was impossible to provide recommendations without those same tips moving the market.

What a contrast to today.

Those attempting garner forces (the little guy) to move the markets, such as silver, will find out soon enough who’s in control … and it’s not them.

It’s unlikely silver is going higher any time soon. There could be some upward spasms as the crowded trade exhausts itself; it’s likely we’ve seen the SLV highs for quite some time.

Stay Tuned

Charts by StockCharts

Note:  Posts on this site are for education purposes only.  They provide one firm’s insight on the markets.  Not investment advice.  See additional disclaimer here.

S&P 500: Trend Break, Test

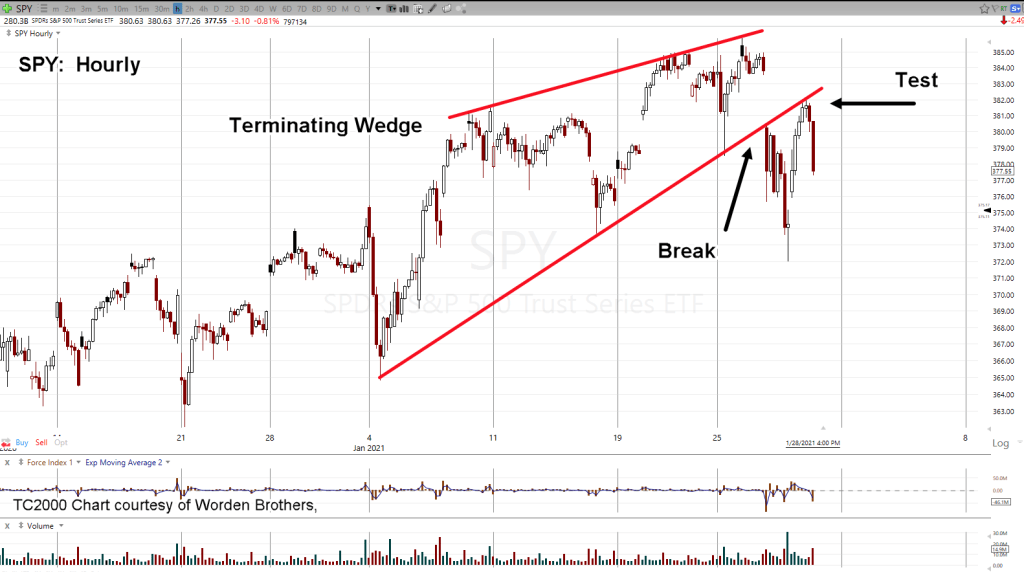
Yesterday, the S&P tested its trend breakout and then reversed.

This morning’s pre-market action is down again.

The teminiating wedge is clear. Then a decisive break with an upward test. Late in the session that test was rejected and the market headed lower.

That scenario could have easily been from 1931’s stock market action, not 2021.

Buried within the Wyckoff training course material (first published 1931), available here, is a statement to the effect:

‘When a market breaks a trend decisively and with volume, there’s nearly always some type of rally to test the break.’

That’s exactly what we got yesterday. Now, the S&P (SPY) is in a wide pre-market range but essentially trading lower.

A terminating wedge is typically the last stop in a move; whether it’s up or down.

The S&P could of course rally from here. At this point, probabilities favor lower; at lest to a measured move target in the vicinity of 368, for SPY.

Note:  Posts on this site are for education purposes only.  They provide one firm’s insight on the markets.  Not investment advice.  See additional disclaimer here.
Was That The Top?

“If the market (S&P, Dow, NASDAQ) opens lower tomorrow, Friday and continues decisively lower, we might add Tuesday, November 24th, 2020, as another empirical data-point for Holiday Turns.”

The quote above was from last Thursday’s update.

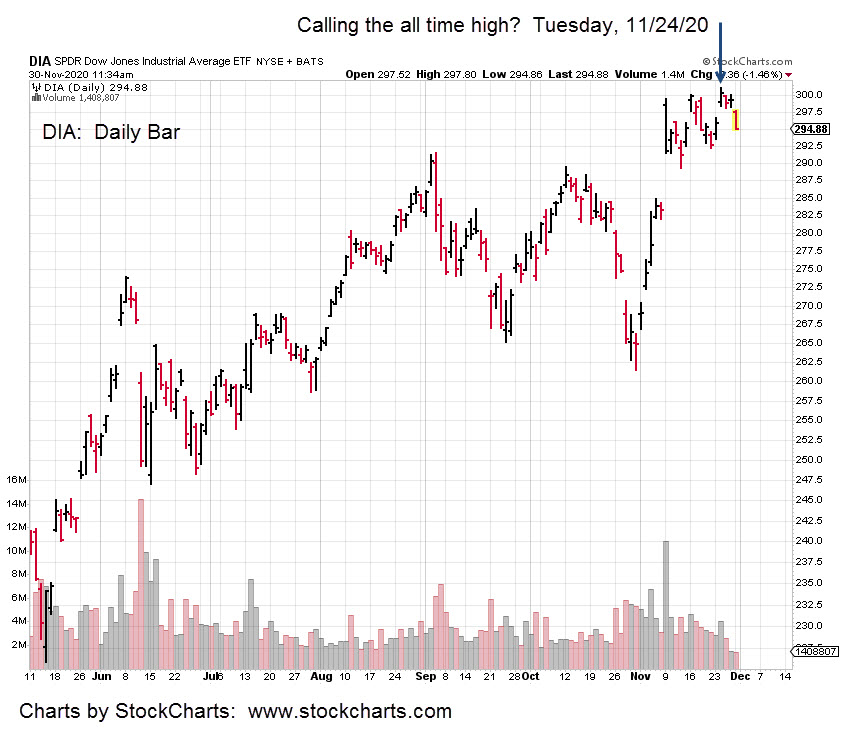
Well, it looks like the market waited one additional day to make its turn.  For the Dow 30, last Tuesday the 24th, was indeed a high.

We’ll see how far this one goes.  It’s a high but whether or not it’s THE high is not known.

Given the market conditions being reported on this site, long positions look tenuous indeed (not advice, not a recommendation).

The ever helpful, knowledgeable financial media says ‘it’s the best month since 1987’.  No elaboration on that one is necessary.

The takeaway is, understanding that market pivots tend to occur during a holiday week … when no one is looking.

In other markets, gold (GLD) continues lower and is attempting to take the miners (GDX) down as well; currently oscillating near unchanged.

Biotech pushes into its breakout but at this juncture (11:53 a.m. EST), it looks weak and may not have energy to get to a new all time high.

It should be obvious the manipulators are hard at it … attempting to get the sector (IBB) to move high enough for gains on the long side, then turn around and establish low risk short positions.

Wyckoff noted that under such conditions (exit longs, enter shorts), daily volume will be two-to-three times greater than typical.

Chart of DIA is below … showing reversal since last Tuedsay, the 24th.

Charts by StockCharts

Note:  Posts on this site are for education purposes only.  They provide one firm’s insight on the markets.  Not investment advice.  See additional disclaimer here.