The two hits on the right side channel line provide confirmation of the trend.
An expanded version of the daily is below:
So far, we’ve had the blockage of the Suez Canal. Auto parts being sent to the bottom of the ocean off Japan. ‘Mysterious’ grain silo fires destroying harvested crops.
If transportation is shut down as a result of cyber attack, fuel pipelines off-line, no grease to lubricate the wheels or any number of other (planned … and don’t think there’re not) events, the last thing that’s going to help get anyone through, is a ‘stack’ of inedible metal.
It’s no secret this site’s been using the Biblical precedent of Genesis 41.
That is: Grain and Corn come first … then gold and silver.
The ‘stacking’ public has got this message reversed. Of course, this is not advice or a recommendation.
However, for those that can see, it’s so obvious the goal is ‘controlled demolition’ of the supply chain. All of it.
We’ll put everything back to ‘normal’ if you just get injected.
Meanwhile, biotech IBB, and SPBIO, have both posted a new daily low.
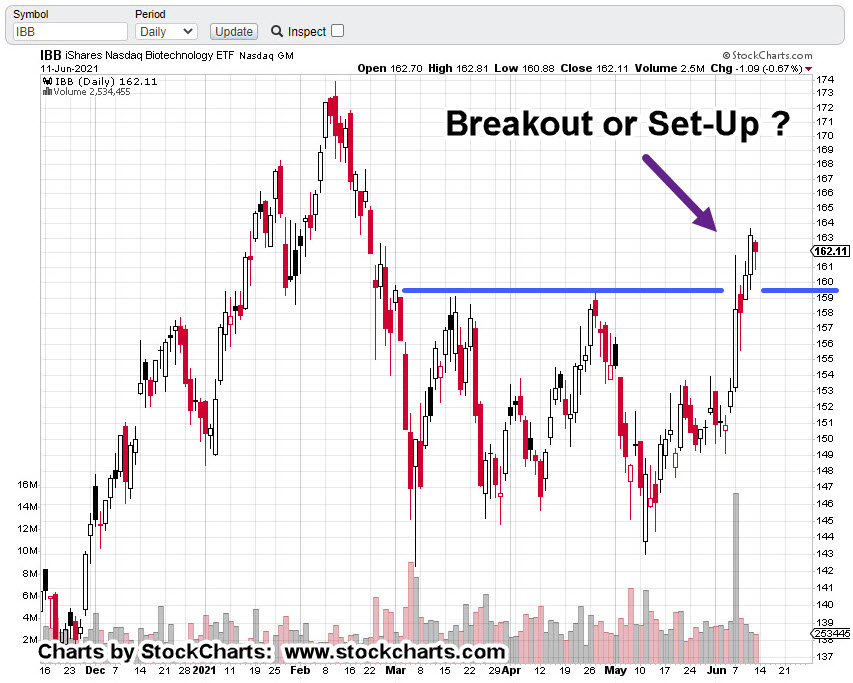
IBB is poised to penetrate the resistance area identified in this update, and come back to test the wide bar.
If that happens, we have a Wyckoff up-thrust in play. More analysis of biotech to follow.
Note: Posts on this site are for education purposes only. They provide one firm’s insight on the markets. Not investment advice. See additional disclaimer here.
Note: Posts on this site are for education purposes only. They provide one firm’s insight on the markets. Not investment advice. See additional disclaimer here.
Note: Posts on this site are for education purposes only. They provide one firm’s insight on the markets. Not investment advice. See additional disclaimer here.
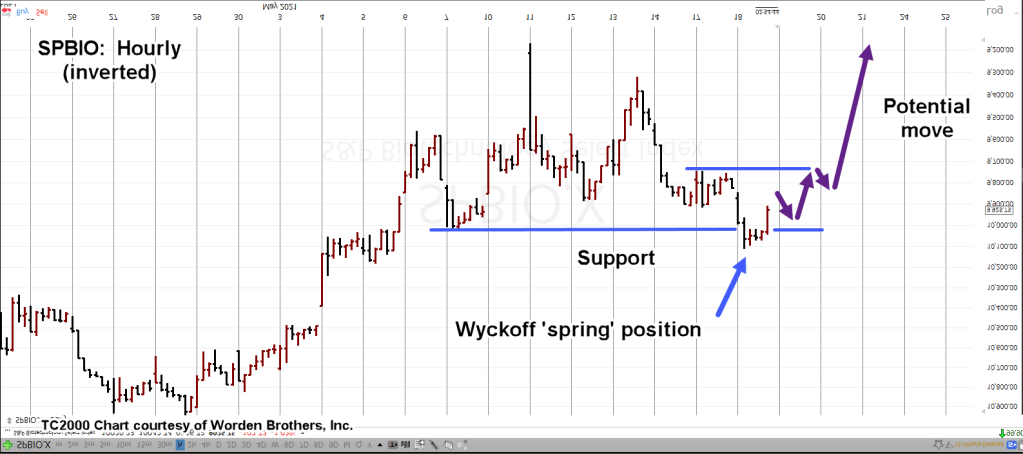
Above is the hourly SPBIO chart; inverted and annotated.
Under the conditions shown above, when price action penetrates support and then reverses, it’s called a Wyckoff ‘spring’.
From this point, the expectation is for a moderate rise, then test and then a dynamic rise to the top of the trading range.
Note: Posts on this site are for education purposes only. They provide one firm’s insight on the markets. Not investment advice. See additional disclaimer here.
Even in his trading video, the late David Weis remarks … ‘I have a preference for down markets …’
Profits come nearly twice as fast and the bottom is easier to detect.
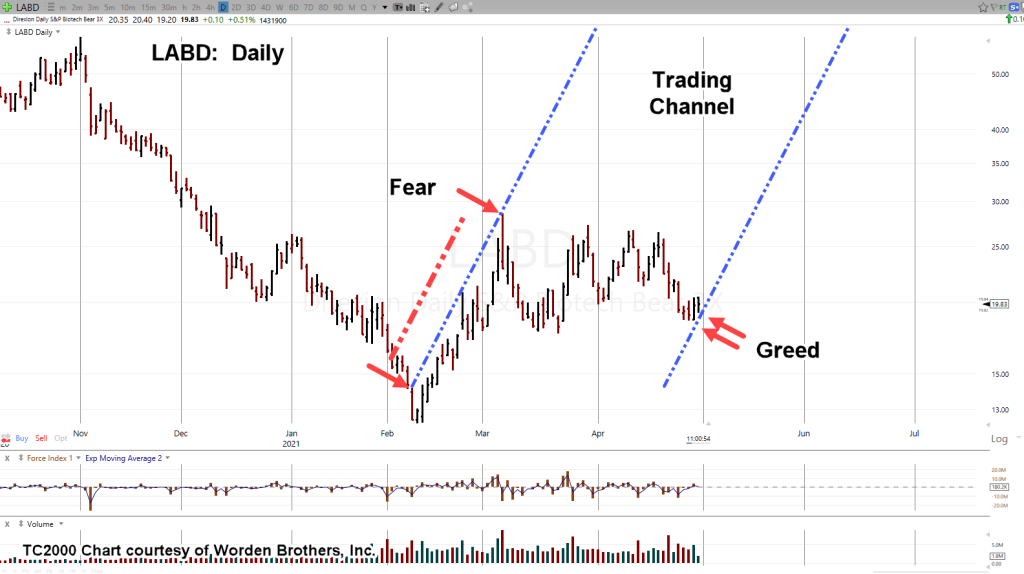
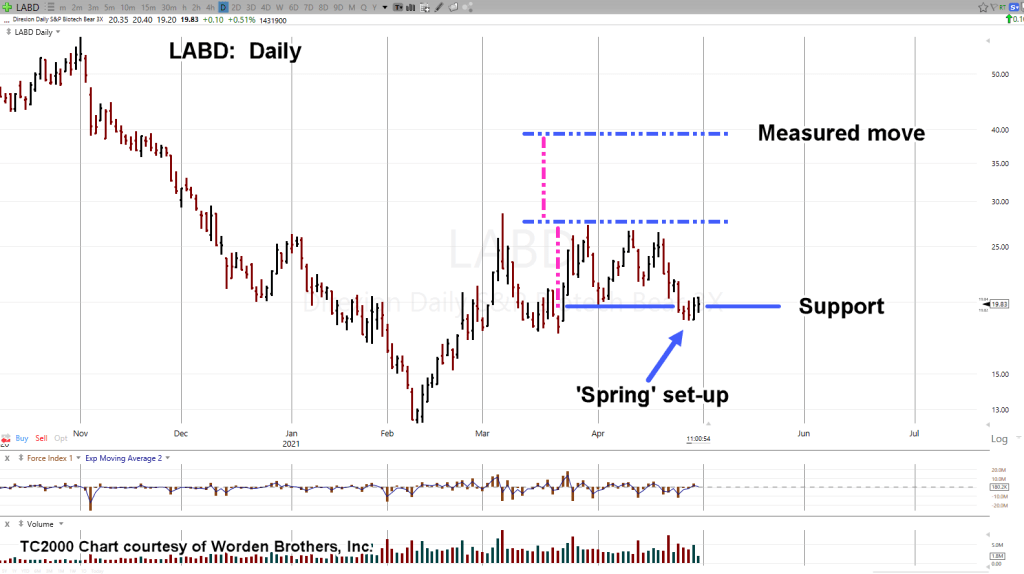
With that in mind, the daily chart of inverse biotech fund LABD, has been noted showing both emotions:
Extreme fear shows up as spikes at the trend line. Also noticeable, the spikes are widely spaced.
Greed on the other hand, is spaced closer and harder to detect. Remember, we’re looking at the inverse (LABD); fear and greed locations are swapped.
Moving on to the set-up, the Wyckoff spring:
Considering the current situation … i.e. valuations, margin debt, retail participation extremes, the above forecast is a modest one.
A potential doubling in value (measured move).
The expectation is for LABD to contact the upper trading range somewhere around 27.50 (not advice, not a recommendation).
If it does and then breaks to the upside, a standard measured move (trading range distance, magenta lines) would target the 40-area.
At this juncture, the market (SPBIO) is giving no overt indication of imminent collapse.
This is how markets work.
If we do get the expected wipeout, be prepared for the usual suspects to come out and say ‘No one saw it coming.’
Stay Tuned
Note: Posts on this site are for education purposes only. They provide one firm’s insight on the markets. Not investment advice. See additional disclaimer here.
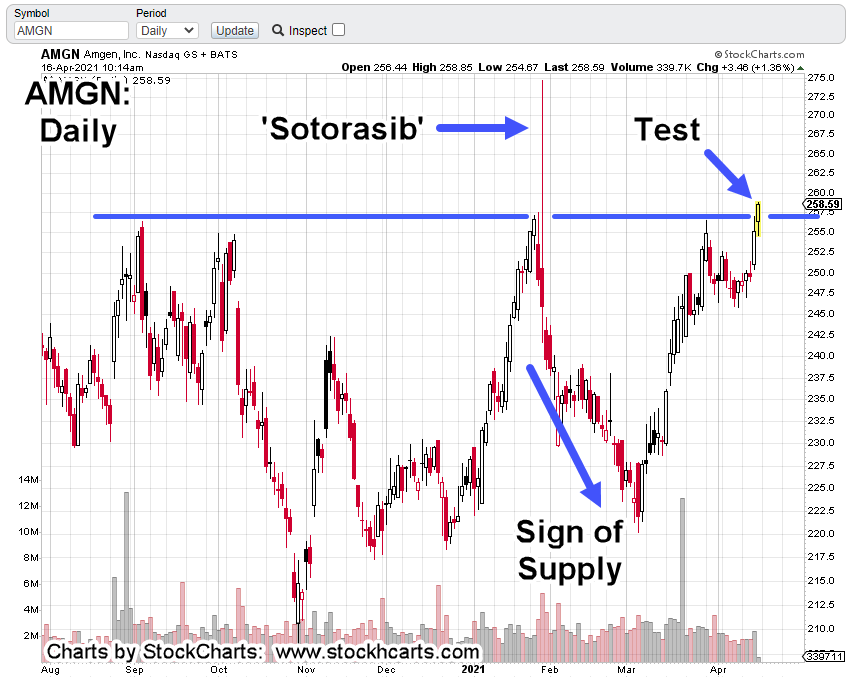
Amgen’s sotorasib news could be its all time high.
Immediately following that announcement, AMGN went into a 20% decline (‘sign of supply’).
In Wyckoff terms, we can look at the action from late January to now as a massive ‘up-thrust’ (false breakout).
That up-thrust is now being tested … with another breakout attempt.
If that’s the case and the test fails with price action retreating from here, then AMGN’s set-up for a significant downward reversal.
Significant in that we’re not (ever) coming back to these levels.
That statement might seem hyperbolic and it very well could be.
However, when one looks at reports like this, insiders are bailing out; leaving “retail” holding the bag as usual.
Fundamentals:
Although not directly related to AMGN, we have yet another horror show in the biotech arena.
The wheels are falling off the ‘speck’ false narrative; tragically so.
The following is taken from the comment section of the video post:
From the guy who filmed :
“Less than 5 minutes from getting God knows what injected inside them the two people to my left starting having seizures. First the gentlemen in the red car was watching in shock as the driver next to him was having a seizure. Little did he know he would have one right after him. I called the medics to help him. They have a procedure where after you get the shot you have to wait in the car for 15 min and if something goes wrong to honk your horn and someone will show up. Well these folks to my left just passed out into seizures with no warning.
You would think it’s just a matter of time before this reaches some kind of tipping point; where enough of the herd realizes all at once, the lie.
Positioning:
The last post has us breaking the rules. Was that the right thing to do?
This morning’s price action has the answer: Yes.
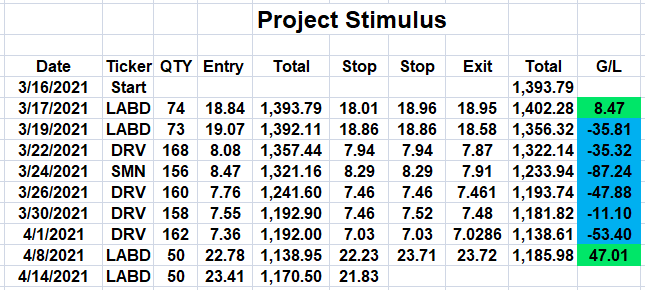
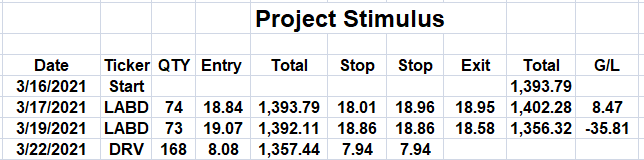
The Project Stimulus table has been updated to include the new (hard) stop level. With LABD currently up a good 5.50%, and looking to move higher, it’s not likely the stop will be hit.
There is one caveat: As of this post, IBB has not printed a new daily low. That leaves the (slight) possibility open for a move higher.
Several attempts have been made to short biotech via LABD (not advice, not a recommendation). It looks like the current attempt is underway.
Note: Posts on this site are for education purposes only. They provide one firm’s insight on the markets. Not investment advice. See additional disclaimer here.
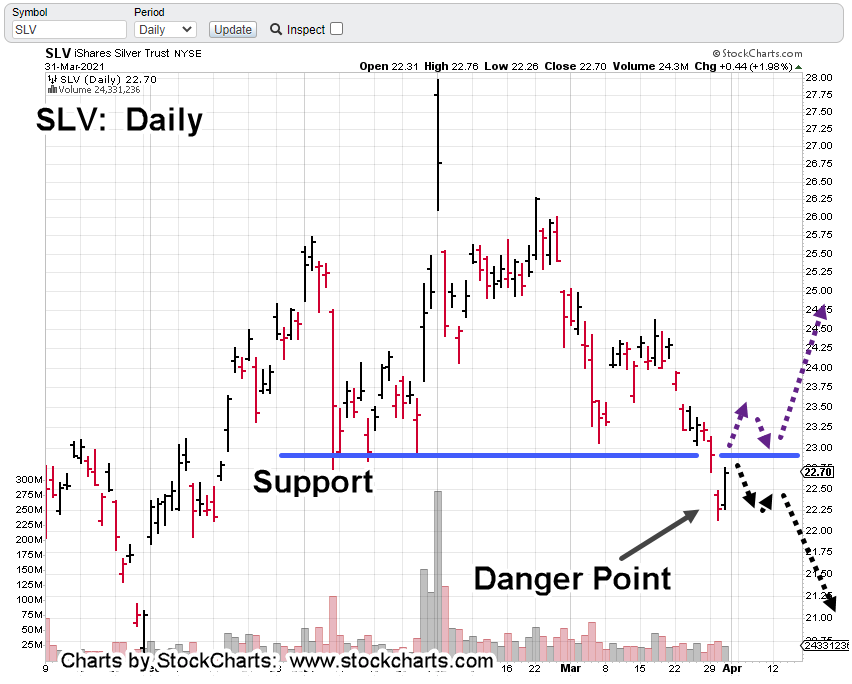
Silver, SLV’s at a juncture where it can either go sharply higher or continue lower from here
Punching through support puts SLV at the danger point.
Whenever price action penetrates support and hesitates, it’s in Wyckoff spring position; poised to move higher.
Because we’ve got a weekly MACD bearish divergence in addition to a huge volume ‘changing of hands’ on February 1st, probability would favor downside action … continuing on to 17.50 – 18.00 area.
Nonetheless, SLV could rally from here … even in the midst of a longer term bearish (deflationary) environment.
The precious metals sector is a crowded trade and one to be avoided (not advice, not a recommendation).
An interesting post on the current inflation/deflation scenario is here.
Note: Posts on this site are for education purposes only. They provide one firm’s insight on the markets. Not investment advice. See additional disclaimer here.
‘The next twenty minutes are going be long and boring. You might want to skip to the end to see the conclusion.‘
His rabid and loyal fans then proceed to hang on every word of his self professed ‘boring anecdote’ until the very end.
Not saying this site’s in the same league as Harrell’s.
Just saying, the following is going to be a tedious discussion of American Tower (AMT) and how it just might be ready to start an Elliott Wave III, down.
Market Extremes:
Its been no secret. The markets are at price levels and valuations never before seen.
In this site’s opinion, going long anything, is insane.
There could be a break, upset, world event, container ship run aground (oh, wait…), cyber attack, volcanic eruption (oh, wait …), major earthquake, nationwide weather freeze (oh, wait…) food supply disruption (oh, wait…) bond bear raid (oh, wait…) currency devaluation, or any myriad of disconnects that would instantly change the dynamic.
Change the dynamic in such a way as to make low-risk long exit, or short positioning impossible.
This site has documented several times where major brokers have already gone off-line as a result of markets fluctuating to the upside.
What happens when it turns down? Good luck getting out.
Looking for the (short) entry:
Its been an on again, off again, and back on again affair with shorting real estate, IYR. Anecdotal evidence such as Jerimiah Babe’s updates from his area, show the market’s been vaporized and is not coming back.
We’ve shown from a Point & Figure chart perspective, IYR has built significant price action congestion.
In Wyckoff terms, congestion equals potential.
The IYR index has built enough congestion that if/when the reversal comes, price action has potential to decline below the 2009, lows.
American Tower (AMT) Symmetry:
Now, for the analysis of AMT.
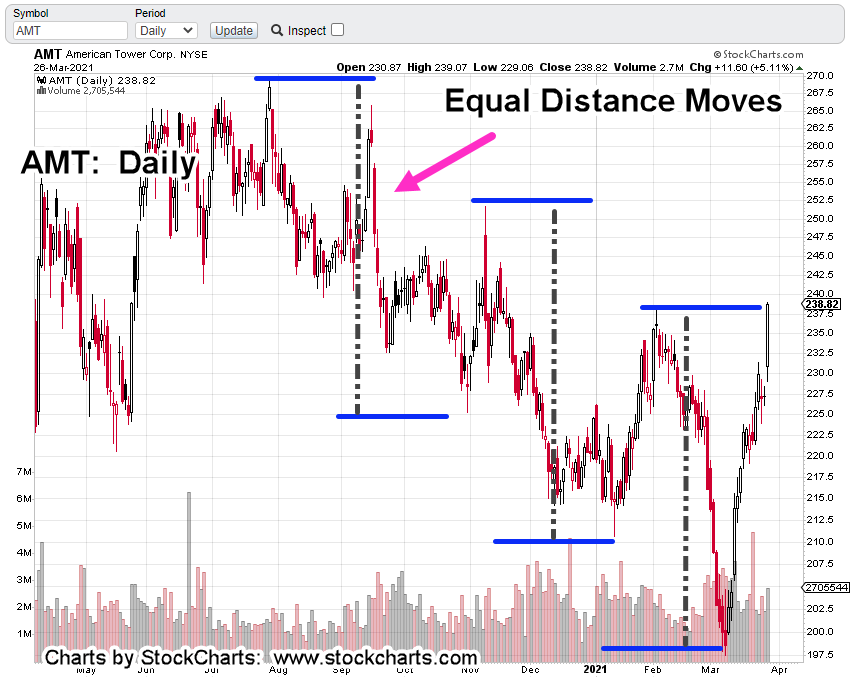
We’re going to start with the daily chart which has an interesting pattern of equal distance moves (or waves):
This equal move structure gives a hint that something’s up. The market’s moving in an orderly fashion. But what order?
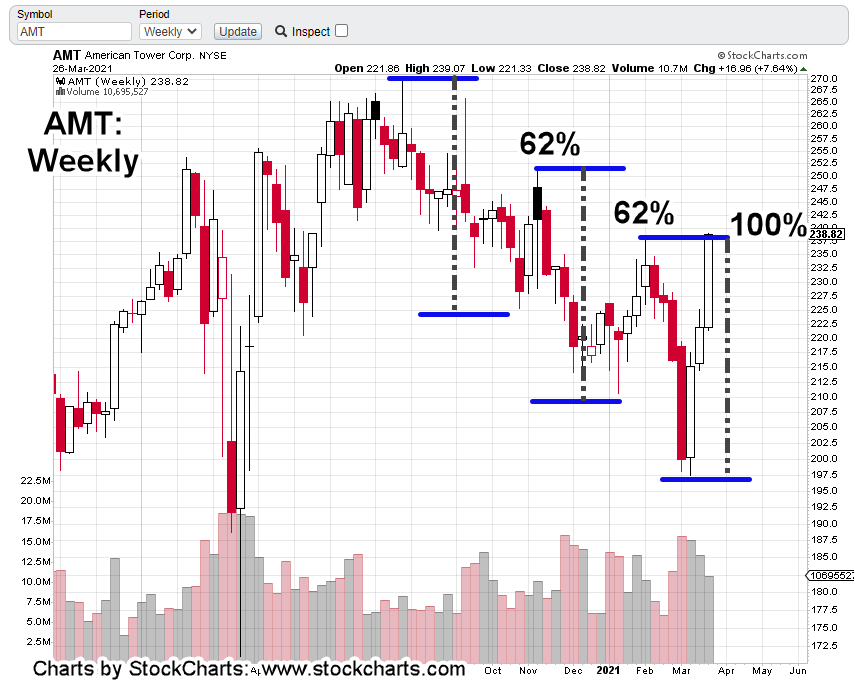
To add more intrigue, we’ll go to the weekly chart. We see each retrace of the two initial waves, was Fibonacci 62%.
The last retrace (up to Friday’s close) is essentially 100%.
Looking up Elliott Wave “equal waves” turns up this presentation. It helps some but does not cover the current situation. The take away from the video is that equal waves do occur.
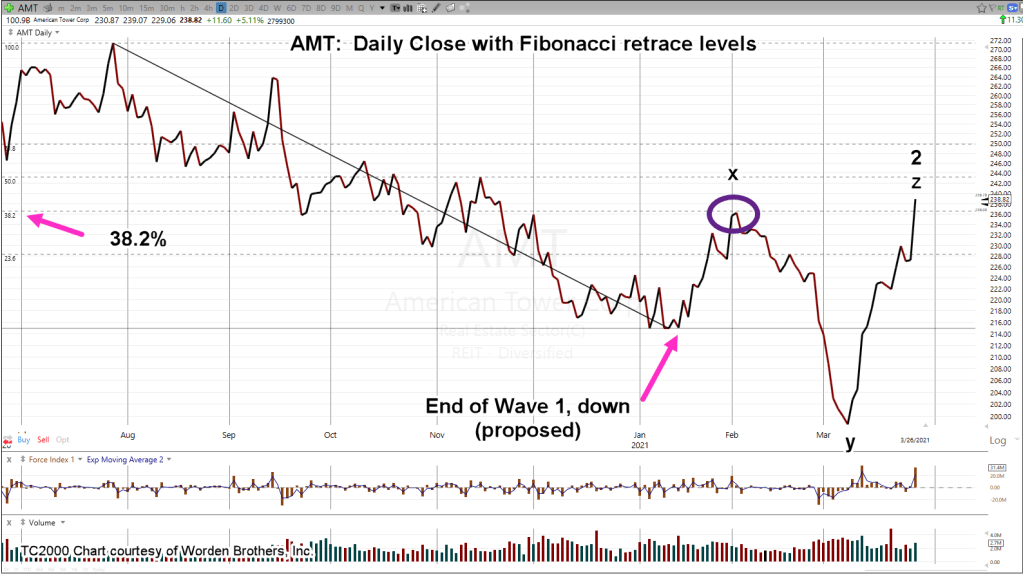
Looking at the daily close chart of AMT gives us this:
The Wave 1, down is placed at the low extreme. Price action then corrects to pivot (magenta oval) at the Fibonacci 38.2% retrace level.
It’s a near perfect retrace.
The reason to think AMT just finished a complex correction that terminated at “z” which is also “2”, is the structure of the fifteen-minute chart below.
The first chart is unmarked except where price action changes character:
Then we put in the Fib projection tool at that location; the inflection point, to get the following:
Incredibly, the top of Friday’s price action is also a Fibonacci target (423.6%) projection.
Getting back to the daily chart and labeling it using the above information gives us this:
Removing all but the labels is more clear:
There could be other ways to label the structure. It may become (very) apparent at the next open whether this interpretation is correct.
However, coupled with yesterday’s analysis of IYR, and its technical condition (at the extreme), we get the sense we’re close to some type of price action hesitation or outright reversal.
Summary:
We’re short this sector via DRV (not advice not a recommendation).
Price action appears to be at extremes and is meeting Fibonacci and support-resistance levels simultaneously.
Not related but an interesting coincidence (maybe): Van Metre’s update on Friday night:
“Is This a Sign Real Estate Prices Have Peaked?”
The futures markets just opened … S&P down 7-points. Let’s see what happens next.
Note: Posts on this site are for education purposes only. They provide one firm’s insight on the markets. Not investment advice. See additional disclaimer here.
Bonds could be reversing but have already pushed rates high enough (long enough) to choke-off critical sectors of the economy like here and here.
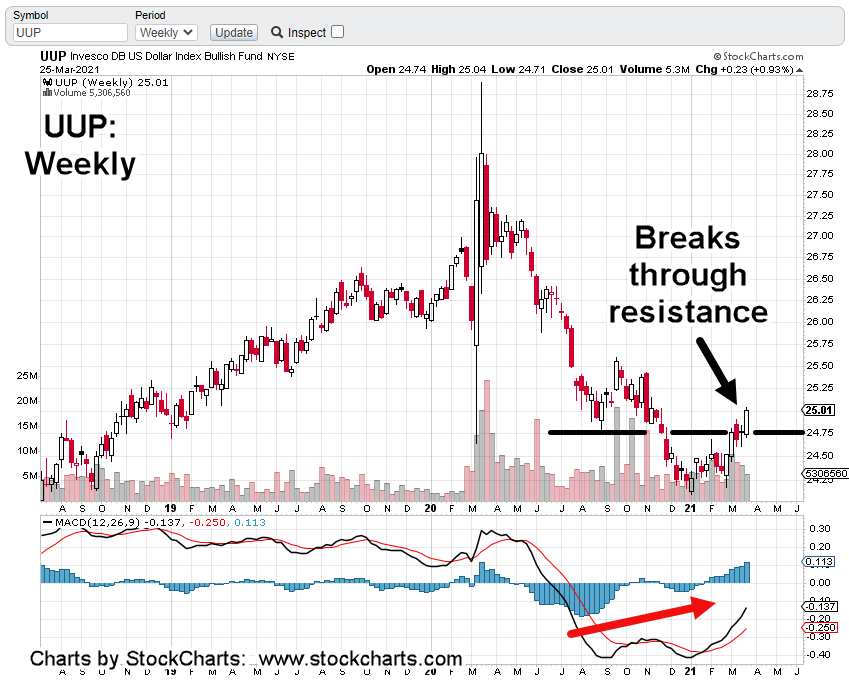
Now we see the dollar has bottomed as well.
It looks like a strong multi-month (or year?) rally. Correspondingly, gold is weak. The overall markets are stretched to ever-livin’ extremes; never before seen.
Whenever this baby pops, try logging on to chaos, or exit any position (except maybe for the long bond).
Our approach then (not advice, not a recommendation), is continue work on positioning short. So far, the ‘project’ is taking small hits in those attempts. We’ll see how basic materials (SMN) works out today.
Note: Posts on this site are for education purposes only. They provide one firm’s insight on the markets. Not investment advice. See additional disclaimer here.
Yesterday’s swift move lower in IBB looks like the start of the next leg down.
Update 10:34 a.m. EST in red below:
Closer inspection however, shows biotech could pivot and move to higher levels … if only temporarily.
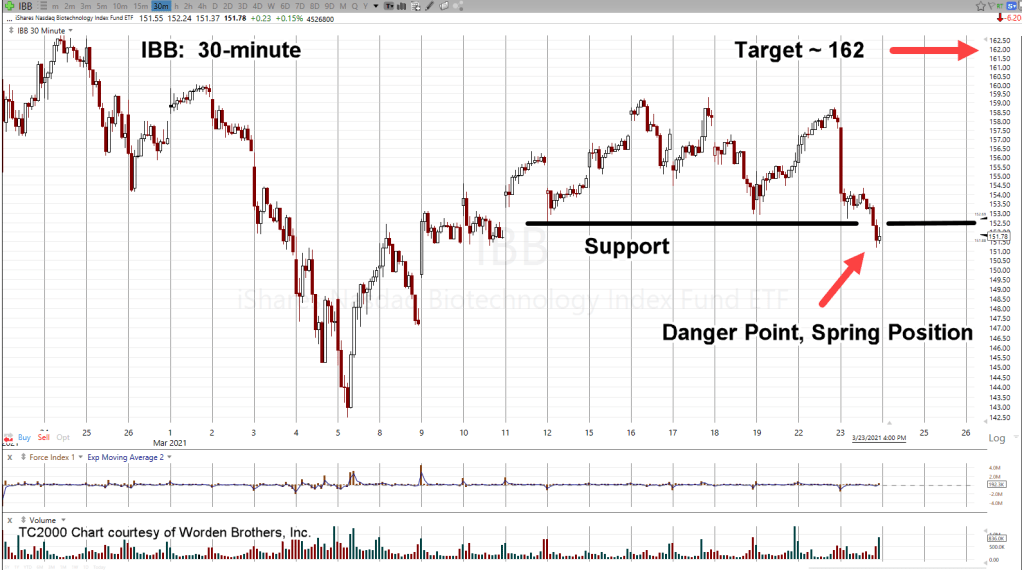
We’re looking at the 30-minute chart of IBB. Yesterday’s action penetrated minor support and stopped dead.
When price action behaves in that manner, it puts the index in what Wyckoff called ‘spring position’ ready to move higher.
Then we have the wide 30-minute (red) bar from the session; likely to be tested. To do that, action needs to move higher.
The target area is near a 62% retrace of the entire down move from the high on February 10th, to the low on March 5th.
Note, yesterday was a Fibonacci Day 13, from that March low.
Even though IBB’s likely to move higher, we’re leaving it alone.
If action gets to the target, we’ll be ready to short (via LABD) if there’s opportunity.
Update:
It’s not called “The Danger Point” for nothing.
Price action penetrates deep below (minor) support effectively negating the ‘spring’ scenario discussed.
We’ve now penetrated below another support level
Price action can still spring upward from here … although probabilities appear to be fading.
Either way, we’re not interested in going long at historic valuations.
Separately, our ‘project’ has maintained short real estate via DRV (not advice not a recommendation), to be covered in a later update.
Stay Tuned
Note: Posts on this site are for education purposes only. They provide one firm’s insight on the markets. Not investment advice. See additional disclaimer here.