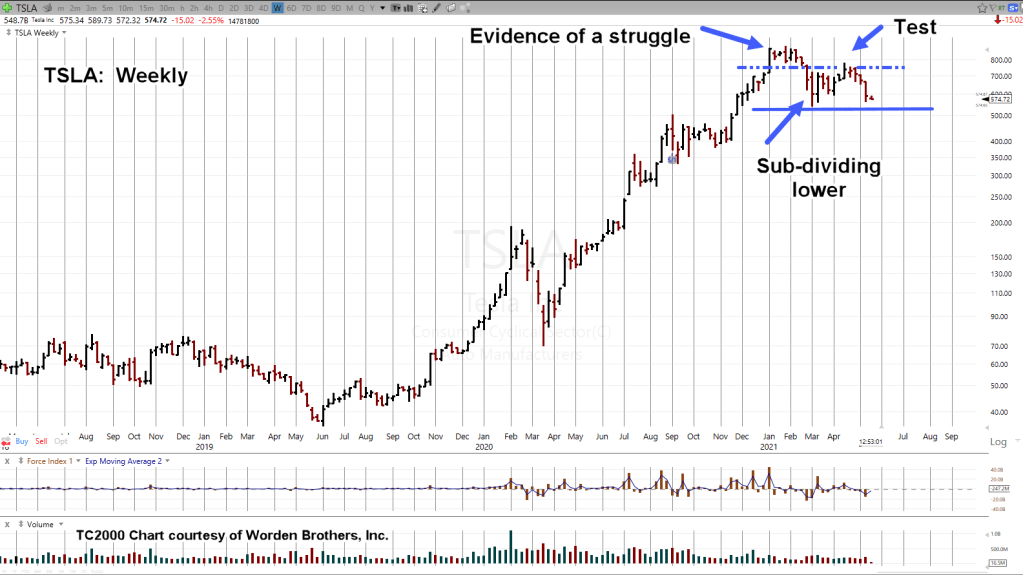
Early this year, TSLA spent about seven weeks attempting to move significantly higher.
During the week of February 26th, it gave up and broke down.
Since then, its come up to test the underside of support … now resistance (around 740) before again, turning lower.
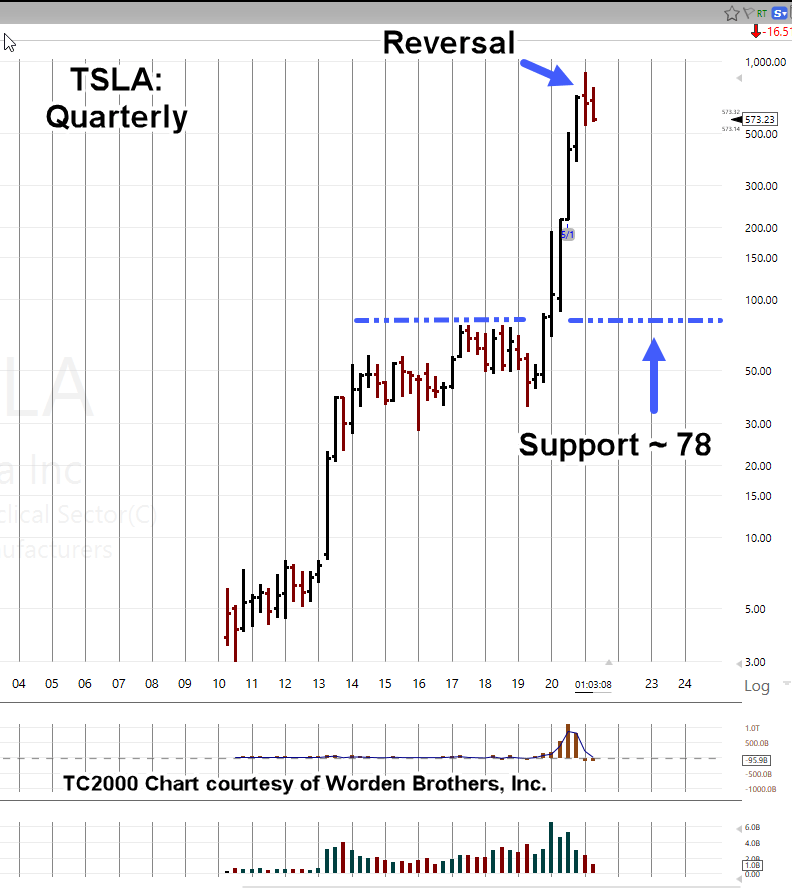
Down -37%, since the end of January sounds bad enough. However, it’s the quarterly chart that contains the real horror story.
TSLA has posted a huge 490-point trading range (when taken from support at 78, to current price).
A down move to support from today’s levels, is a decline of -86%.
Markets like to come back and test; better to count on it, than ignore it.
Not saying that will happen to TSLA.
Nearly simultaneous with this first post, we have this article on ZeroHedge about a huge short position.
However, if any real problem does come up like another high profile ‘incident’ (as if we don’t have enough of them already), meaningful support is a long way down.
Just a few hours later, we have this, also from ZeroHedge about a Tesla running over two police officers … in China no less.
Note: Posts on this site are for education purposes only. They provide one firm’s insight on the markets. Not investment advice. See additional disclaimer here.
After watching and listening to all segments, if you changed the dates, you’d think it’s talking about the here and now.
Three key takeaways are:
Intentional destruction of the food supply
Real unemployment numbers falsified
People starved to death
We can look at today’s payroll data as a pivot point. For whatever reason (out of work, being paid not to work), the economy’s not coming back.
The belief the economy’s going to be stronger once the benefits run out (as stated in the linked article) is false.
The current economy is being intentionally destroyed.
That’s not too hard to determine.
Here’s just one more bit of data (unverified, but still of note) to support that assessment.
If you’re unemployed, starving to death, you’ll be a ready face-diaper wearing compliant subject; easily coerced into being injected (executed).
Obviously, the goal is to be as independent, self-employed as possible so we’re not that person.
Which brings us to the culprit du jour: Biotech.
Yesterday, the expectation was for a reversal and test (that day) before SPBIO continued its downward trajectory (LABD higher).
It looks like the test is lasting two days (maybe more) instead of one.
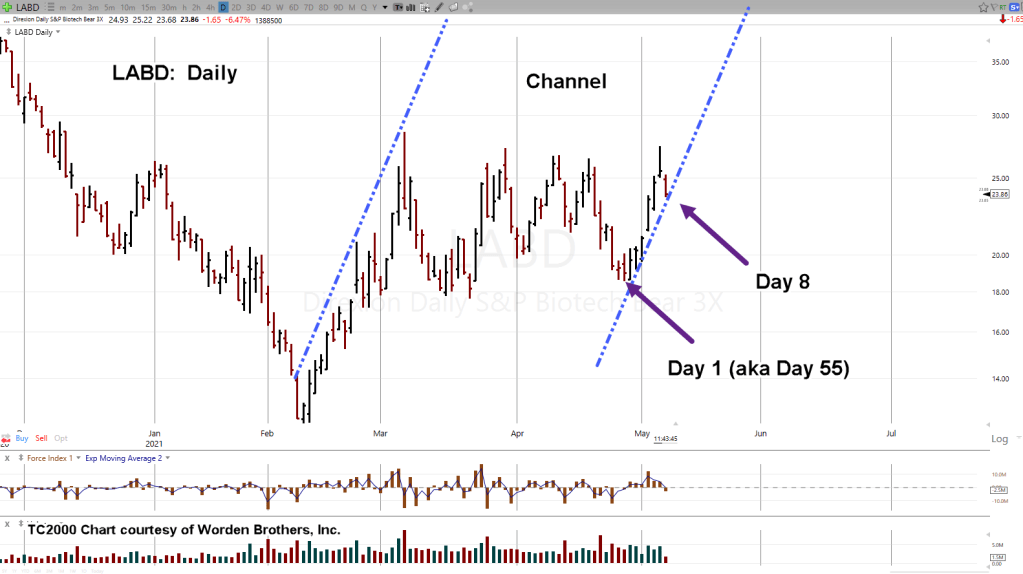
Inverse fund, LABD is currently trading near 24.15. That’s right in the vicinity of the expected range between 23.90 – 24.30, stated yesterday.
LABD did push a little bit lower in the early session to 23.68, but still within expected range.
LABD is testing the right side channel line and trying its best to break through. Thus far, the low for the day remains at 23.68.
If there’s an upward (LABD) reversal from here, a Fibonacci Day 8, from the original Day 55 low, it would give more confirmation we’re at least following the trendline; potentially at the very right side of a huge trading range.
Stay Tuned
Note: Posts on this site are for education purposes only. They provide one firm’s insight on the markets. Not investment advice. See additional disclaimer here.
Yesterday, was an upward push that wound up being an ‘out-side-down’ bar (GLD, GDXJ, SLV) … a reversal in itself.
That’s not in the script. Or, is it?
At this point, the public’s literally redirected, manipulated, at will. It’s a sick game being played by all who control the media.
From a personal standpoint, I’d rather make some popcorn, take my red wagon full of fiat, go camp down around $800/oz., and wait.
The gold ice cream man may never show up. If he does, great.
If not, there’re other opportunities; at least I’ll not be one of the manipulated masses screaming inflation hyperbole if/as/when gold ratchets all the way down.
Stay Tuned
Note: Posts on this site are for education purposes only. They provide one firm’s insight on the markets. Not investment advice. See additional disclaimer here.
It’s mid-session; Amgen (AMGN) is down 7.6%, after a poor earnings report.
The last update on AMGN, linked here, had this to say:
AMGN peaked three days later.
The chart below shows it was a Fibonacci 34-days from the 3/4/21 low, to the 4/21/21, high.
On the fundamental side, we have this explanation for the breakdown.
Missing from the earnings report, not only is customer traffic less this past quarter, it’s going to get (if our research is accurate) a whole lot less as customers literally die-off en masse.
Moving on to biotech SPBIO and 3X inverse, LABD:
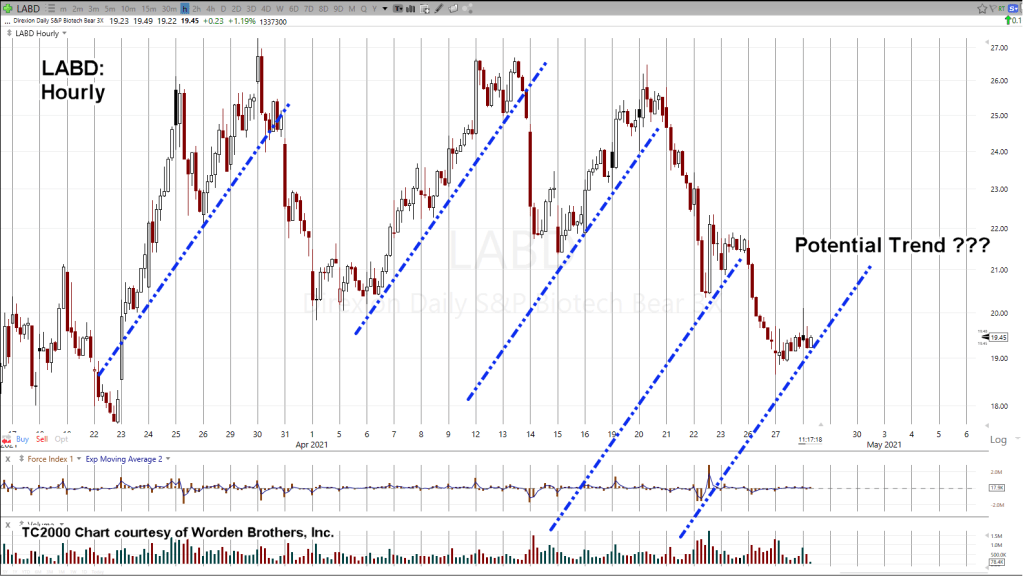
As shown in a prior update, LABD has repeating trendline characteristics.
Hourly chart of LABD, below:
We’re still very early at the right side of price action to identify a trend.
However, it’s good to know what LABD ‘likes’ and expect that behavior again.
The daily chart is updated with the Fibonacci 34-day time-frame discussed previously. We’re still within acceptable time error for a potential channel.
If LABD does not reverse significantly higher from here, that potential channel will likely be negated.
Summary:
Linked here, is an article just out on ZeroHedge. It discusses the ‘complacency’ of the market and how it’s ready for a long lasting reversal.
Buried within the report (and claiming ‘fair use’ to quote) we have this nugget:
Note: Posts on this site are for education purposes only. They provide one firm’s insight on the markets. Not investment advice. See additional disclaimer here.
All of the above provides the backdrop for biotech.
It’s interesting (then again, not really) how this sector’s nascent bear market’s being ignored by the financial press.
Instead of a breakout to the downside (as expected), yesterday the sector SPBIO, decided to test the 23.6%, retrace area.
Today’s early session was spent testing (to the upside) the resistance area.
Price action is now tentatively reversing; about to head lower again.
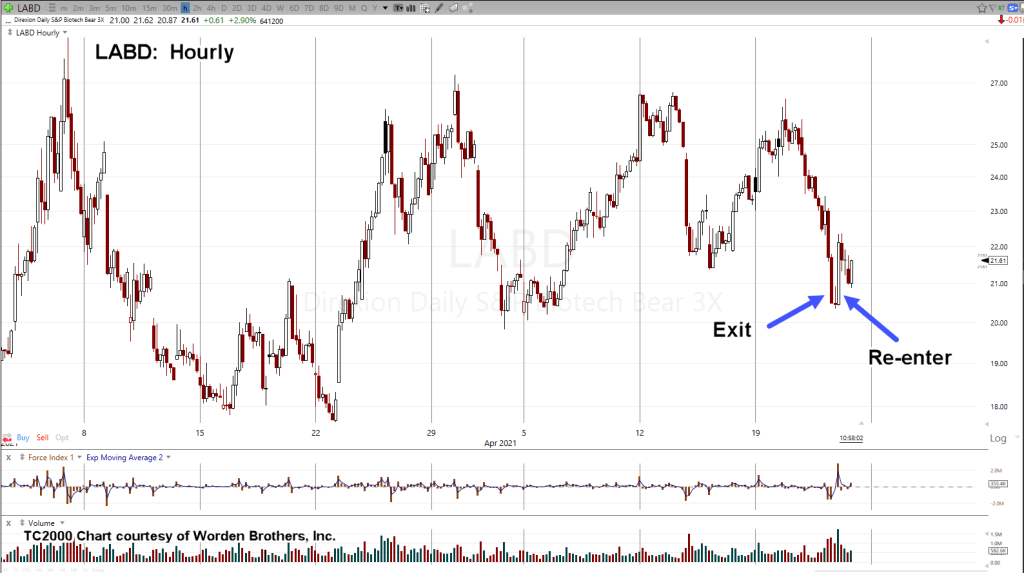
The hourly chart of LABD (3X inverse SPBIO) shows yesterday’s exit (well past the stop) and re-entry of the short position; not advice, not a recommendation.
For reasons that may be covered later, the stop was not in the market at the time.
In addition, there was a trading platform lock-up (on the broker’s side) at exit and re-entry. A series of amateur-like errors all around.
It’s just a reminder to all; when the market turns lower in earnest, brokers and their trade platforms may (probably will) become inoperative.
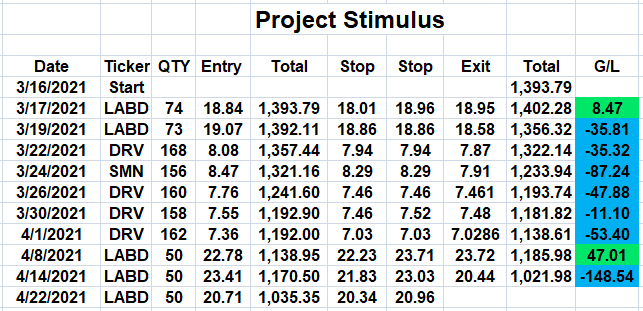
The whole event resulted in a significant ding to our ‘project account’
How quickly can this recover … we’ll see.
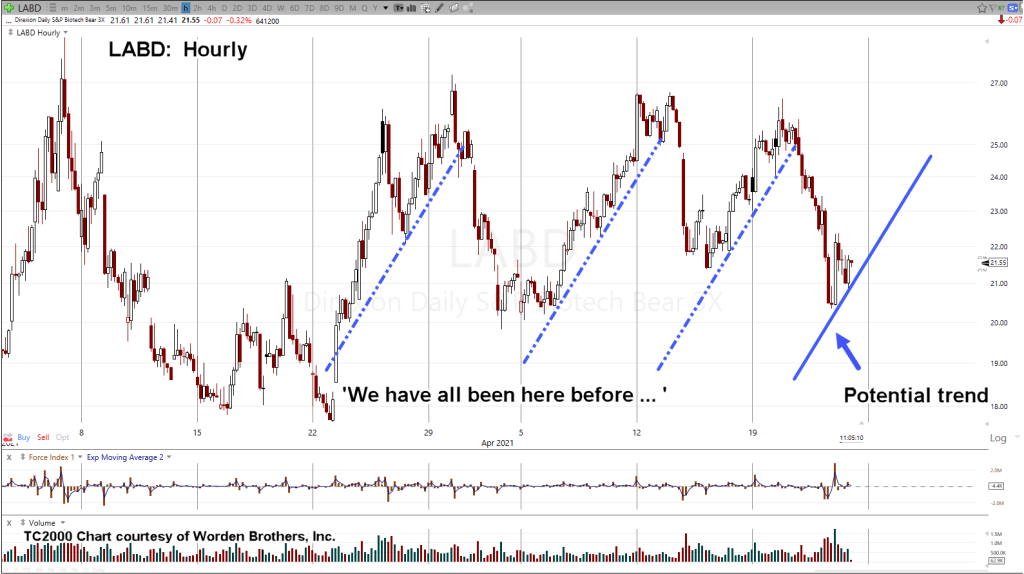
Below, we have the hourly chart again … but noted with what looks like a nascent trend.
That trend line was copied and re-positioned over prior LABD moves.
Note how this market repeats its characteristics. This angle of trend line has happened three times in the past month.
We’re back in position. The chart has been updated and the stop (now in the market, GTC) listed at 20.96 (above break-even):
Note: Posts on this site are for education purposes only. They provide one firm’s insight on the markets. Not investment advice. See additional disclaimer here.
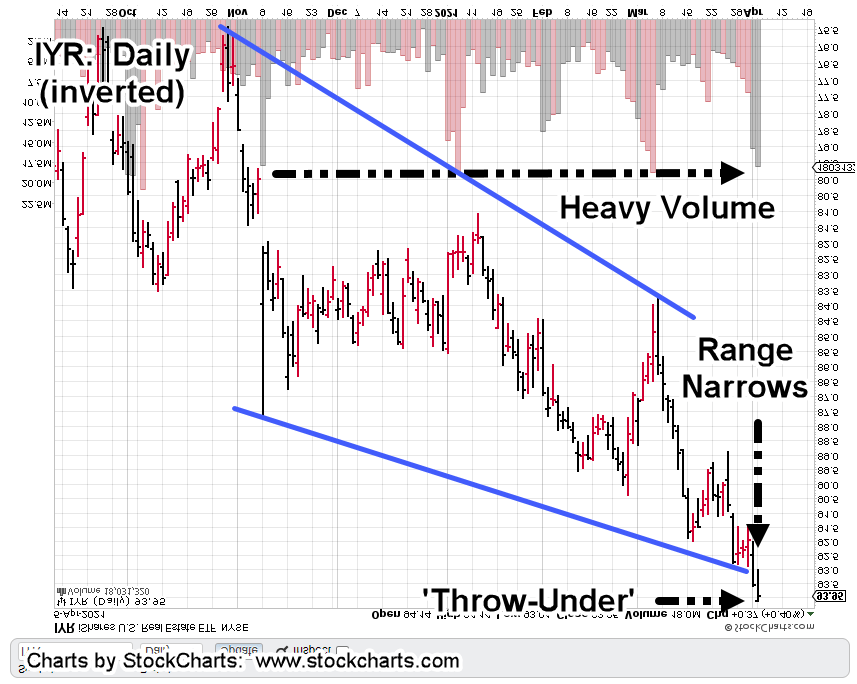
Volume increases on IYR; range contracts even further.
In what’s beginning to look like its been taken straight out of David Weis’ training video on ‘trend reversals’, volume has surged and range has contracted drastically.
The last update had range contracting down to 1.83% (from 9.77%).
Now we’ve got yesterday’s range down to 0.60%; volume up to 18-million shares … the highest since October 2nd, last year.
One of two things is happening.
It could be absorption for a new leg upward to ever higher, highs.
Note: Posts on this site are for education purposes only. They provide one firm’s insight on the markets. Not investment advice. See additional disclaimer here.
This is going to be one of those technical discussions that are tedious and long-winded (also to include at least one boring anecdote).
If desired, go to the Summary for the CliffsNotes wrap up.
For the rest, let’s get into it:
A quick look at the news and financial sites has the inflation narrative still raging.
This link to an article on ZeroHedge offers a slightly different perspective than one-way hyperinflation.
At least it says deflation is a possibility.
Back in the day, I used to read as many of these press releases as possible; combine them, put them in a spreadsheet, develop a ‘voting’ system (with variable adjusted algorithmic weighting), look at buy and sell recommendations, try to figure out if MACD, RSI and Stochastics could predict the next move … and then, I would watch Wall Street Week with Louis Rukeyser.
It’s a frustrating, unprofitable exercise that was ultimately abandoned while the search for market truth carried on; only to be found much later in 2007; that’s a story for another time.
There’s nothing wrong with Rukeyser. In fact, I did use his program (once) in what was at the time, a trade of pure intuition.
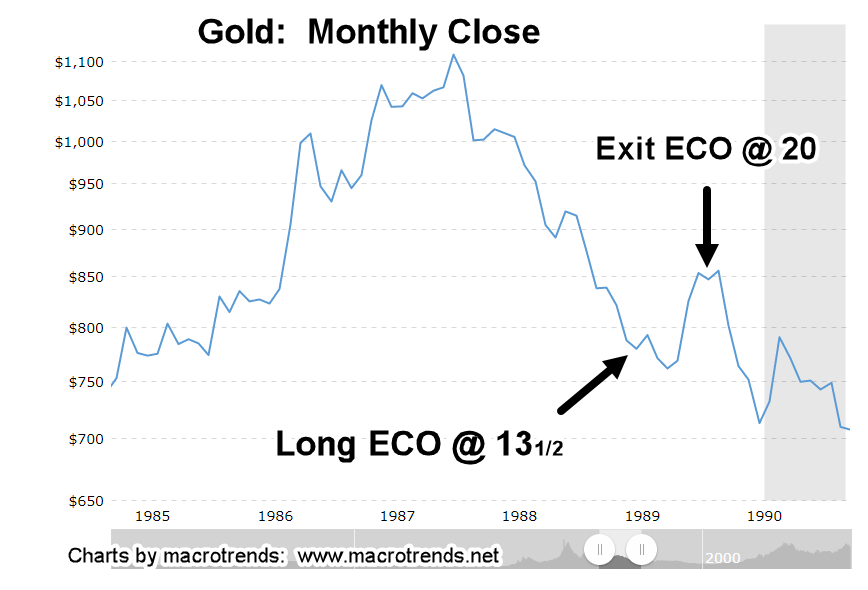
During his opening monologue (probably May 19th, 1989), Rukeyser talked about gold reaching multi-year lows.
The sense was ECO had slowed its decline and seemed ready to move higher. Gold also felt like it might retrace part of its decline.
The trade result is on the chart below:
The entry date for going long ECO was May 22, 1989, a Monday.
That would seem to follow if Rukeyser’s gold statements were on his (prior) Friday broadcast.
As the chart shows, gold bounced and then went slightly lower before going into a sharp (but short) rise.
The exit came on January 23rd 1990, right at the top of the brief move.
Once again, it was from intuitive feeling that gold had reached some kind of stopping point.
What solidified thinking ‘we’re at a top’, was Joe Granville coming out in his newsletter that he was going “all-in” on gold.
At the time, Granville was not making good market calls. This one seemed like a stab for attention as by now, gold was in the news.
To add to the nostalgia (looking at the confirmations), commission for going long (100 shares) was $47.60 and for getting out, $49.00
Many decades later and in retrospect, the trade worked because it was sentiment based.
After declining steadily for two years, gold sentiment was negative. At the top in January ’90, it had tuned positive.
What does all that have to do with today?
Looking at the chart of gold above, you’ll note a sharp rise in price from June of ’86 to October ’86. In effect, it’s a wide price bar.
From Wyckoff analysis, markets tend to come back to wide areas for a test. That’s exactly what we see from December ’87, onward.
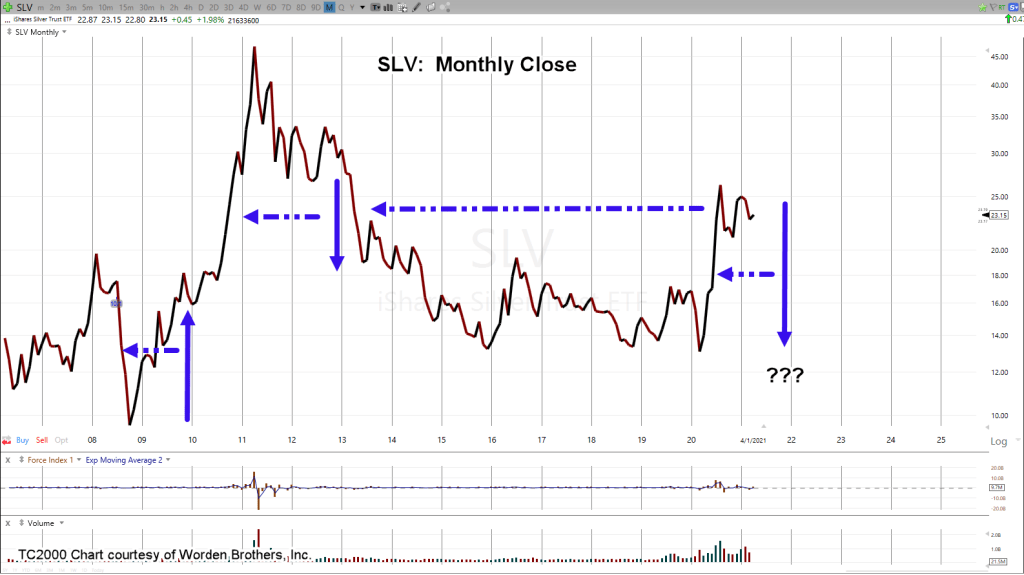
Now, let’s look at the monthly close of silver (SLV):
The chart shows how each wide bar has (ultimately) been tested. Price action either rises to test or declines … but it does test.
This is how markets behave. It’s what they do.
Looking at the current situation for silver, one would think it’s time to exit (if long); anticipating a retrace or go short (not advice, not a recommendation).
There’s a wide bar from the March 2020, low to the August 2020 high, that has not been tested.
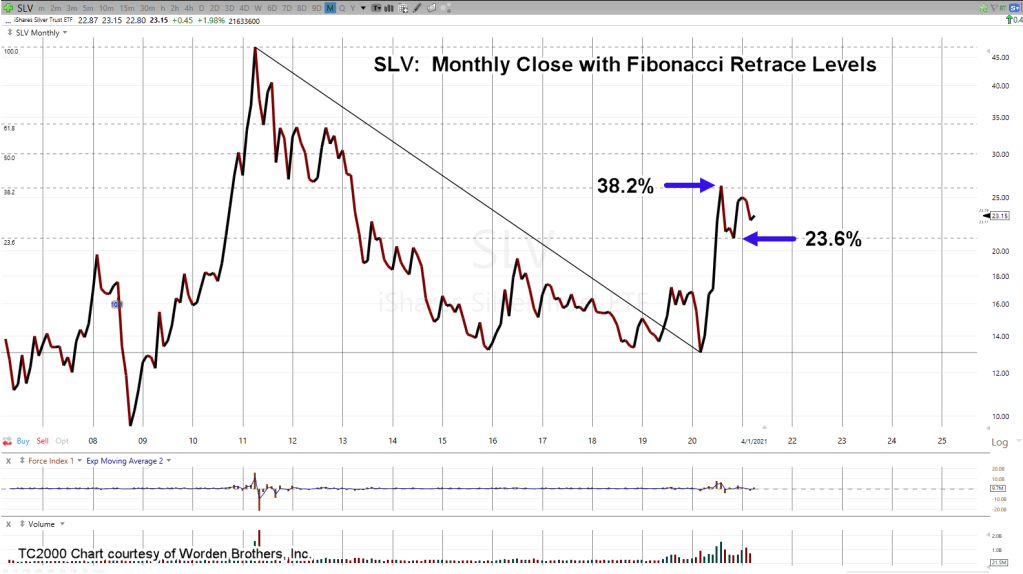
That (test) thinking is bolstered further, by the chart below:
On a monthly closing basis, SLV has pivoted (down) off the 38.2% Fibonacci retrace level when looking at the entire decline from April 2011, to march 2020.
In addition, it tagged the 23.6% level as a pivot to the upside which led into the now famous, but fading fast, ‘short-squeeze’.
It’s important to note, the short squeeze was so weak, it could not even register a new closing high on the monthly chart.
Summary:
It’s not important or profitable to figure out whether it’s inflation or deflation. The important part (and the hard part) is to read the price action itself.
That price action … at least for silver, is saying we’re at a juncture (Friday’s close) where SLV’s in position to retrace and test the wide trading area created from March – August, of last year.
A retrace is possible because that’s what markets do. Our anecdote example from 1989, shows that markets do not change.
If silver, SLV opens lower on Monday, it weights the probability we’re on our way to the 17.50 – 18.00 level and/or a test the March ’20 lows.
If it opens higher, the market’s in spring position (ready to head higher) as described in this link.
Note: Posts on this site are for education purposes only. They provide one firm’s insight on the markets. Not investment advice. See additional disclaimer here.