What’s Next?

We can see how the typical ‘investor’ would be angry; having believed the hype about silver’s imminent ‘hyperinflation’ launch.
Pontificating hype like, silver’s going to ‘catch up’ with gold, ‘go along for the ride’, ‘close the gap’, massive ‘physical demand’.
Well, this so–called ‘launch’ (so far), is not only not happening, but appears to be in a bearish divergence downside reversal … What???
Setting The Stage
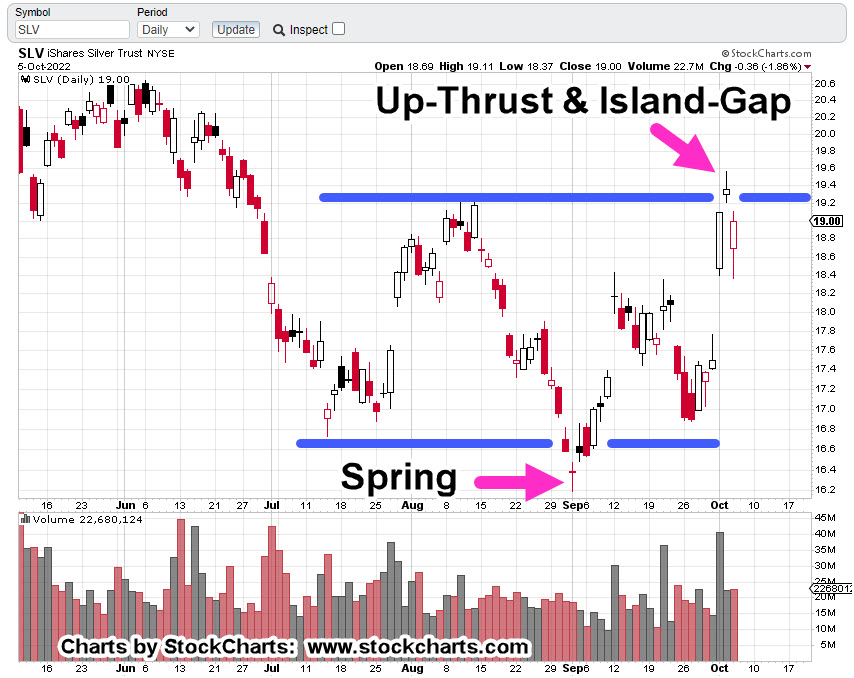
From the recent high set on October 22-nd, to the close on Friday, Silver (SLV) is down -13.3%, a decent hit, but not quite a wipe-out, yet.
Putting that brief opportunity in perspective, during the same period 2X Inverse Fund ZSL, is up over 31.5%.
For a clue on what might be coming next, we’ll go to this anecdote, link here.
The so-called ‘environmentalists’ don’t even believe their own hype.
Not only that, if we’re already in an economic collapse, then silver, an industrial metal, is subject to the same forces.
Pulling Back The Curtain
If or when the new administration takes office (January 20th, is a long way away), we can expect a lot of truth (but not all of it) to come out.
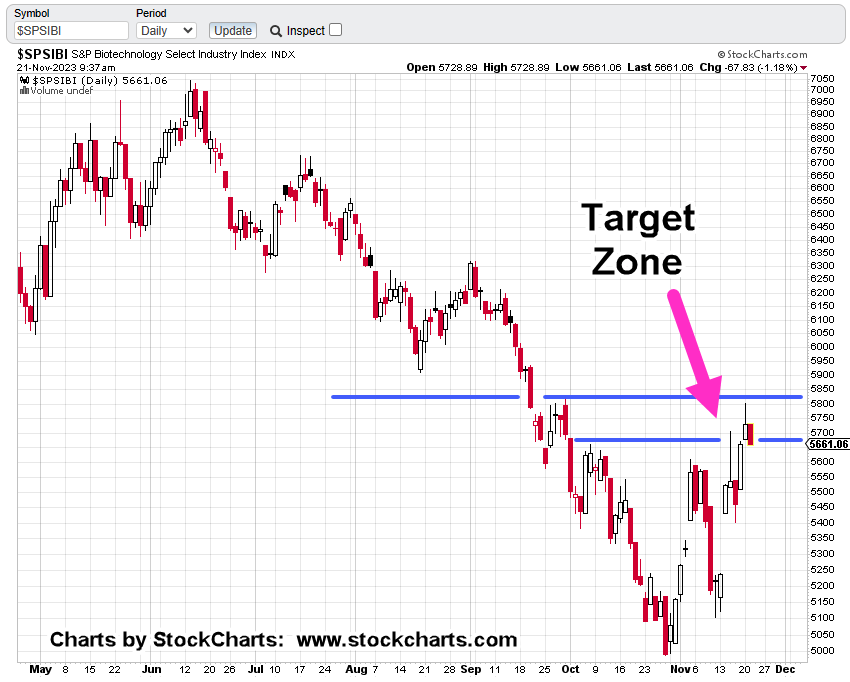
That’s already starting, with the blow-up in biotech.
Random Thought: Wasn’t the dollar supposed to collapse by now? But, I digress.
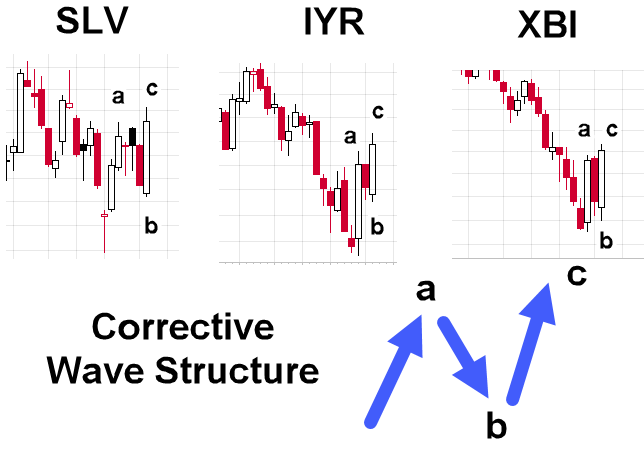
Lets’ get back to silver (SLV), and what the price action is telling us.
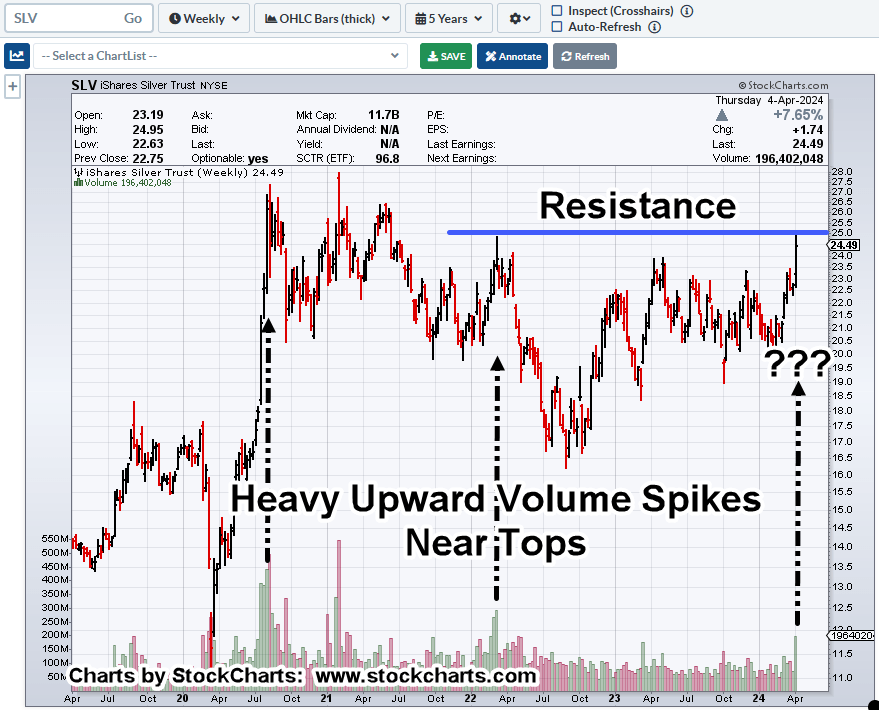
Silver SLV, Weekly
With the situation below, what’s the most likely event for the coming week?

We’ve had four down-weeks in a row. Price action’s at the wedge boundary (blue line) and minor support (black dashed line).
Last week was a narrow range bar with less overall volume than the week prior.
Therefore, the most likely event, is an attempt to retrace the prior four weeks of down action (not advice, not a recommendation).
Stay Tuned
Charts by StockCharts
Note: Posts on this site are for education purposes only. They provide one firm’s insight on the markets. Not investment advice. See additional disclaimer here.
The Danger Point®, trade mark: No. 6,505,279