So, what comes first? The market implodes with bonds (likely) moving higher?
Or … bonds break lower, icing on the cake for rate-hikes, then move higher as the market tanks … Or, behind door Number Three, they both melt down, together.
The least likely event is that nothing happens (not advice, not a recommendation).
Moving on to the chart.
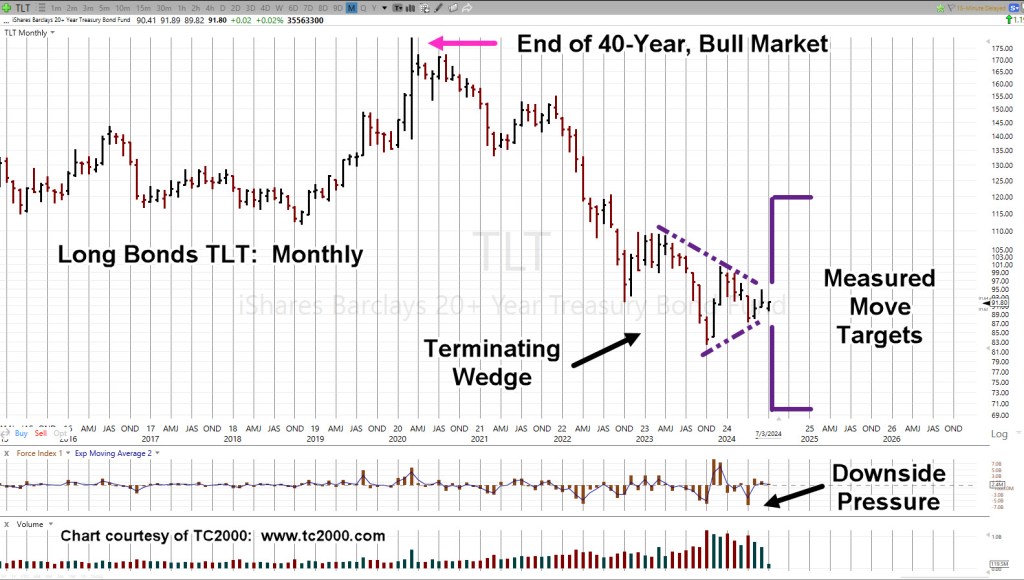
Bonds TLT, Monthly
As shown, the 40-year bond bull market ended during March of 2020.
That was the week of Friday 13th … you can’t make this stuff up (it’s all about the numbers).
One item above, favoring the downside more than up, the last major thrust was ‘downside pressure’.
That thrust has not yet been confirmed with more downside or negated with an upside breakout.
Note: Posts on this site are for education purposes only. They provide one firm’s insight on the markets. Not investment advice. See additional disclaimer here.
Note: Posts on this site are for education purposes only. They provide one firm’s insight on the markets. Not investment advice. See additional disclaimer here.
Before we get to that, let’s first be aware of what’s being presented to the public. This recent link, says that upon increase in production, ‘go short’ (absolutely, definitely, not advice, not a recommendation).
So, the advice is, somehow tie the fundamentals to a trading action?
Given that going short on increase of production would even work (I wouldn’t do it), how is anyone going to figure out whether those numbers are real?
So, we choose not to play the game and instead, go straight to the truth, price action.
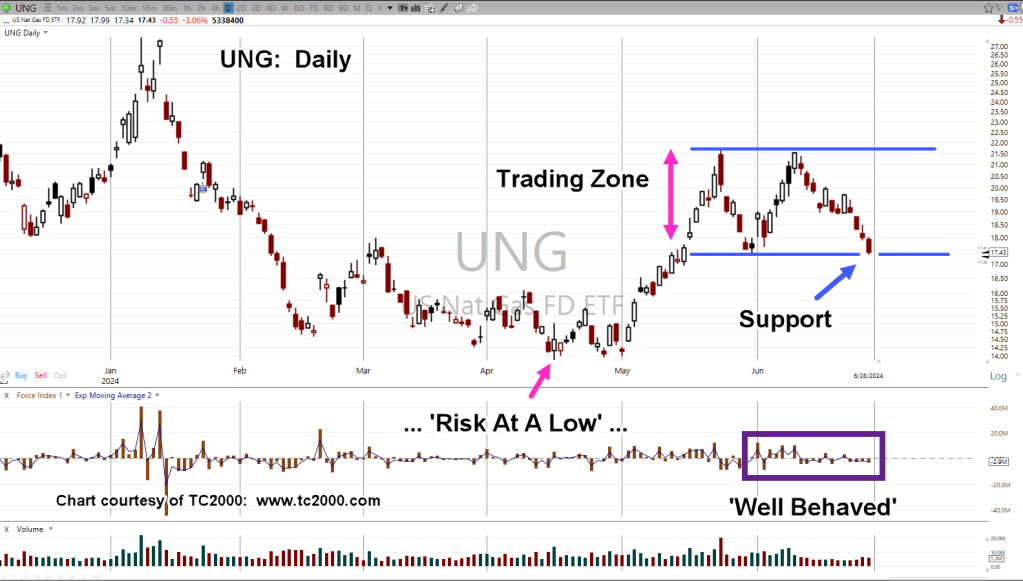
Nat-Gas UNG, Daily
First, it’s important to note the ‘Risk At A Low’, area.
Note: Posts on this site are for education purposes only. They provide one firm’s insight on the markets. Not investment advice. See additional disclaimer here.
Since Wyckoff analysis doesn’t care about the press, we’ll use it to discern the (potential) truth.
Let’s see how it did in the recent past. The Nat-Gas (UNG) low, was identified to-the-day,link here.
From that post, was this:
“Downward thrust in Nat-Gas UNG, appears to be exhausting itself after a 20-month, bear market.Risk is never zero, but currently appears to be at a low … “
So, it was. Afterwards, UNG bounced near, but never touched that low.
Twelve trading days later (Fibonacci 13 days, from low), it reversed decisively to the upside.
The Same, But Not
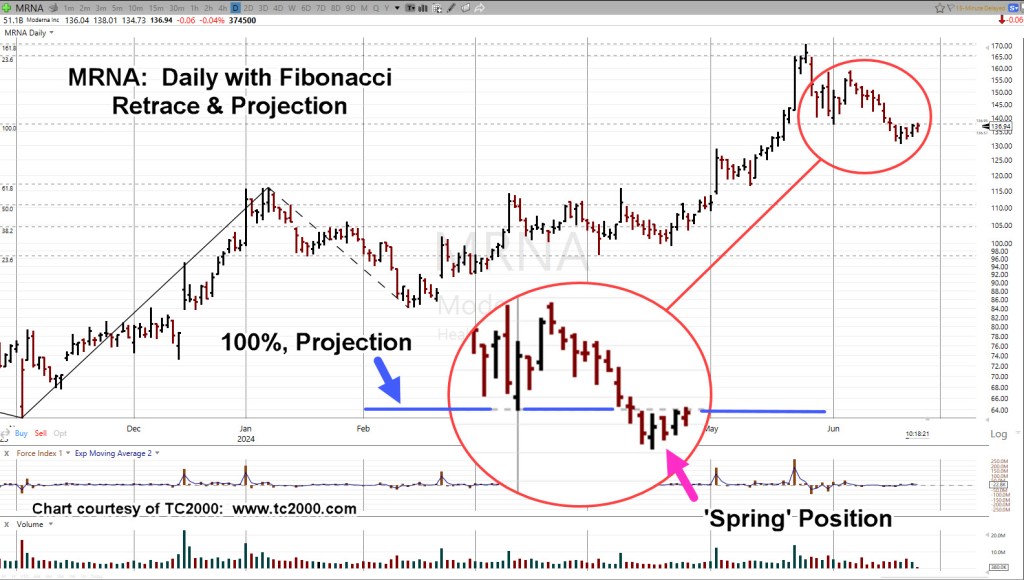
On the medium, to long-term, CORN action is the same as biotech (XBI), but opposite.
Instead of an up-thrust two-years in the making, we may have a spring set-up, taking just as long if not longer.
Note: Posts on this site are for education purposes only. They provide one firm’s insight on the markets. Not investment advice. See additional disclaimer here.
Before we get to the ‘independent source’, a quick review of the June 21st, update (emphasis added):
“With the prior update letting us know the air is going out of support for continued A.I., today’s action may be a significant reversal (not advice, not a recommendation).”
That was based on a wide gamut of data with none of it, ‘fundamentals’, except ‘the money’s gone’; the conclusion, NVDA, may be at a significant inflection point (not advice, not a recommendation).
All of that, on this site, right here in River City. 🙂
Independant Source
Now, we have this from Ed Dowd, link here (time stamp: 5:45, 8:30, and 9:40) saying NVDA, had an ‘exhaustion top’, posting on two timeframes.
Note: Wyckoff analysis, with its century-old technique, is coming to the same conclusions as the Wall Street ‘number crunchers’ with near-infinite computing power.
Now, on to the chart.
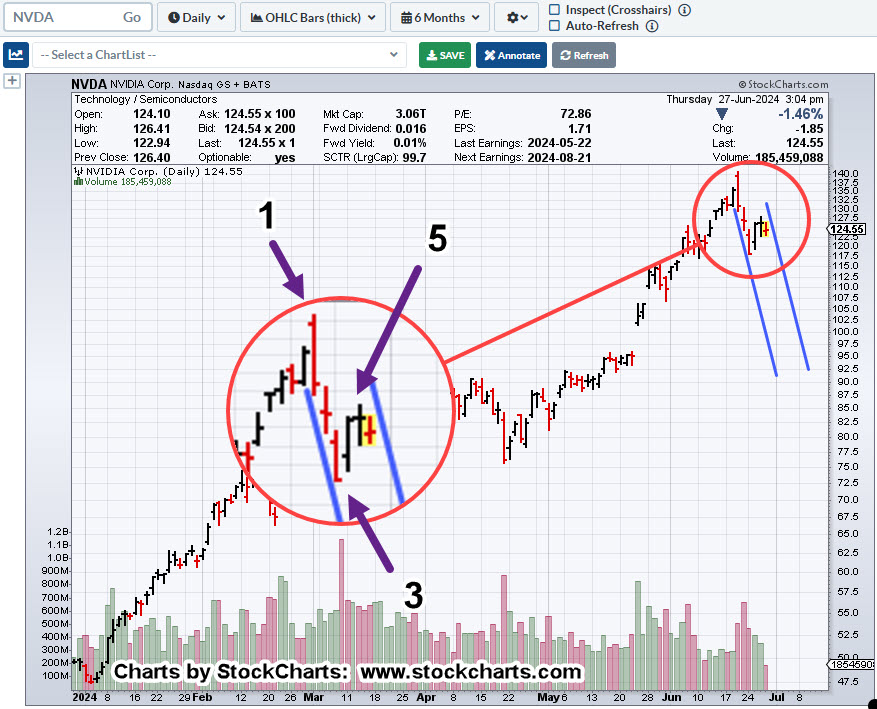
Nvidia NVDA, Daily
The trading channel (blue lines) is potential only, not confirmed.
What we do have, is once again, NVDA being influenced by Fibonacci time-correlation(s).
Nvidia reversed on Fibonacci Week 89, from the October 14th, 2022, lows.
Note: Posts on this site are for education purposes only. They provide one firm’s insight on the markets. Not investment advice. See additional disclaimer here.
From the outset, the premise for biotech XBI, was this:
We’re in a huge up-thrust, several years in the making (not advice, not a recommendation).
With a set-up that big, downside potential was projected to be just as big, link here.
Then came the hard part, validating the premise and getting into position.
Nural Plasticity
So, it’s been on again, off again; a total of seven short trades; LABD-24-06 – LABD-24-12, with an eighth, LABD-24-13 opened, as of today.
The entire (closed) series has been profitable.
However, during that time, assessment of (major) downside potential shifted from confidence to caution, and now back to confidence.
‘Sticking to one’s guns’, no matter what the market (the tape) is saying, is a sign of real trouble.
The market itself directed the entering/exiting.
With that, let’s move on.
The ‘New’ Paradigm
Reviewing the host of ‘experts’ in the press and YouTube alike, (except for UE), everybody has their reason on why nothing (bad) will happen until after the ‘election’.
The last go-round should have broken that paradigm completely; but no, we’re still hanging on.
The ‘new’ paradigm is probably, ‘no’ paradigm. 🙂
From a Wyckoff perspective, the financial press is to be ignored except for when data releases are scheduled.
What’s in the release is not important; it’s the time and date itself, warning of potential volatility.
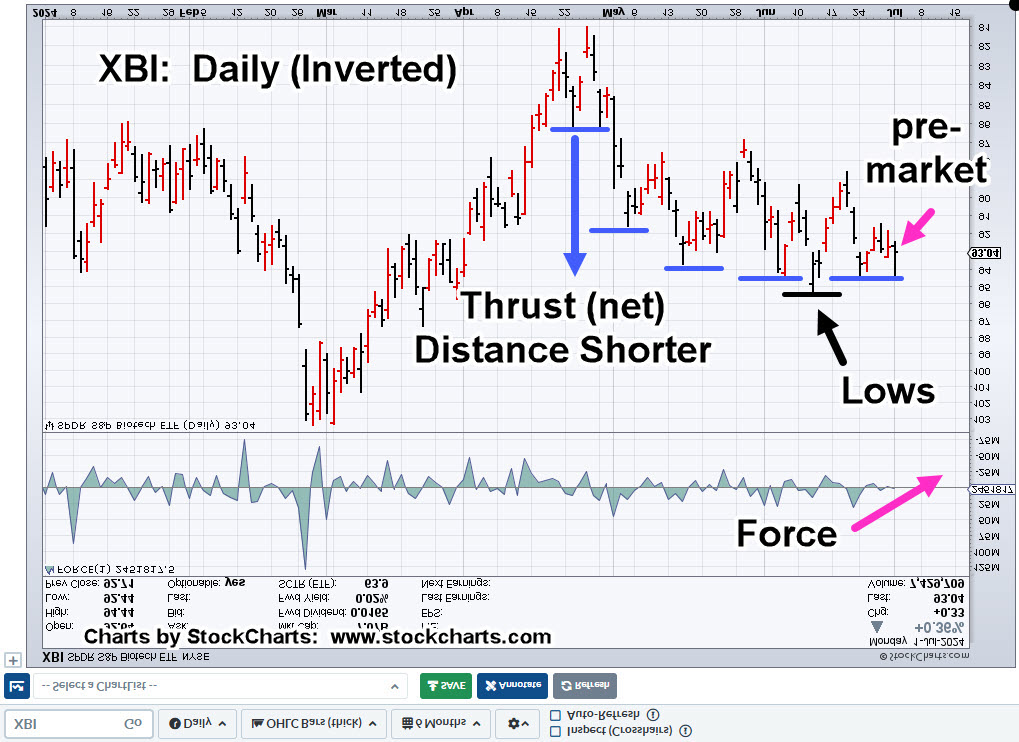
Biotech XBI, Daily (inverted)
Once again, inverting the chart to show the short-side (LABD) potential (not advice, not a recommendation).
Note: The dashed blue lines, an extension of the support level shows we’re also in a potential spring set-up at one higher timeframe, the weekly; more background, link here.
Positioning
As noted above, a new short position was opened via LABD, during this session (not advice, not a recommendation).
Typically, discussion of open trades within the trading community is (or should be) taboo. As Elder said years ago, there’s the real risk of ‘ego’ causing errors in discernment.
With that said, I might exit this trade at any time, without notice, without explanation.
Veteran traders will agree with that statement; when something’s ‘off’ with a trade (only known to them), it’s time to get out.
Nonetheless, a hard stop for today’s position would be yesterday’s LABD, low of 6.97 (not advice, not a recommendation).
Note: Posts on this site are for education purposes only. They provide one firm’s insight on the markets. Not investment advice. See additional disclaimer here.
Note: Posts on this site are for education purposes only. They provide one firm’s insight on the markets. Not investment advice. See additional disclaimer here.
Note: Posts on this site are for education purposes only. They provide one firm’s insight on the markets. Not investment advice. See additional disclaimer here.
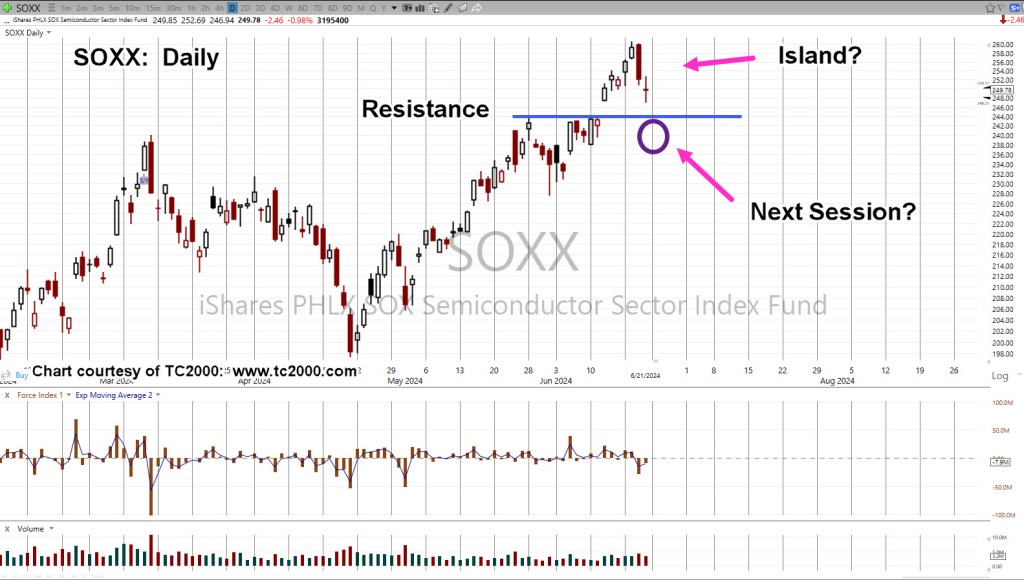
This update will show why there’s a probability for lower open, lower price action, and/or ‘island-gap-reversal’, for the SOXX, at the next session.
With the understanding that ‘anything can happen’, let’s get into the SOXX price action, along with chief cook and bottle washer, Nvidia.
Market Reversal?
First off, does anyone expect a significant reversal?
Following the breadcrumbs, here’s a link from the comments section posted during a livestream by Uneducated Economist; go to Time Stamp 23:45.
Note: The second link is not from Simon (Uneducated Economist) himself but obtained from snide remarks made to him during his livestream.
Using the timestamp, judge for yourself.
My takeaway is:
They don’t know. The amount of time wasted ‘crunching the numbers’ is mind numbing. Number crunching is easy and that’s why (nearly) everyone does it.
Reading price action (effectively) is hard and that’s why you’re here. 🙂
Semiconductors SOXX, Daily Candle
The chart highlights the ‘island-gap’ potential.
However, the real story is in the second chart, Nvidia.
Remember that markets tend to alternate. Last time, is not this time.
The last time Nvidia had a significant outside-down, it went into consolidation before moving higher.
Nvidia NVDA, Daily Candle
Looking at the chart, ‘this time’, is already different.
From the 10:1 split, to outside-down, is Fibonacci 8-Days.
Last time there was a wide outside-down (March 8th), the next day was narrow range, volume decreasing,
This time, we have narrow range, volume increasing.
The Higher Probability
Taking it all into account, the higher probability is for continued downside. It’s a probability, not a guarantee.
If we get upside at the next session, then it’s time to stand aside, re-sharpen the pencil and start looking for another reversal potential (not advice, not a recommendation).
Note: Posts on this site are for education purposes only. They provide one firm’s insight on the markets. Not investment advice. See additional disclaimer here.
It’s not hyperbolic to say, what’s happening to Nvidia right now, has never happened before.
As we’ll see on the chart, the market itself proves that point.
Work has already been done (here, here, here and here) on why Nvidia, may be at a significant inflection point (not advice, not a recommendation).
Now the smoke has cleared from Friday’s session, we can look at what happened and what’s likely to happen.
First, we’ll use a Fibonacci 8-Day, chart.
Why? Because nobody else uses one. 🙂
Besides being a Fibonacci number (just like the Weekly, at 5-Day), the 8-Day, seems to show the potential better (at this point) than other timeframes.
Nvidia NVDA, 8-Day
Let’s go all the way back to the beginning and why the current situation is unique.
NVDA, started trading the week of January 22nd, 1999.
During that span, there are no two Force Indicator occurrences (shown below) at this level of energy.
In fact, there are no Force Index prints at this level, ever.
The only print that comes close is also shown on the chart, occurring in late May, of ’23.
An astute observer can instantly see the trouble or potential trouble.
During the consolidation period from mid-March to late April, Force Index declined and eventually posted negative.
That temporary wash-out provided fuel for more upside.
Now, price is rising with force declining, at the same time.
The inference, the rally is weak if not extremely weak.
Let’s not forget, the ‘old-timers’ say it’s the biggest bubble they’ve ever seen.
Couple that with NVDA, having already launched from bottom to top, 1999 – to- Latest Highs, a massive 469,000%.
Time permitting, in the next update, we’ll look at the potential for an ‘Island Gap Reversal’, in the SOXX.
Note: Posts on this site are for education purposes only. They provide one firm’s insight on the markets. Not investment advice. See additional disclaimer here.