No One Expects The ‘Spanish Inquisition‘

No one expects the Spanish Inquisition like no one expects a collapse in silver.
From a contrarian standpoint, just because it’s not expected does not in itself, mean it’s going to happen.
However, this site’s been building a strategic premise for years, food supplies come first then precious metals (not advice, not a recommendation).
Here are links that span over two-years; successively building on the case, we’re (potentially) in a ‘Genesis 41‘ situation first more than a Wimar Republic event.
“Ten percent of the U.S corn crop was instantly wiped out last week during what’s described as an inland hurricane.”
‘Stacking’ … Strategic Error ?
“As we continue on, it’s becoming clear that single-mindedly stockpiling inedible metal in hopes of surviving what’s here now, and what’s coming, is a major (if not potentially fatal) blunder”.
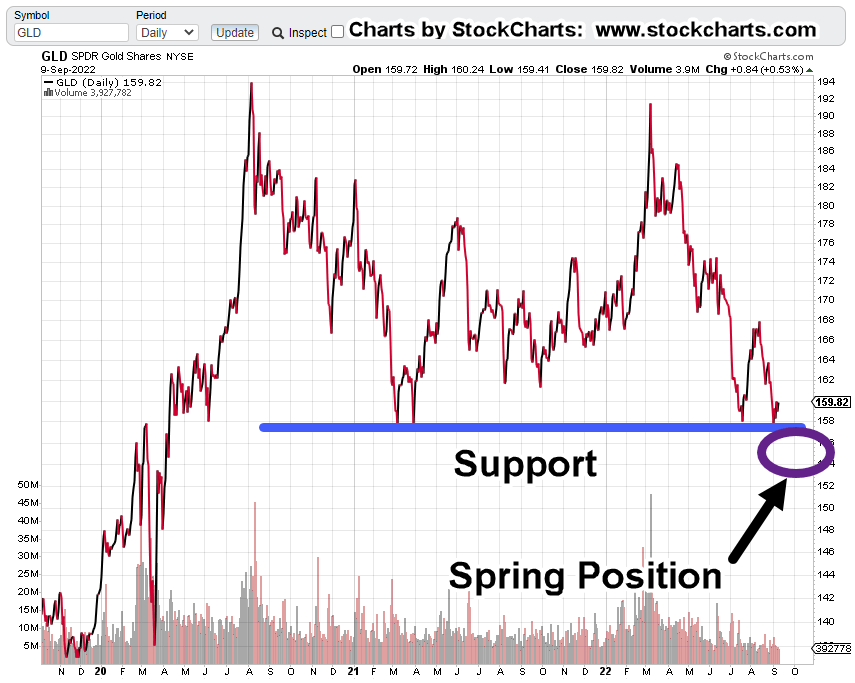
“Gold has never been the same since the Derecho of 2020.
In fact, that was the pivot point for both gold and corn which are now, inversely correlated.”
“The food supply is, and is going to be destroyed; one way or another.”
… And This, Just Out
As if to drive that last bullet item home, we have:
Turkey Shortage This Fall? | “Bird Flu”
The ‘Right Side’ of The Trade
Being on the right side of the trade means by definition (nearly) everyone else, is on the wrong side.
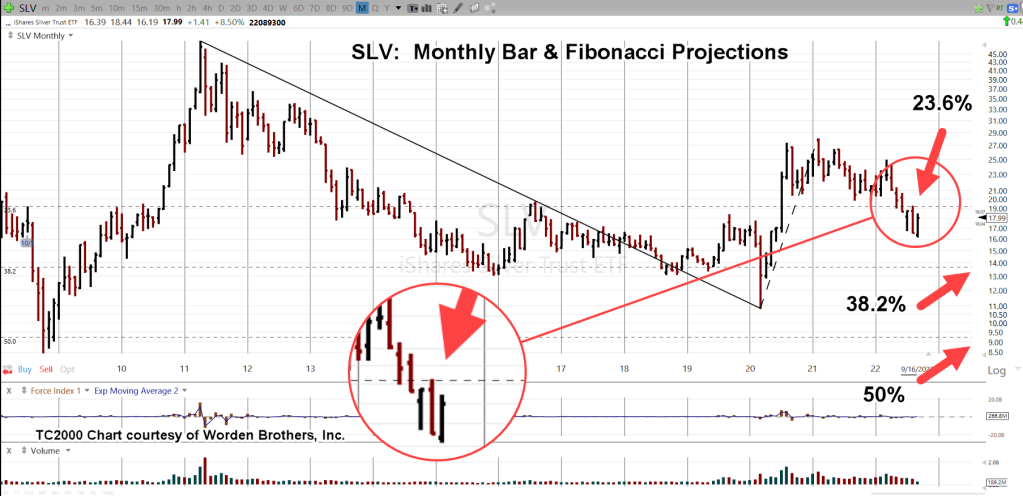
The last report said that both silver and gold are at The Danger Point®; The location where risk is least for positioning either long or short (not advice not a recommendation).
Based on prior analysis, the expectation is for a continued decline in the precious metals.
Silver Trading ‘Vehicles’
There are many ways to work the silver market.
Several trading vehicles are silver futures (mini futures), silver ETFs, options on ETFs, leveraged bull and bear ETFs and lastly, the physical metal itself.
As of this date (9/18/22), quotes for a typical bag of ‘junk silver’ are below:
$100 Face Value Bag: $2,006.44
$100 Face Value Bag: $2,064.92
$100 Face Value Bag: “Out of stock”
This is not an endorsement. The purpose here is to have ‘place-holder’ quote(s) going forward.
Summary
The post is already lengthy.
Next up on the ‘Silver Collapse’, we’ll discuss the other trading vehicles; futures, options, ETFs and leveraged ETFs.
Stay Tuned
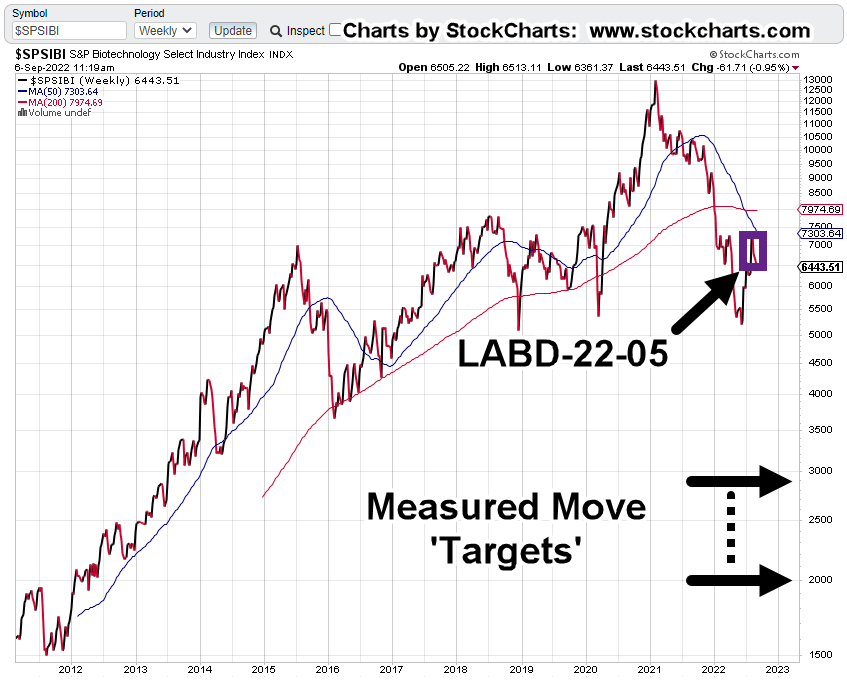
Charts by StockCharts
Note: Posts on this site are for education purposes only. They provide one firm’s insight on the markets. Not investment advice. See additional disclaimer here.
The Danger Point®, trade mark: No. 6,505,279