Note: Posts on this site are for education purposes only. They provide one firm’s insight on the markets. Not investment advice. See additional disclaimer here.
Note: Posts on this site are for education purposes only. They provide one firm’s insight on the markets. Not investment advice. See additional disclaimer here.
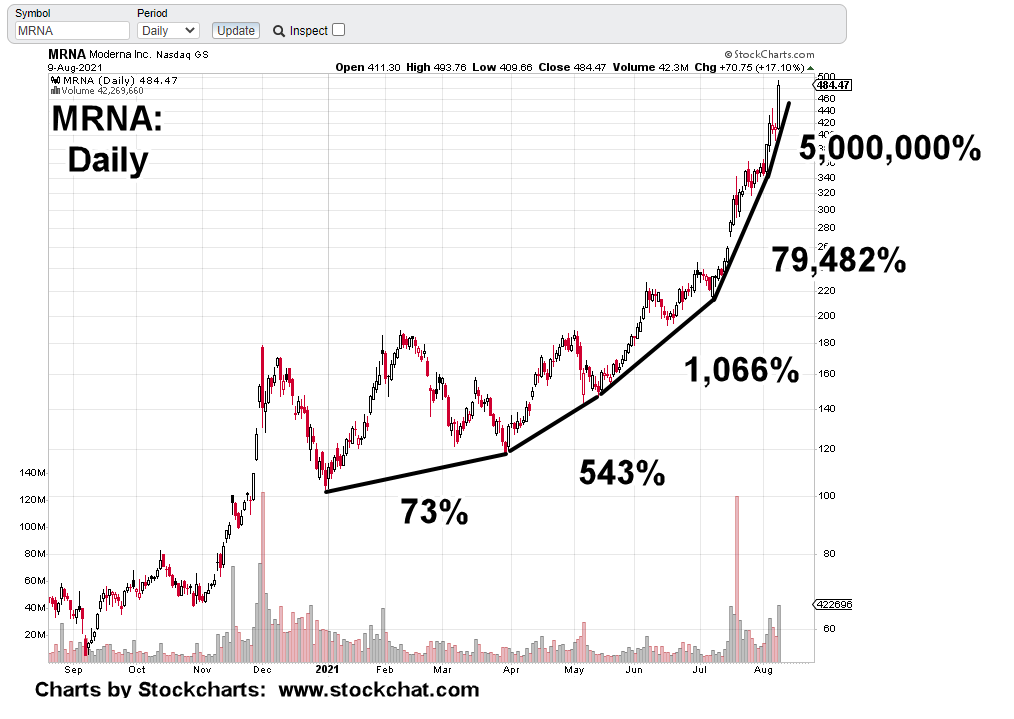
Our ‘parabolic’ report on MRNA, was posted before the open, August 10th.
That post included the following summary:
‘This is the type of parabolic rise (and blow-off top) typically seen in commodities.’
Then, about seven minutes after the open, MRNA peaked and reversed into a two-day collapse over -25%.
Down-thrust energy, the amount of downward force in price action, was literally off the chart; the strongest ever recorded since MRNA, started trading in December of 2018.
Price action leads the news. This case was no exception.
This report, just out on ZeroHedge shows there’s a half-hearted attempt to draw attention to a so-called ‘rare’ side effect.
Even so, the insiders probably figure the jig is up and they’re bailing out.
The biotech sector (SPBIO) continues its bear market decline. Yesterday, it closed down over -32%, from its February 2021, highs.
Note: Posts on this site are for education purposes only. They provide one firm’s insight on the markets. Not investment advice. See additional disclaimer here.
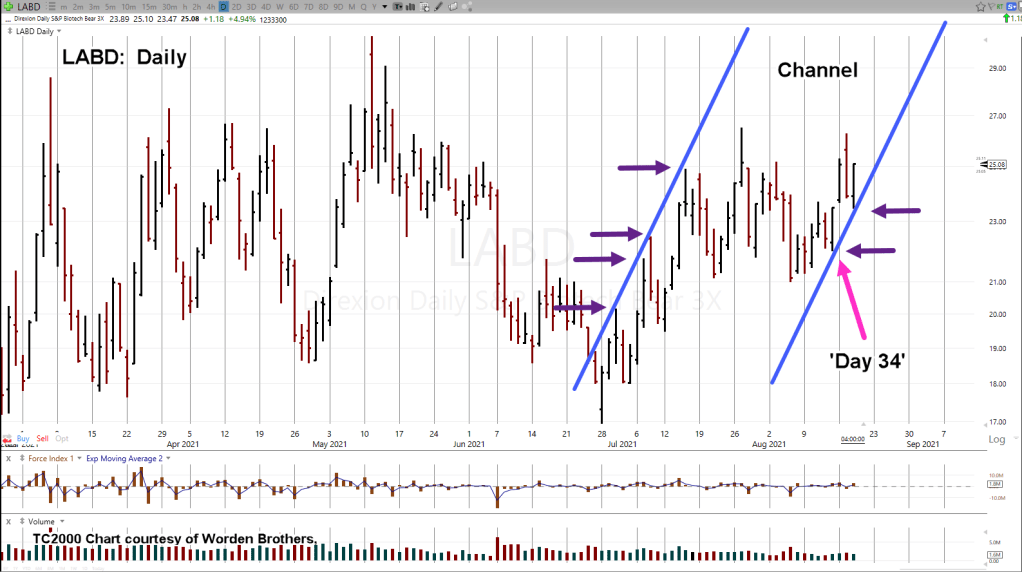
For months, the biotech SPBIO and its leveraged inverse fund LABD have shown a repeating trendline characteristic.
This time around, the two right-side trend contact points (shown above) are LABD’s (Day 34) outside up reversal and today’s Fed minutes release, reversal.
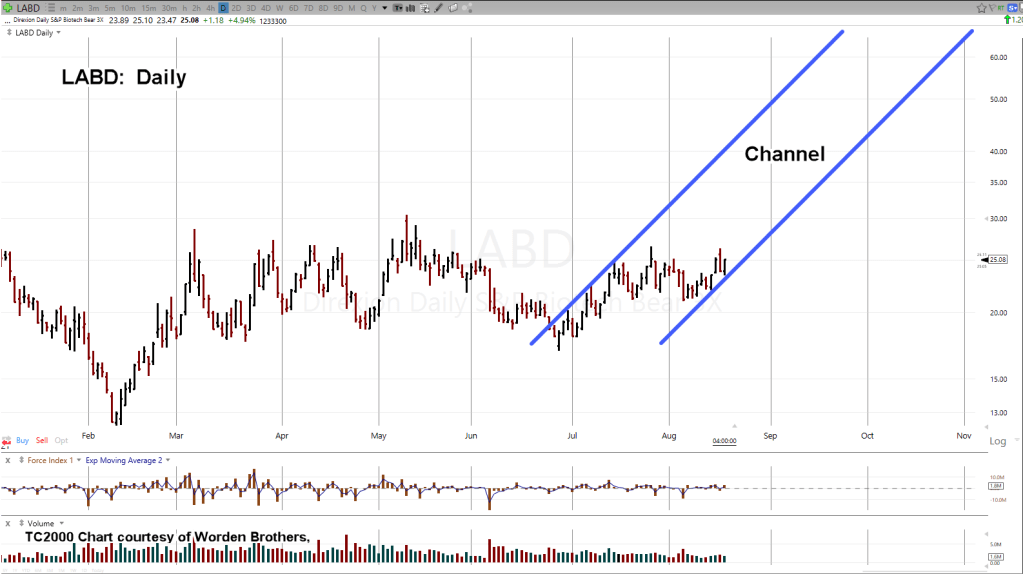
The chart below is a compressed version of LABD. It gives a better perspective on the gain potential.
Looking at the chart it’s clear why so much focus has been placed on strategically shorting biotech (not advice, not a recommendation).
If there’s a decisive SPBIO break lower, the gain potential for inverse LABD is significant.
Time frame for exit (not advice, not a recommendation) unless price action dictates otherwise, is still planned for mid-October.
Stay Tuned
Note: Posts on this site are for education purposes only. They provide one firm’s insight on the markets. Not investment advice. See additional disclaimer here.
If the mainstream media is good for anything, it’s the ability to keep the herd, the retail, (Robinhood kids, et al.) fully distracted until it’s absolutely too late for action.
Even though this report from ZeroHedge gives all kinds of ‘signals’ saying we’re not there yet; It even goes as far as showing there’s no yield curve inversion. Of course that means ‘no risk’ of bear market.
Then going on to say, ‘None of these measures indicate a bear market is near’. I mean, you can’t make this stuff up.
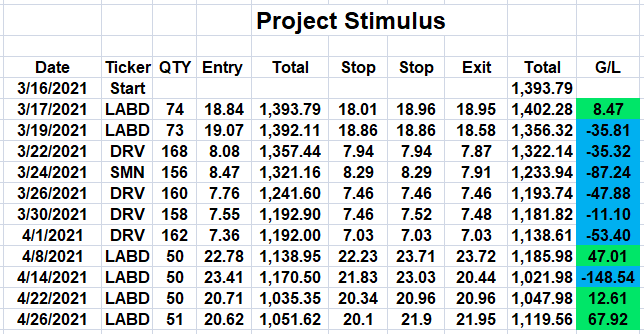
What’s the table above (yesterday’s close) say about what’s really going on?
At this point it’s obvious the media are not going to discuss the on-going bear market in biotech, SPBIO.
Doing so, would require some kind of investigation as to why? That would open Pandora’s box and have everyone digging for truth … something to be avoided (censured) at all costs.
Amateurs always want (need) to know why.
Livermore was never concerned with the why. He looked for ‘what’. What is the price action doing now or what is it likely to do.
As Wyckoff said, ‘the why always comes out later … after the fact’
‘Why’ is a useless trading strategy.
However, in the case of biotech, we can take a good guess what the ‘why’ is all about.
Fall and Winter are very close now. As this interview with Stew Peters reveals, Fall and Winter are when we get the real picture of ‘side effects’.
Biotech is ahead of the pack on the downside and for good reason.
Positioning:
Positions have not changed except for additions of LABD as SPBIO declines and LABD heads higher (not advice, not a recommendation).
As a reminder, this site’s not interested in day trading or even swing trading unless that’s all the market offers.
No, we’re interested in positioning strategically.
This type of trading is modeled after the host’s twenty-four years of experience with aircraft flight test and certification.
A typical project would take five to seven years to complete; have a near infinite number of complex stages along the way with each one a profession unto itself.
At this juncture, biotech may be poised for the largest implosion ever seen in market history.
Stay Tuned
Note: Posts on this site are for education purposes only. They provide one firm’s insight on the markets. Not investment advice. See additional disclaimer here.
I’ve never seen such an on-going event result in so many people using Biblical standards to ether describe the battle, or to say this could be it. We need to keep our lampstands ready.
Note: Posts on this site are for education purposes only. They provide one firm’s insight on the markets. Not investment advice. See additional disclaimer here.
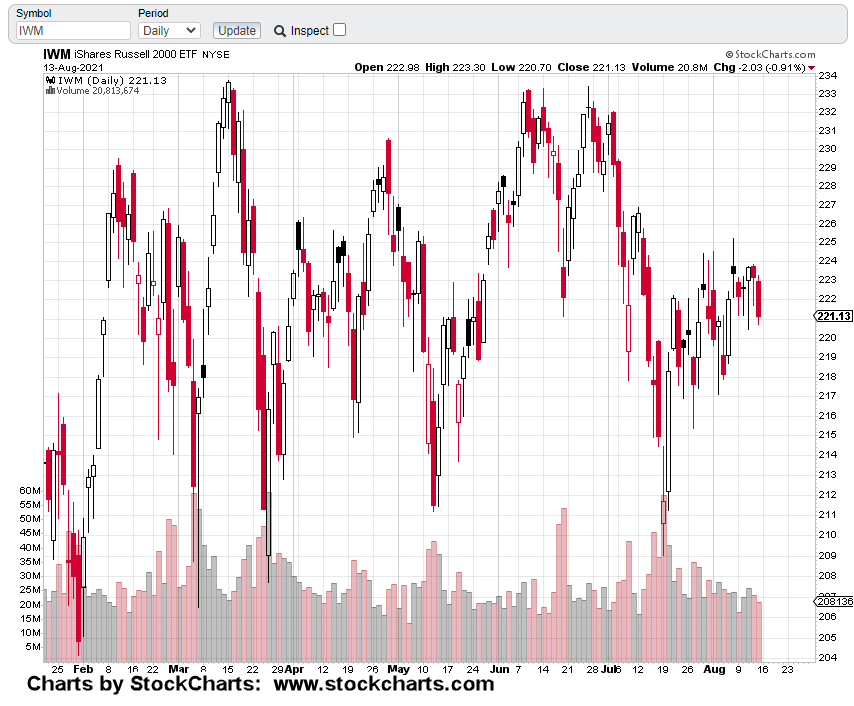
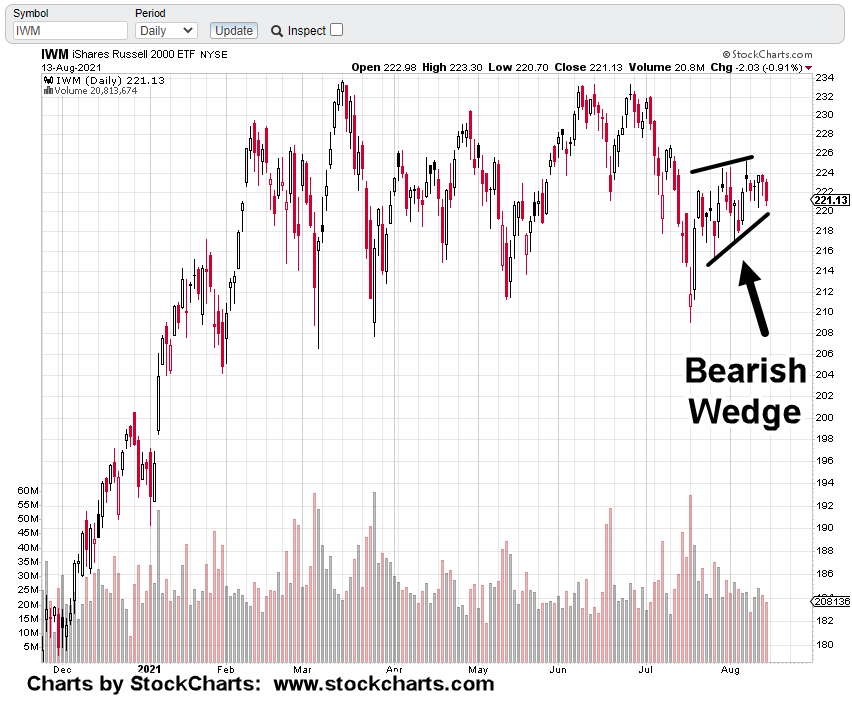
The Russell 2000 (IWM as proxy) has been congesting sideways for about five months.
While the overall markets, S&P, Dow, SOXX, IYR and the QQQs, have been moving on to new highs … the Russell has stagnated.
Taking a cue from Steven Van Metre’s reports on ‘who goes first’ in a downturn, it’s the small caps.
At this juncture, it looks like the Russell’s ready.
The six month daily chart of IWM below, shows choppy action.
Pulling back somewhat and labeling the bearish wedge, puts it into perspective (second chart):
Pulling out and labeling the wedge:
One item of note (not shown) at the top of the wedge, where price action pivoted lower (August 6th), is a Fibonacci 62%, retrace level.
So, we have a bearish wedge retracing 62% … along with non-confirmation of the overall highs; S&P, Dow, SOXX, etc.
Major reversals take a long time to form. However, once they get underway, it’s like a juggernaut to the bottom.
Harkening back to the oil (USO) bear market of 2014, nearly all (if not all) the YouTuber’s at the time, completely missed the bearish set-up.
What they did instead, once the downdraft started, was pump out update after update about ‘catching the bottom and setting up for the new bull market in oil’.
It never happened.
Oil continued lower for a year and a half before getting into a sideways range.
The big money’s in the big move. Monitoring the Russell provides confirmation a significant reversal’s in the works (not advice, not a recommendation).
As with biotech (SPBIO), already in a bear market, the IWM could break lower while the overall markets continue to thin-out and even make new highs.
Recall, we’re getting close to an up-coming holiday: Labor Day
The 1929, high was on the Tuesday just after Labor Day weekend.
Note: Posts on this site are for education purposes only. They provide one firm’s insight on the markets. Not investment advice. See additional disclaimer here.
Biotech SPBIO and Inverse LABD In Fibonacci Sequence
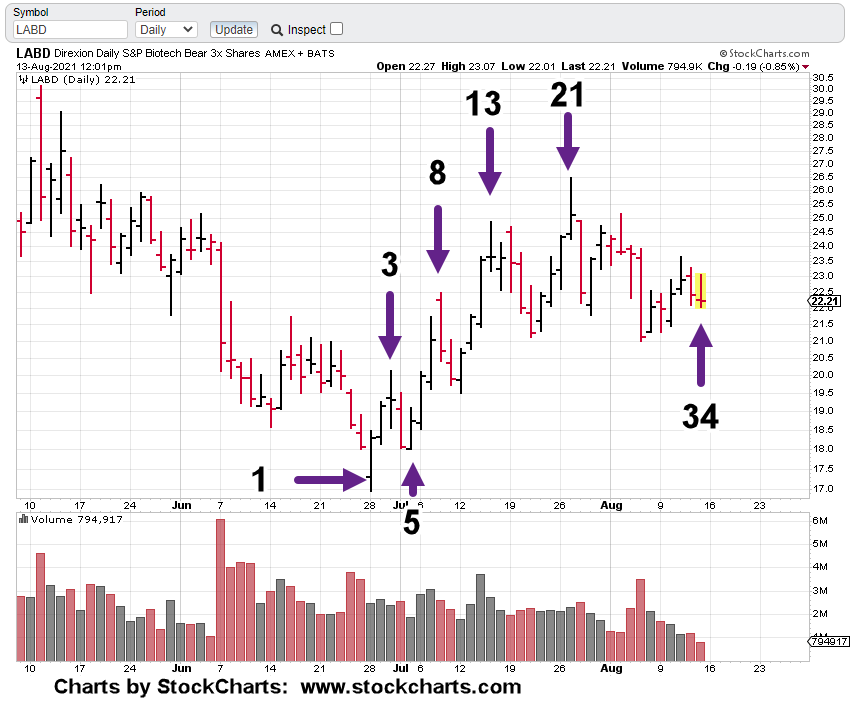
Today is Fibonacci Day, 34
Like a metronome ticking away, keeping time, so too has the SPBIO index and inverse fund LABD.
From a personal anecdote situation, I’ve never seen an index hit every Fibonacci Day with an inflection point … all the way up to today: 34 Days.
To get to the analysis, we’ll start first with an unmarked daily chart of inverse fund LABD, below:
Pivots from the June 28th, low are in Fibonacci sequence:
If today is a reversal or subsequent pivot … verified by next week’s price action, LABD’s exhibiting an incredible adherence to Fibonacci time.
This can only happen if nobody’s watching.
As soon as traders/speculators catch on that something’s afoot, the sequence diffuses into chaos; that may or may not come back to order at a later date.
Note: Posts on this site are for education purposes only. They provide one firm’s insight on the markets. Not investment advice. See additional disclaimer here.
Looking over the updates of the past few weeks, you can see how the LABD channel (above) was formed.
The trend has repeated with successive moves higher and the right side channel line moved as a result of price action.
At this point, we may be there.
If LABD closes the day at its current location or higher, it’s a good sign of channel confirmation.
In addition, we have Moderna (MRNA) in the process of penetrating the trendline shown in yesterday’s update. If price action continues lower (as it’s doing in the early session), it could be on track to post a weekly reversal.
Separately, the IBB (ETF) index is already posting a weekly reversal. From a momentum standpoint, the new weekly high of IBB, has put that index in a potential bearish (MACD) divergence provided it closes lower from here for the week.
Positioning:
The bearish case has been building even back to David Stockman’s assessment of ‘2-Trillion Dollars of Bottled Air’, during the summer of 2015.
However, Stockman does not trade. So, to figure out if ‘this is it’, is not in his repertoire.
With current events as they are, one can intuitively conclude the fundamentals have not improved for the sector.
The backdrop is there for significant downside.
With that in mind my firm remains positioned max short (not advice, not a recommendation).
Any selling in LABD that’s occurred over the past month or so, was to adjust account(s) for maintenance (margin) requirements.
Once the index was finished with its adverse (SPBIO, higher, LABD lower) moves, we’re right back to establishing a full position.
This type of action has been going on for months.
It’s tedious and not exciting; exactly the opposite of what a typical YouTube viewer is looking for.
As a corollary, there’s no artificial (and profit limiting) requirement to show ‘Monthly’, Quarterly’ or whatever gains, to retail customers.
The financial press takes care of the retail side.
Some (very few) actually escape; finding themselves on sites like Van Metre’s, Weis’, and this one.
Stay Tuned
Note: Posts on this site are for education purposes only. They provide one firm’s insight on the markets. Not investment advice. See additional disclaimer here.
Note: Posts on this site are for education purposes only. They provide one firm’s insight on the markets. Not investment advice. See additional disclaimer here.