Note: Posts on this site are for education purposes only. They provide one firm’s insight on the markets. Not investment advice. See additional disclaimer here.
Note: Posts on this site are for education purposes only. They provide one firm’s insight on the markets. Not investment advice. See additional disclaimer here.
The last update, presented a case for the SOXX top, a proxy for A.I.
Note: If the SOXX, has made its final high, it’s still very early in the reversal:
Wyckoff said a century ago, ‘It’s as if the weight of a feather can move the market in either direction’.
That’s where we are now.
For biotech (IBB, XBI), different forces are at work.
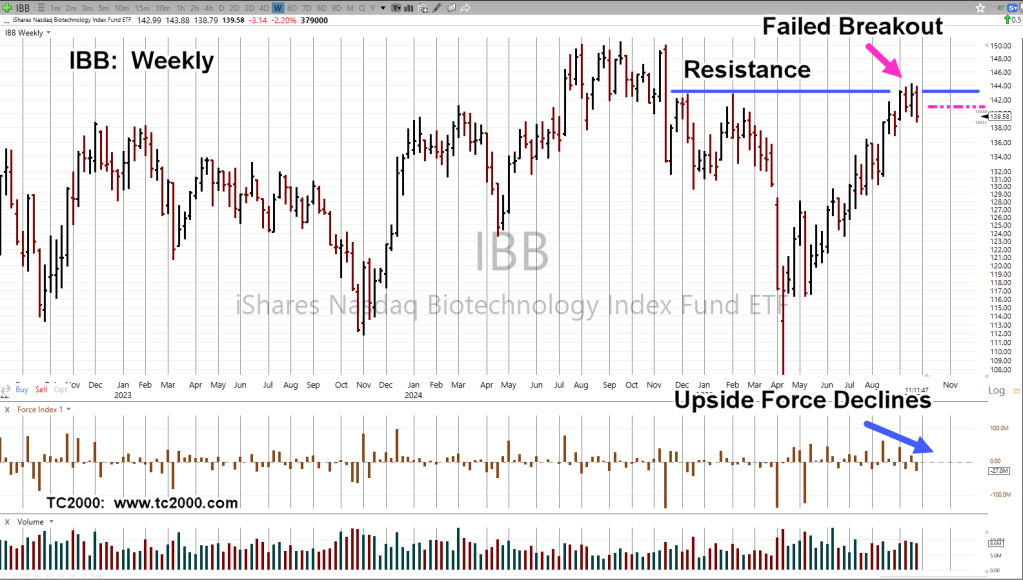
Biotech IBB, Weekly
The 38.2%, retrace from 9/19 high, to 9/25 low, is in the vicinity of 140.90 (magenta dashed line).
Fridays are typically biased to the upside.
There’s a possibility IBB, may test (upward) throughout the session, heading to (at or near) 38%, by the end of the day (not advice, not a recommendation).
Note: Posts on this site are for education purposes only. They provide one firm’s insight on the markets. Not investment advice. See additional disclaimer here.
Note: Posts on this site are for education purposes only. They provide one firm’s insight on the markets. Not investment advice. See additional disclaimer here.
Was that the day where irrefutable evidence like this is going to stick?
Price action of Biotech Sector IBB, has posted a long awaited and anticipated reversal signal (not advice, not a recommendation).
We’ll look at that below.
The IBB, Up-Thrust & Reversal
As a reminder, in Wyckoff terms, an ‘up-thrust’ is where price action struggles above known resistance for some period of time and then reverses to the downside.
In the case of IBB, that ‘struggle’ lasted an incredible seven-weeks.
Biotech IBB, Weekly
Price action attempted to break above resistance for nearly two-months, before reversing lower.
Then we had an initial test during the week of 12/23/22 (on the daily for three days), and a secondary test last week.
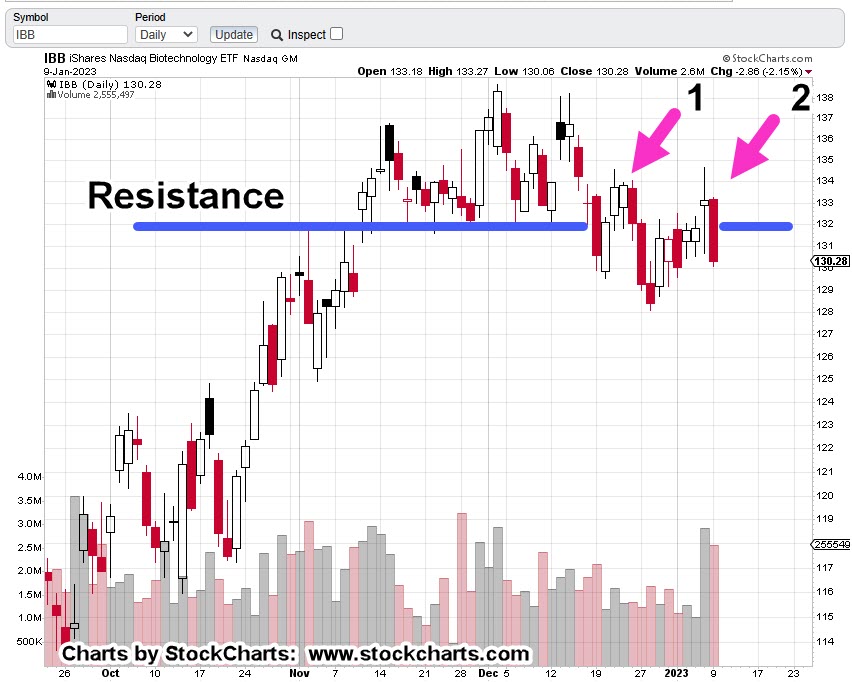
Biotech IBB, Daily
The daily shows more detail on the struggle.
Point No. 1, was the initial test. Point No. 2, was the secondary test which appears to have decisively failed.
Pre-market action shows IBB, set to open slightly lower.
If it does, then expectation is for some (brief) attempt to rally as a test of the breakdown.
The Driving Force
For years, this site has not wavered in the assessment, what’s happening in this sector, will be the driving force for the entire market on a go-forward basis (not advice, not a recommendation).
Anything can happen.
It’s unknown if yesterday was ‘the day’.
What is known however, evidence is building on a massive scale. Every day, sometimes multiple times a day, we see the effects.
Positioning
This site presents the data, the insight and price action nuances. It does not give recommendations.
With that said, going short this sector is not as straightforward as the other major indices.
IBB, may be shorted directly but will likely result in a maintenance fee from the broker.
Of course, that puts one on the hook for the sector’s dividend payment (currently yielding 0.31%).
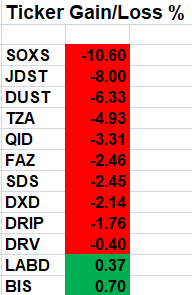
The other option is 2X leveraged inverse fund BIS.
However, this fund’s volume is thin … meaning it’s not nearly as liquid as the other inverse funds such as SDS, DXD, QID, SOXS and so on.
It’s up to the trader/speculator to participate or not.
We’re about fifteen-minutes before the open. Let’s see what happens next.
Note: Posts on this site are for education purposes only. They provide one firm’s insight on the markets. Not investment advice. See additional disclaimer here.
If we look at it from the perspective of an up-thrust test, as we’ll do below, such tests if they don’t fail are the precursor to dynamic moves.
At the minimum, today’s action allows the stop to be moved on short position LABD-22-03 (not advice, not a recommendation).
It’s interesting, the biotech sector both IBB and SPBIO, with inverse funds BIS, and LABD, respectively are the only ones taking a major hit today.
Using a cue from Nicolas Darvas and his observations (as a dancer), the market will initially go opposite its main direction as if to get ready for the move; like a dancer crouching down before lifting the female partner.
That may or may not be the case now, as we’ll see below.
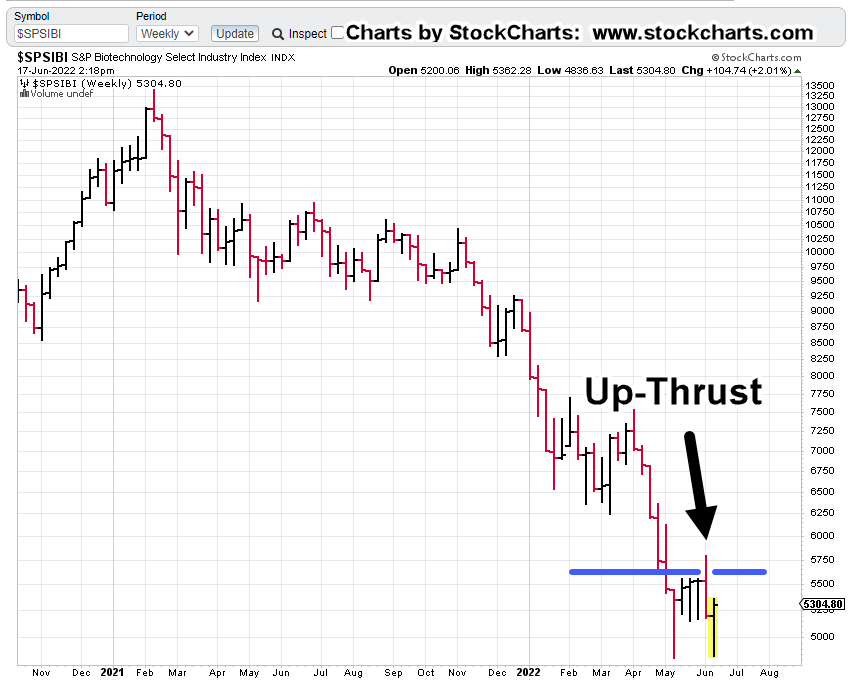
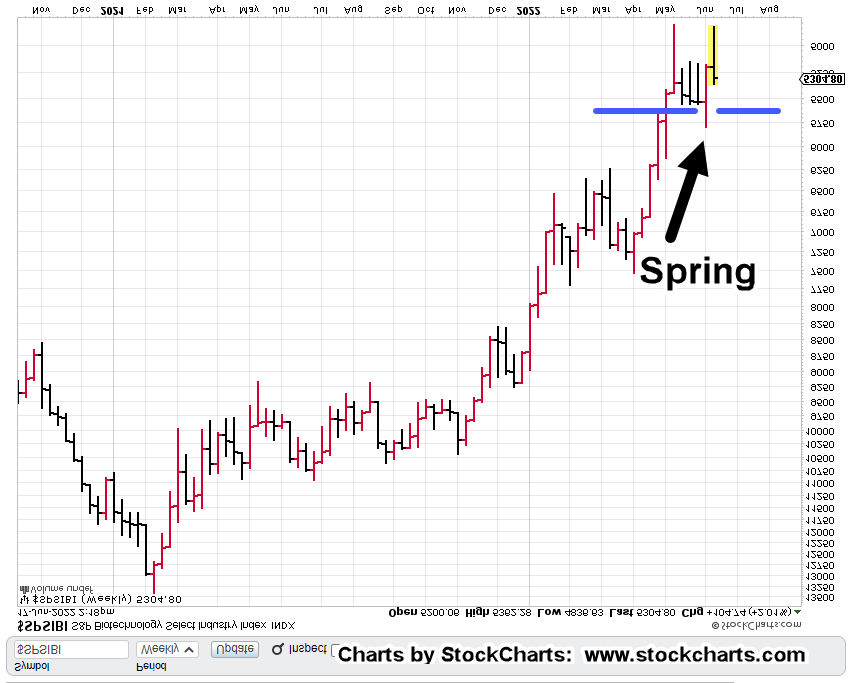
Biotech SPBIO, Weekly Chart
Next, we’re going to invert the chart (to mimic inverse LABD) and then label the up-thrust as a Wyckoff ‘Spring’.
Biotech SPBIO, Weekly Inverted
Next, we get closer to the action as shown.
Is the ??? area, a test or a failure of the set-up?
The short answer with about 90-minutes to go before the close, is unknown.
If SPBIO, closes down for the week, painting a red bar, probabilities are to the downside.
Closing higher for the week starts to bring a potential failure of the trade into question.
Summary
No matter what happens, the stop on the short position via LABD is going to be moved to the low of this session; currently LABD 49.90 (not advice, not a recommendation).
We may get into speculation later, on why biotech seems to be the only index in a major squeeze, preparing for downside.
Some who monitor this site, and those ‘awake’, may already have a good idea as to the potential why.
Note: Posts on this site are for education purposes only. They provide one firm’s insight on the markets. Not investment advice. See additional disclaimer here.
As we speak, economic activity is shutting down … fast.
Amazon shipments cancelled, gas stations going dry, banks halt lending, real estate sales collapse.
Meanwhile, the market’s in a short-squeeze.
What happens next?
We’ll discuss real estate and biotech farther down but first the data sources.
Dan from i-Allegedly reports here, he still has a couple of rubes (my word) that think the market just bottomed out.
Good luck with that.
As we’ll show below, the real estate bear market (IYR) rebound, was identified ahead of time.
Next, we have Red Hurricane describing one semi-trailer load after another being cancelled. He hauls for Amazon.
Shipping activity’s contracting, seemingly, by the minute.
Lastly, this link where the D-word, ‘Depression’ is used within the first one-minute, twenty seconds.
Bottom-out in the stock market? Probably not.
So, let’s take a look at real estate IYR, and see where it might go next.
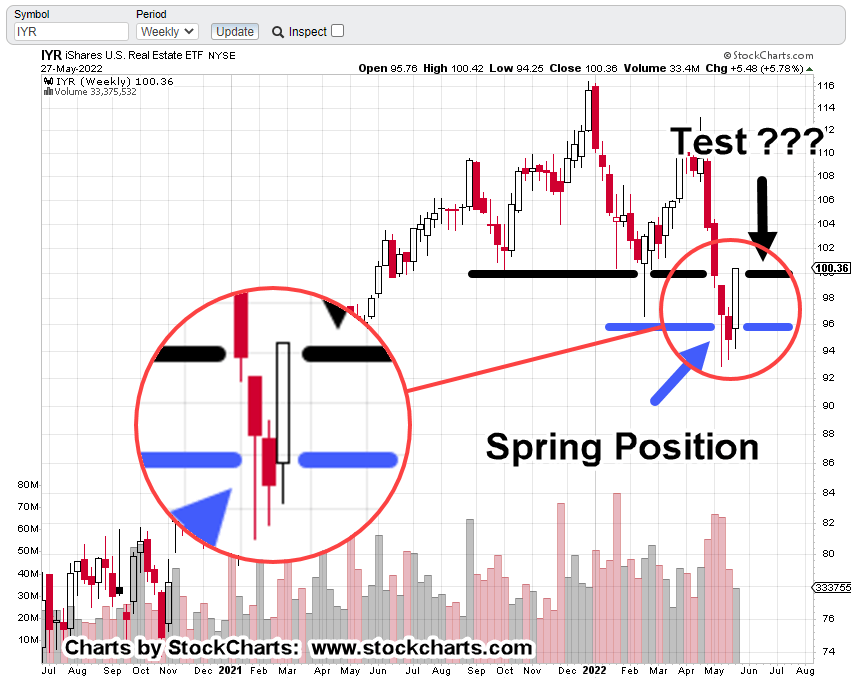
Real Estate IYR, Weekly Chart
The last update (link, here) showed potential to rise into a test of resistance. That’s exactly what happened.
Back then:
And now:
With zoom
Obviously, the upward test happened much quicker than anticipated … but it was anticipated … no surprise.
Real estate got itself into Wyckoff spring position; so, a rebound (test) is normal market behavior … short-squeeze or not.
If it was a squeeze and if it’s over, we can expect an immediate drop in price action. We’ll analyze that as it plays-out in the coming week.
Now, on to biotech, SPBIO
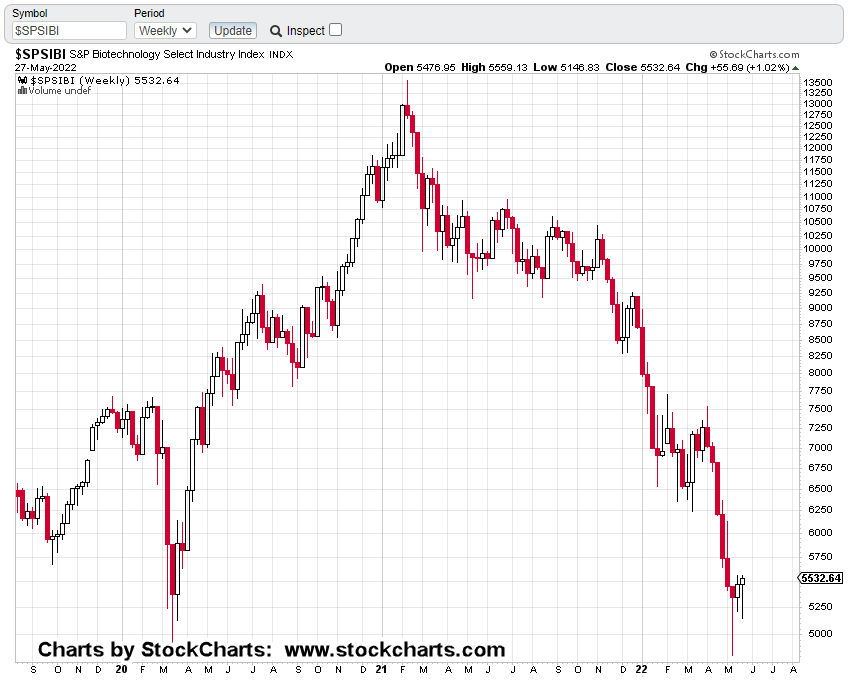
Biotech SPBIO ($SPSIBI), Weekly
Some housekeeping first.
Obviously last week, with being short, more downside action was anticipated resulting in upside for LABD.
On Friday, that did not happen. Biotech was part of the squeeze as well.
The short position via LABD, identified as LABD-22-02, was reduced but not exited completely (not advice, not a recommendation).
At present this is where we are.
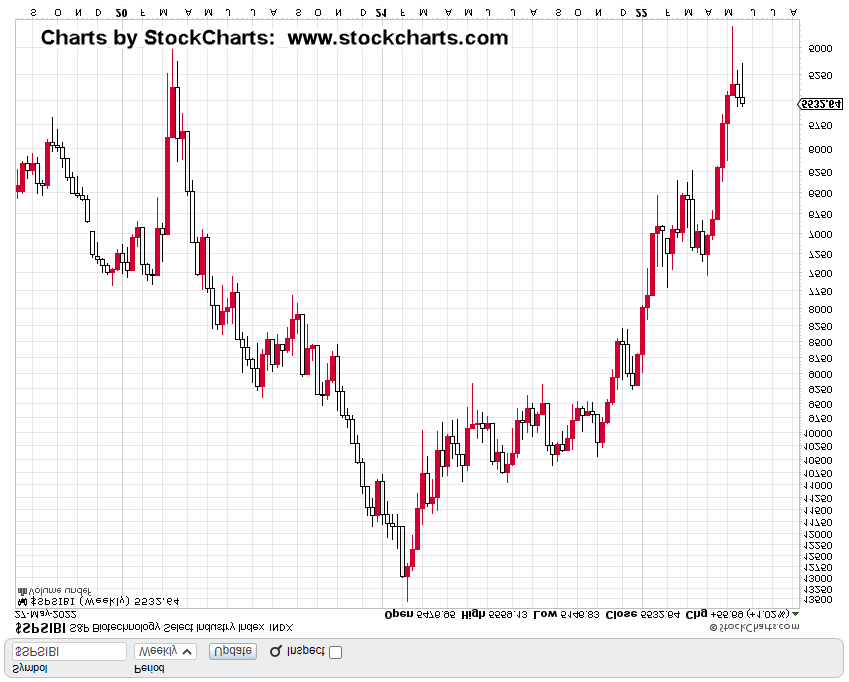
First, we’ll start by inverting the chart to mimic the action of 3X inverse, LABD.
Next, we’ll zoom-in and highlight the ‘squeeze’.
Doesn’t look like much when viewed that way does, it?
Next, we’re going to zoom-in, on the zoom
In spite of all the squeeze chaos on Friday, price action could not post a new weekly low (high on the non-inverted).
We’ll see this Tuesday, if that’s important or not.
This post is getting long but let’s end with the rule of alternation. The same chart is marked up below.
If this rule is still in-effect, we’re at a juncture where one can expect a ‘simple’ alternation.
We’ve already had complex action on the prior congestion; so, we can expect current action to be simple in character.
That means, price action’s not likely to stick around at these levels whether it’s going up or down.
Based on the above analysis, the expectation for Tuesday’s open is a gap lower for SPBIO and higher for LABD.
If that does not happen, something else is at work … we’ll report on that as necessary.
Summary
Has the market bottomed out? Not likely.
Those who are at this late stage, still arguing with Jerimiah Babe and Dan (and Patera), that the market’s rebounding, everything’s fine, are in a state of delusion.
The mindless herd following spending with ever newer cars, moving up to the McMansion, opulent vacations, posting it all on Facebook is most decidedly, gone.
It’s finished. It’s Done.
The problem is, as J.B. notes above (time stamp 7:15 and 8:30), those still living that life don’t seem to know it’s over.
For the leaders, the tiny minority and those reading this post, who are, or who have been preparing for years, it means potential huge (life changing) opportunities.
That is, as long as the markets, the banks and other infrastructure stay open; not guaranteed in any way.
Note: Posts on this site are for education purposes only. They provide one firm’s insight on the markets. Not investment advice. See additional disclaimer here.
Once this next level gives way, carnage will (likely) reach all-time records.
Over a centry ago, Wyckoff said in his writings, it’s those on the wrong side of the bull trade, who provide the fuel on the way down.
As reported by Reuters, that downside fuel appears to be building on a massive scale.
The Fed This … The Fed That
What a colossal waste of time … that is, trying to figure out what The Fed is, or is not, going to do.
As The Maverick reports in this update, The Fed has a higher authority. It should be no surprise to any of us at this point … they’re ‘just following orders’.
Part of the reason there’s so much focus on earnings, financials and The Fed, is that it’s a whole lot easier to do that, than actually getting down to work and learning price action.
That my friends, as Wyckoff said in his text Studies In Tape Reading, ‘takes many years and many losses’.
So, let’s take a look at what that ‘tape’ is telling us concerning the biotech market.
However as was done with real estate, changing from 2X inverse to 3X inverse, the same has happened with biotech; from BIS, to LABD.
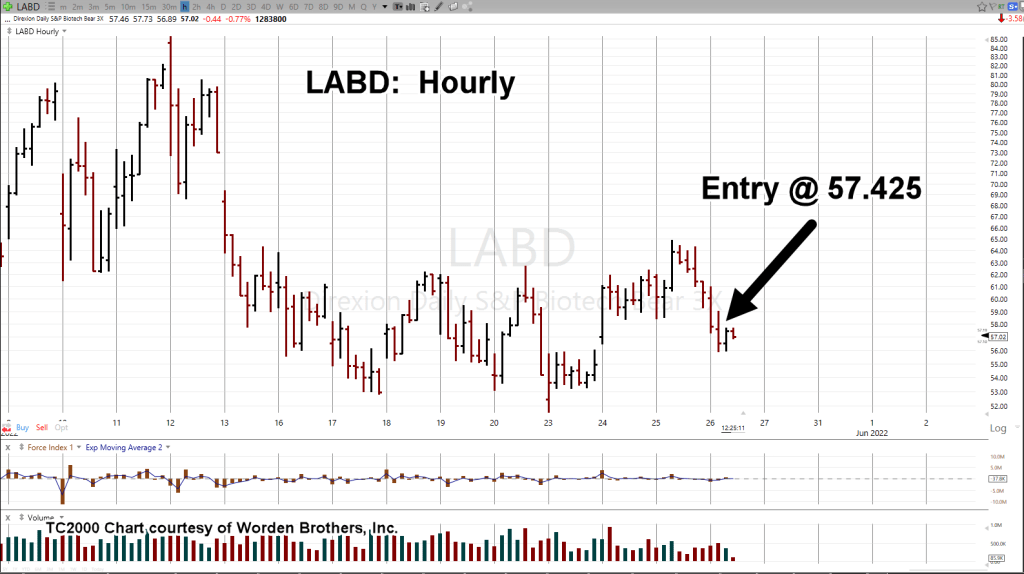
Since the overall bearish assessment has not changed, this morning’s upward move in the markets was used to re-position to a higher (inverse) leverage vehicle … LABD (not advice, not a recommendation).
The hourly charts below show the exit of BIS and the entry of LABD.
Biotech 2X Inverse, BIS
Biotech 3X Inverse, LABD
As this post is being written 12:55 p.m., EST, price action’s at the danger point.
We’re at the extreme; the risk is least but price can go either way.
Summary
Watching that action in real time, it looks like LABD wants to go higher; currently trading at 57.20-ish.
If LABD is higher, that means SPBIO, is moving lower.
Unless price action of biotech (IBB, SPBIO) and the overall markets signal a change of behavior … the bear move is still in play.
If we get a significant break lower, ‘retail’ that’s not positioned properly, will provide the majority of downward thrust energy.
It’s no different than it was in Wyckoff’s time, over a century ago.
Note: Posts on this site are for education purposes only. They provide one firm’s insight on the markets. Not investment advice. See additional disclaimer here.
It’s been a while since we’ve talked about the chief cook and bottle washer in this whole financial collapse scenario.
However, biotech has not been forgotten.
There are two indices (ETFs) being tracked: IBB and SPBIO.
Both entered bear market territory long ago. SPBIO topped out, way back in February 2021; IBB topped later, in August the same year.
Leveraged inverse funds are LABD, and BIS, respectively. LABD is 3X inverse with BIS a 2X inverse.
The Long Term
One thing unique to David Wies, was to look at the long term: Monthly, Quarterly and Yearly charts.
Doing so, puts one in a strategic mindset … not easily swayed by the latest prattle from media sources.
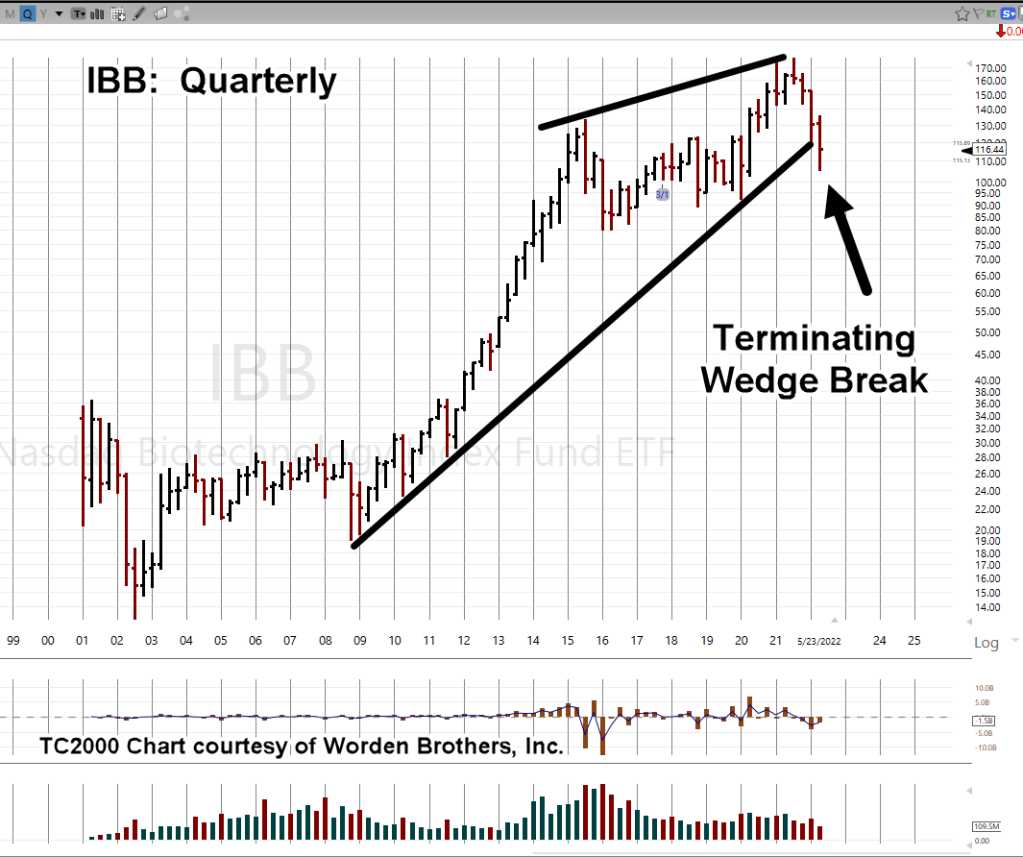
If we look at biotech, IBB, on a quarterly basis we have the following chart.
Biotech IBB, Quarterly
The mark-up of this chart is where it gets interesting.
A terminating wedge that’s been over seven years in the making has just broken to the downside.
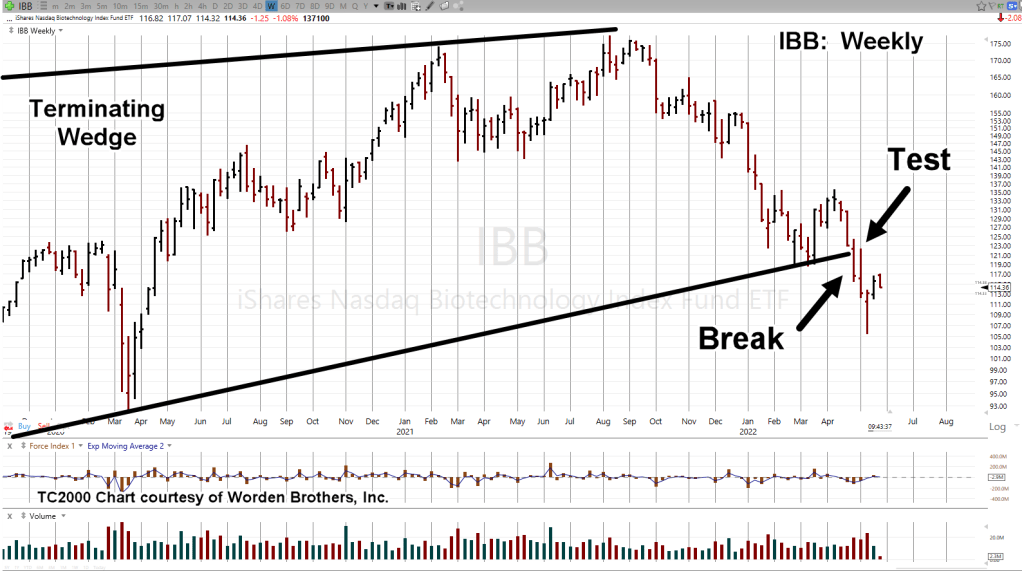
Not only that, when we get closer-in (on the weekly), we can see the wedge break has been tested and now today, appears to be reversing to the downside (shown on daily).
Biotech IBB, Weekly
With zoom
The daily shows a Fibonacci retrace to 38%; then today, a downside reversal.
You can see where this is going.
Based on the above analysis a short position in IBB, has been opened via BIS (not advice, not a recommendation).
The trade is BIS-22-01, with an (initial) entry @ 28.5173
Summary
The news on specific biotech companies is already out if one knows where to look.
Stated time and again on this site, we’re just in the beginning stages of the repercussions.
It even looks like they’ve moved on from the initial scam and are cooking up a new one.
Note: Posts on this site are for education purposes only. They provide one firm’s insight on the markets. Not investment advice. See additional disclaimer here.
This just out from ZeroHedge, linked here, shows the ‘elephant’ has begun to go mainstream.
Another chess-move.
At least one previous post (No.1, linked here), has shown the phenomenon is not a one-off event.
Now, according to the link above, there’s an estimated 300,000 affected … and we’re just getting started.
Insiders Sell … Retail Buys
Do those at the highest levels know their customer base is about to evaporate on a world-wide basis?
While they may not know every detail, they at least know something’s up. Steven Van Metre discusses the insider selling in his latest update, linked here.
Front End Phenomenon
We’re still at the beginning stages of an event that in the opinion of this author, is going to last the lifetime of those reading this post.
‘Hyperbolic statement’ one might say.
To that, I would counter with this; when it was posted, the ‘elephant’ was hyperbolic as well.
Now? Not so much.
Keeping that long range thinking in mind also keeps one from choosing the ‘insane’ human behaviors discussed by Dan (I Allegedly) in his latest post.
So, let’s take a look at what type of insanity we have going on in the markets today.
Of course, that points us to our chief cook and bottle washer, biotech (IBB).
Biotech, IBB
When we last left our hero, savior, and protector of all that is natural immunity, the biotech discussion was on Moderna (MRNA).
The thrust higher, detailed in this post was thought to be too fast for a sustained reversal. Well, it was right and wrong at the same time.
Moderna wound up reversing … sort of.
At the same time, the biotech sector headed lower to support and is now moving higher.
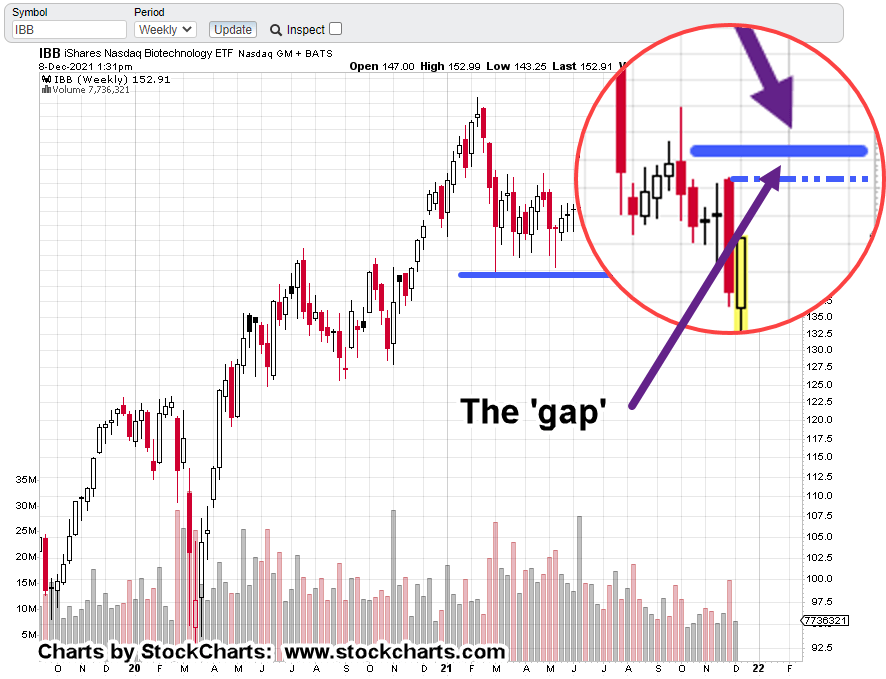
The weekly IBB, chart has the support (lower blue line) and potential up-thrust location (also 50%, retrace) identified.
The zoom shows the narrow gap between the weekly bars and 50% retrace.
If price action makes it past the resistance bars and into the gap, IBB would then be in up-thrust position (not advice, not a recommendation).
Note: Posts on this site are for education purposes only. They provide one firm’s insight on the markets. Not investment advice. See additional disclaimer here.