… Almost There

The 40-year bull market in bonds, is over.
Until price action proves otherwise, each increase in bond price (decrease in rates) is going to be viewed on this site, from a bearish perspective.
That’s not to say bond prices won’t go higher. Counter-trend moves can be trading opportunities.
However, with market blow-ups, internet and broker outages the norm (think, SVB), taking a position against the overall main trend, is not something you’ll typically find presented on this site (not advice, not a recommendation).
With that said, let’s look at where the long-bond proxy TLT, is at this juncture.
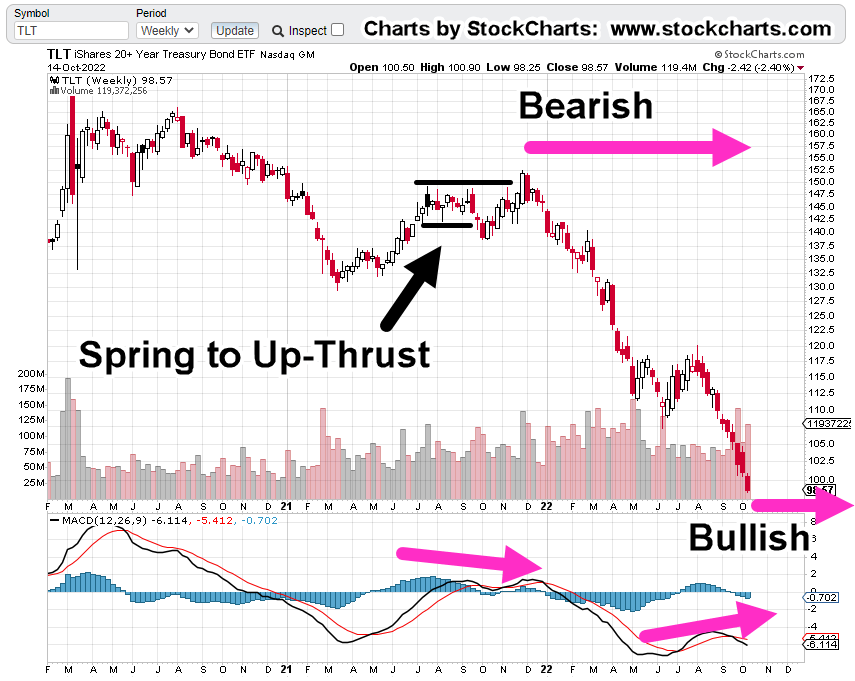
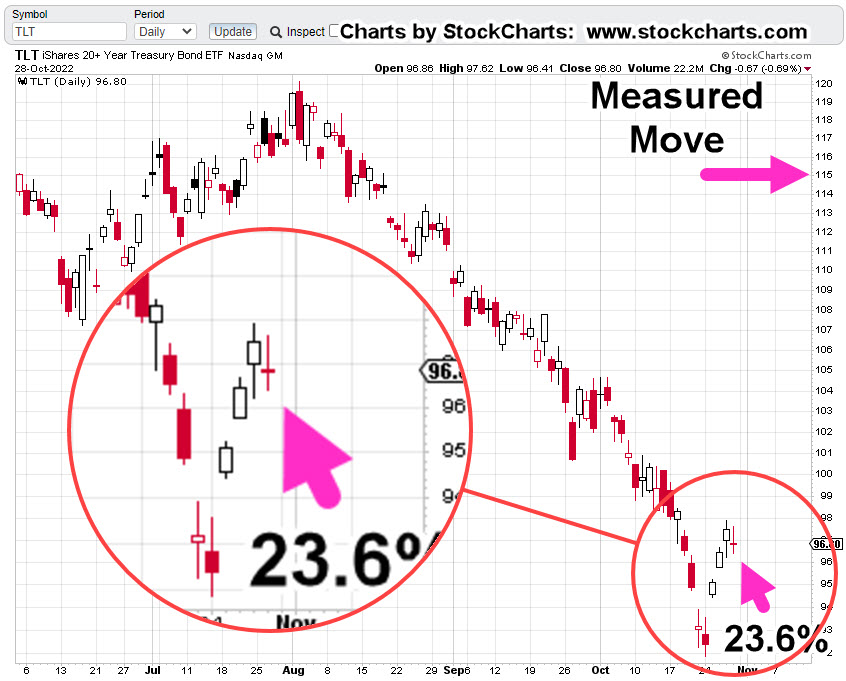
Long Bond TLT, Daily

The chart may be hard to read but it shows the entire move lower from the all-time high posted on March 9th, of 2020.
The magenta arrow and bar is the Fibonacci 23.6%, retrace.
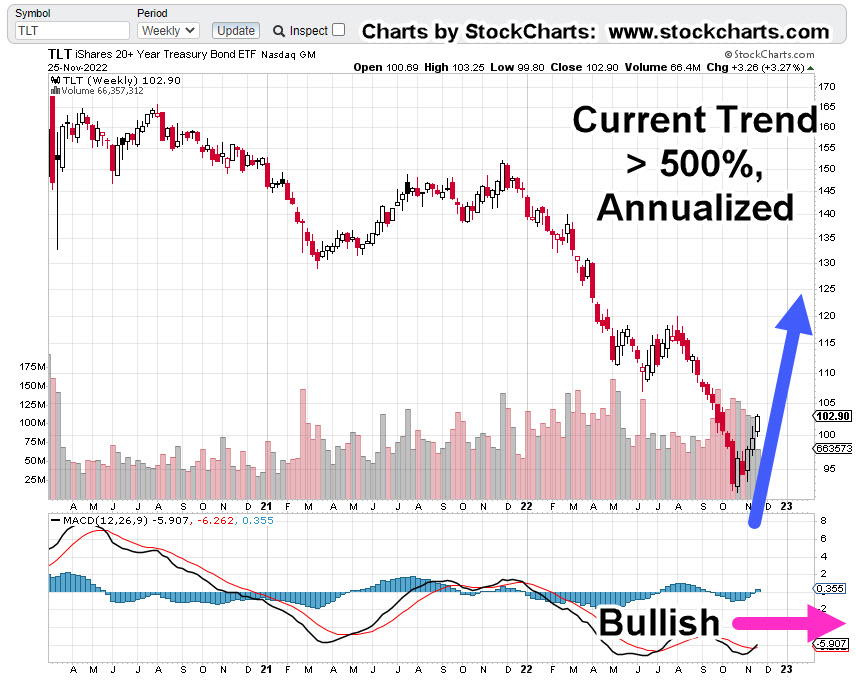
That’s where we’re focused on the chart below, an expanded version of the daily.

The potential set-up is obvious.
If price action breaks out of the (orange) wedge pattern into a measured move, it would retrace to the Fibonacci 23.6%, level, while at the same time, getting itself into Wyckoff Up-Thrust (reversal) position.
The up-thrust would be created if/when price action pushes above the known resistance area shown as the horizontal blue line.
The Danger Point®
If price action moves into the set-up area as shown, TLT would be at The Danger Point®
This is an area of instability.
At that point, it does not take much force to move the action in either direction, hence the name.
Strategy
As this post is being created, a quick check of ZeroHedge turns up this article, just released.
The article makes the statement as well, the bond bull market is over and uses the 10-yr Treasury to show the upside (yield) breakout.
The bottom line:
We’re in a highly dynamic environment where the typical money manager, financial advisor (as reported by Neil McCoy-Ward) finds themselves “clueless”.
If ever there was a point in time to focus exclusively on what price action is telling us using Wyckoff analysis, this is the time (not advice, not a recommendation).
The Sunday futures open in about six hours.
Stay Tuned
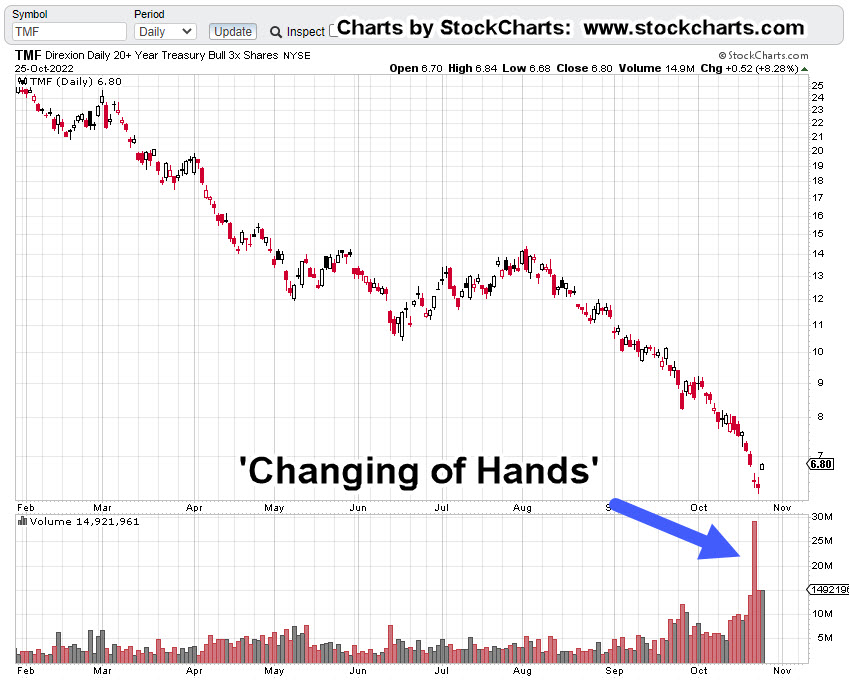
Charts by StockCharts
Note: Posts on this site are for education purposes only. They provide one firm’s insight on the markets. Not investment advice. See additional disclaimer here.
The Danger Point®, trade mark: No. 6,505,279