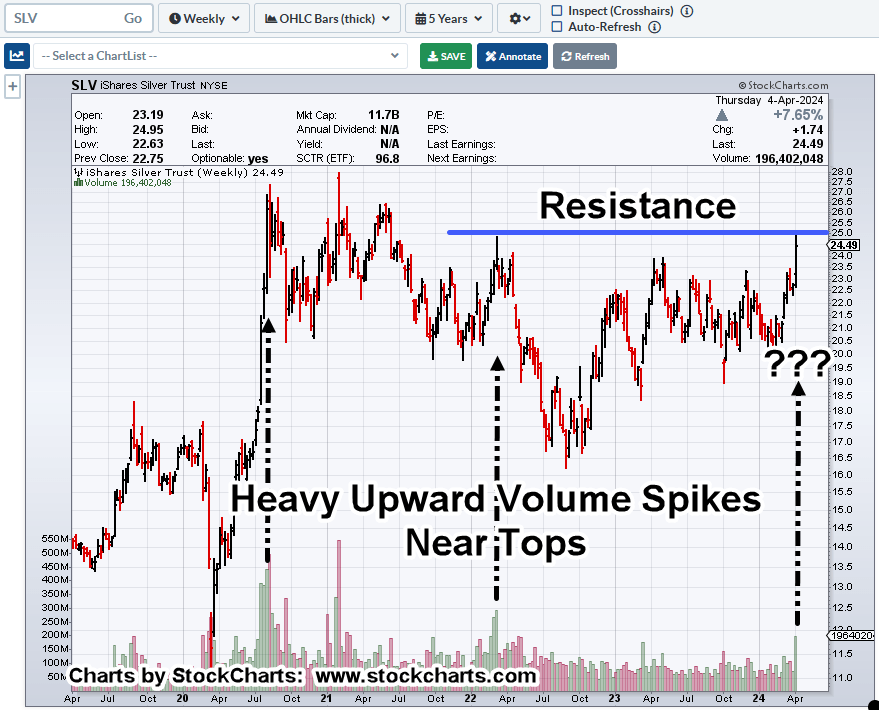
Penetrates & Holds Below Support

Penetrating and holding just below support, we know what that means.
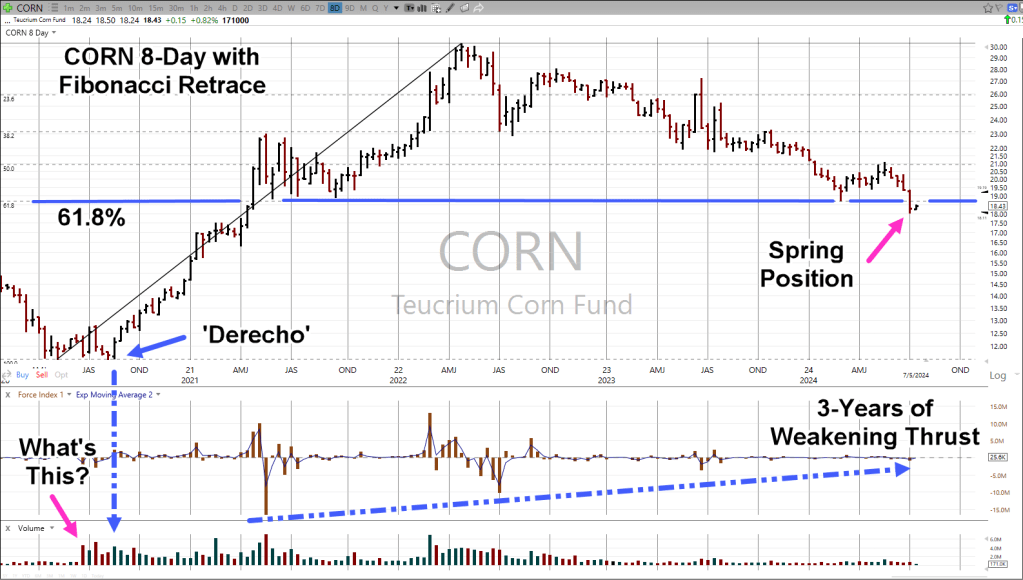
CORN is at The Danger Point®, in spring position (not advice, not a recommendation).
The chart below covers over four-years of price action; within that, we have at least three technical items to cover.
Somebody Always ‘Knows’
First, how does volume in CORN, go from basically nothing, to increasing over 400%, six weeks before, the perfectly timed and positioned (in the corn belt), ‘Derecho‘.
That location is identified as ‘What’s This?’
As Wyckoff said a century ago: ‘Somebody always knows something and that ‘something’ shows up on the tape’.
CORN Fibonacci, 8-Day
Second, is the successive decrease in downward thrust over the past three-years; at this point, nobody’s watching.
All of that brings us to the third technical point.
CORN has retraced to support (blue line) which just happens to be a Fibonacci 61.8%, level; penetrates that support and so far, has stopped dead.
Stay Tuned
Charts by StockCharts
Note: Posts on this site are for education purposes only. They provide one firm’s insight on the markets. Not investment advice. See additional disclaimer here.
The Danger Point®, trade mark: No. 6,505,279