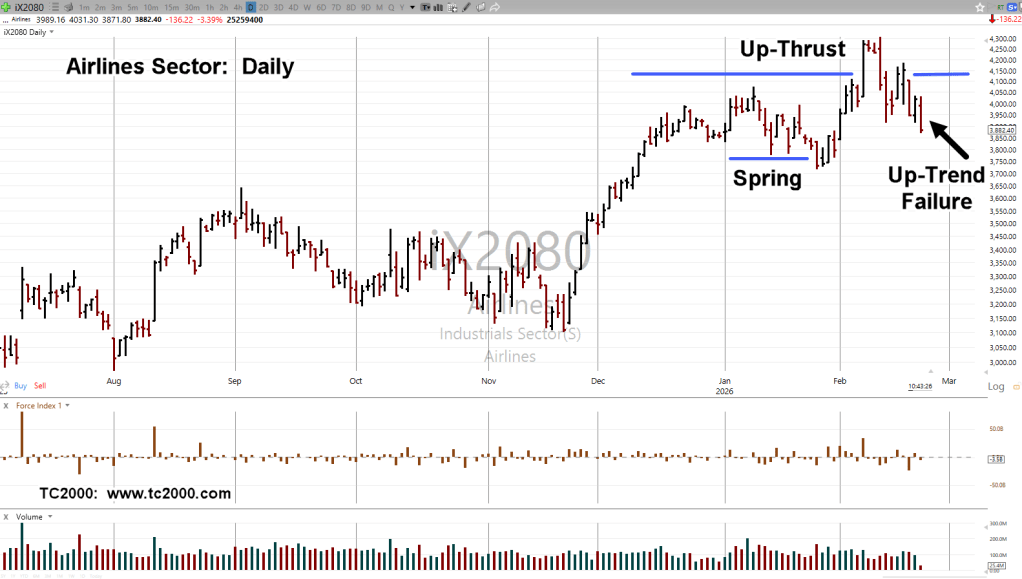
Today was the day when the airline sector was supposed to resume its uptrend into a (possible) new high.
Early in the session, that move has failed (not advice, not a recommendation).
Instead of moving higher, price action printed a new daily low.
As Dr. Elder said years ago in ‘Come Into My Trading Room‘, when a set-up fails, at times, it’s best to exit (if positioned) and re-enter in the opposite direction.
Airlines Sector, Daily
Last Friday’s action was a reversal bar with a higher close. The inference was for continuation to the upside.
As the arrow notes, that move has failed.
The benefit, is a well-defined stop (if short); that is, today’s session high (not advice, not a recommendation).
Note: Posts on this site are for education purposes only. They provide one firm’s insight on the markets. Not investment advice. See additional disclaimer here.
Note: Posts on this site are for education purposes only. They provide one firm’s insight on the markets. Not investment advice. See additional disclaimer here.
Note: Posts on this site are for education purposes only. They provide one firm’s insight on the markets. Not investment advice. See additional disclaimer here.
To answer that question, or at least look at the probabilities, let’s step away from the breathless, me-too herd, and see what’s really going on.
Silver, One Year Later
Before we get to what the crowd’s doing now, as a reminder, last year at this time (the crowd said), silver was supposed to be launching into a hyperinflationary breakout.
Remember that? Well, it didn’t happen. 🙂
This site posted for months, price action itself (SLV) indicated the probabilities were low for a sustained breakout, starting with this link.
However, there are times when the masses are correct. Is this one of those times?
Let’s take a look.
First, The Hysteria
To get a gage on what’s going on, we have a sample of the current mind-set, listed below.
‘Sell America’ Trade Sparks Gold-Rush, Dollar Crush As US Bond Yields Surge Most In 43 Years, link here.
Gold Euphoria, Bond Mayhem, Dollar Disgrace, link here.
Note: Posts on this site are for education purposes only. They provide one firm’s insight on the markets. Not investment advice. See additional disclaimer here.
The biotech short LABD-25-05, has been closed: Profit on the main position is +61.25% (not advice, not a recommendation).
While the market is hysterical, price action in XBI, indicates the current down move is losing (some) energy, hence the reason for the exit.
Biotech XBI, Daily
Exit was made at the lower channel line (demand line) contact.
The market could certainly continue lower from here.
However, from past experience and watching huge profits erode to only mediocre results, the same mistake is not being presented here (not advice, not a recommendation).
Meanwhile, the gold miners don’t look like the safe haven everybody thought they were.
Note: Posts on this site are for education purposes only. They provide one firm’s insight on the markets. Not investment advice. See additional disclaimer here.
Out in the mainstream, they tell us the smart money (maybe, even retail) is selling, or selling short, here, here, here, here and here
There’s also recession talk, here; couple that with utter confusion, here.
Then, if we do have a ‘recession’ (or depression) it’s time to blame somebody, right?
As Dr. Elder said years ago (paraphrasing):
‘When there is a change the market, there’s a lot of turbulence before action settles into a definable trend.’
Taking everything in aggregate above, that could be where we are now.
In Style
Some of the links above, are still attempting to make a bullish argument.
For them, it’s not quite time to have a bearish stance. It’s not yet fashionable.
For this site however, every trade (453 of them) for last year, 2024 (ex. UNG), was to the short side (not advice, not a recommendation).
By the time, the bear has fully clawed the market (if or when), it’s most likely too late for any low-risk positioning.
One market that may be acting as a defensive move, are the miners, GDX, GDXJ.
Junior Miners GDXJ, Daily
GDXJ, is either slipping away to the downside or it’s preparing for another attempt at higher prices.
At this point (1:12 p.m., EST), the support/axis line has not been decisively penetrated to the downside, suggesting probabilities are for higher prices (not advice, not a recommendation).
Before anyone gets overly bullish, let’s also keep in mind, the high print at the left of the chart in October of last year, is still below the print discussed in this post. over four years ago (not advice, not a recommendation).
Note: Posts on this site are for education purposes only. They provide one firm’s insight on the markets. Not investment advice. See additional disclaimer here.
There was an early morning ‘blip’ to the upside that was quickly retraced.
Known & Unknown
Some things are known.
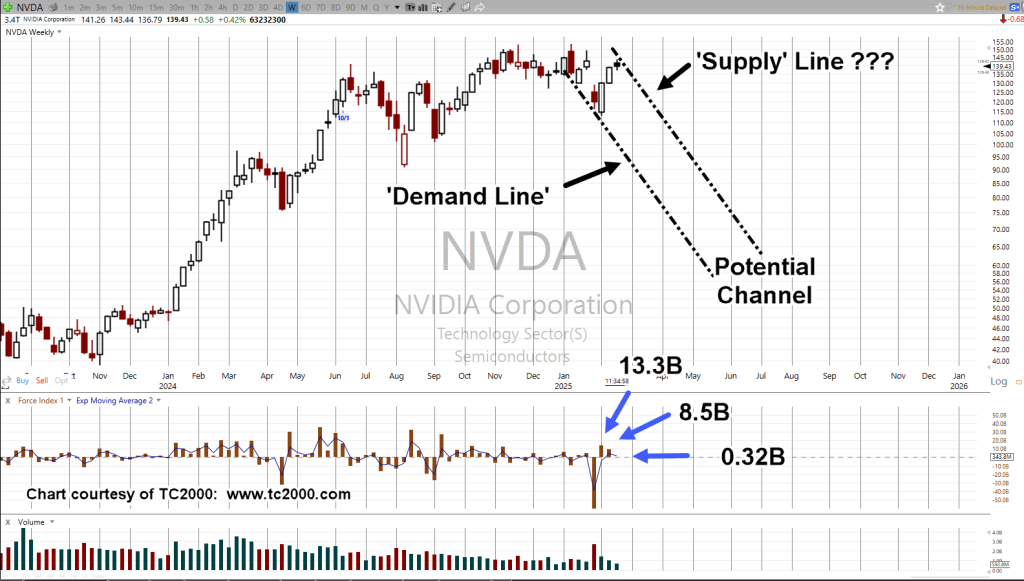
We know Nvidia printed the largest-ever, downside thrust energy during the breakdown, January 27th.
Then came the process of retrace and test.
Also known (see chart) upside energy, i.e., Elder’s Force Index, at this point, has dissipated to almost nothing; suggesting the test is complete or near complete (not advice, not a recommendation).
Nvidia NVDA, Weekly
At this juncture (12:18 p.m., EST) Nvidia is just 0.16-pts away from a lower weekly close and reversal bar.
The ‘Supply’ line is of course unknown until there’s more confirmation.
Bubbles Past
If we’re in a bubble, then work has already been done (link here) on what to expect when price action has tested its last to the upside, then turns lower.
Note: Posts on this site are for education purposes only. They provide one firm’s insight on the markets. Not investment advice. See additional disclaimer here.
The last update on ProLogis, PLD, proved to be (somewhat) incorrect.
There was no definitive assessment on direction, but from the sidebar, one could see an open short position in sector index IYR, as DRV-25-01.
That short was closed nearly immediately at the next session as PLD, ratcheted higher along with IYR.
Since we’re at ‘-04’, increment on DRV, there have been four attempts to position short with DRV-25-04, currently open (not advice, not a recommendation).
Gain/loss (all positions) is near break-even, at -0.38%
All of which brings us to ProLogis … again.
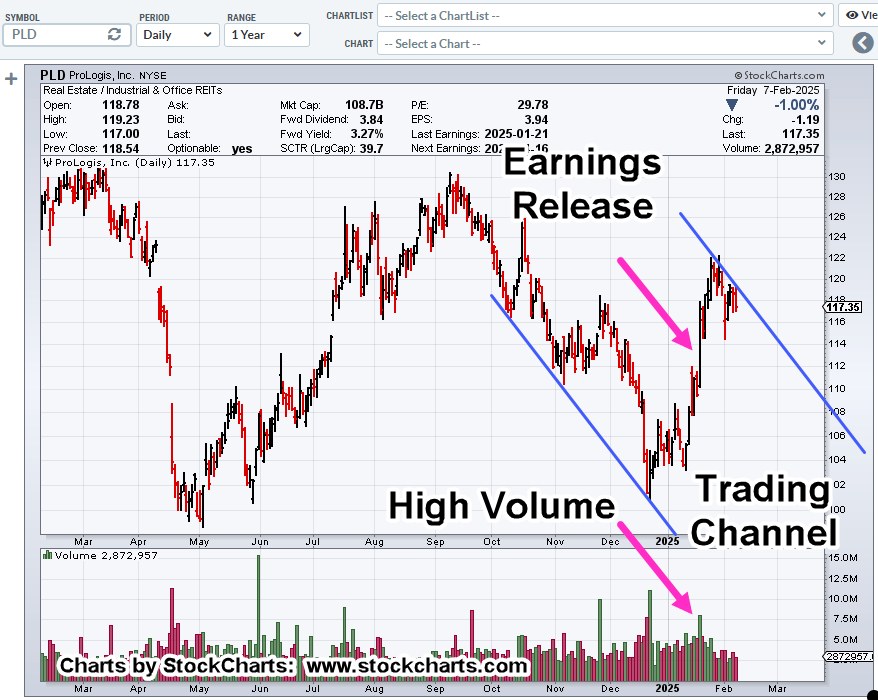
ProLogis, PLD, Daily
There’s a lot going on in this chart.
The last earnings release for PLD, resulted in a wide bar on heavy volume.
Nearly instantly, and from a Wyckoff standpoint, we should know what that means … or what is probable:
The wide bar, volume, are likely to be ‘tested’ (not advice, not a recommendation).
Next update, we’ll discuss the Up-Thrust (reversal) condition for PLD.
Note: Posts on this site are for education purposes only. They provide one firm’s insight on the markets. Not investment advice. See additional disclaimer here.
Note: Posts on this site are for education purposes only. They provide one firm’s insight on the markets. Not investment advice. See additional disclaimer here.
Note: Posts on this site are for education purposes only. They provide one firm’s insight on the markets. Not investment advice. See additional disclaimer here.