Note: Posts on this site are for education purposes only. They provide one firm’s insight on the markets. Not investment advice. See additional disclaimer here.
The (potential) big ruse, interest rates are heading lower. We have the usual suspects, spinning how soon we’ll have the next rate cut.
Well, back at the ranch, home builder Lennar Corp. (LEN), posted massive down-thrust, selling energy this past Friday, after Thursday’s post-market earnings release.
As we’ll see below, force on the move was potentially the second highest ever, in the history of trading for the company (data going back to 10/5/18).
Lennar Corporation LEN, Daily
At this point (11:27 a.m., EST) LEN is having an ‘inside day’, trading within Friday’s price action.
Inside days are typically preparation for another kind of day, an ‘outside’ day 🙂
That’s where the trend is confirmed (not advice, not a recommendation).
Note: Posts on this site are for education purposes only. They provide one firm’s insight on the markets. Not investment advice. See additional disclaimer here.
Note: Posts on this site are for education purposes only. They provide one firm’s insight on the markets. Not investment advice. See additional disclaimer here.
Those monitoring this site are witnessing the search (for the short entry) in real time.
As said in the prior update, just because Fibonacci lines up, both in time and distance, does not guarantee anything.
From a Wyckoff perspective, as a result of Wednesday’s XBI price action penetrating the prior days’ low, and then stopping dead, there was a probability of a (minor) spring … which we got the very next day.
By the way, that upward move (yesterday) carried the XBI, near another Fibonacci retrace level: 61.8%.
As a result, the LABD-24-17, was exited with about a 3.6% loss (not advice, not a recommendation).
Now, on to the action at hand.
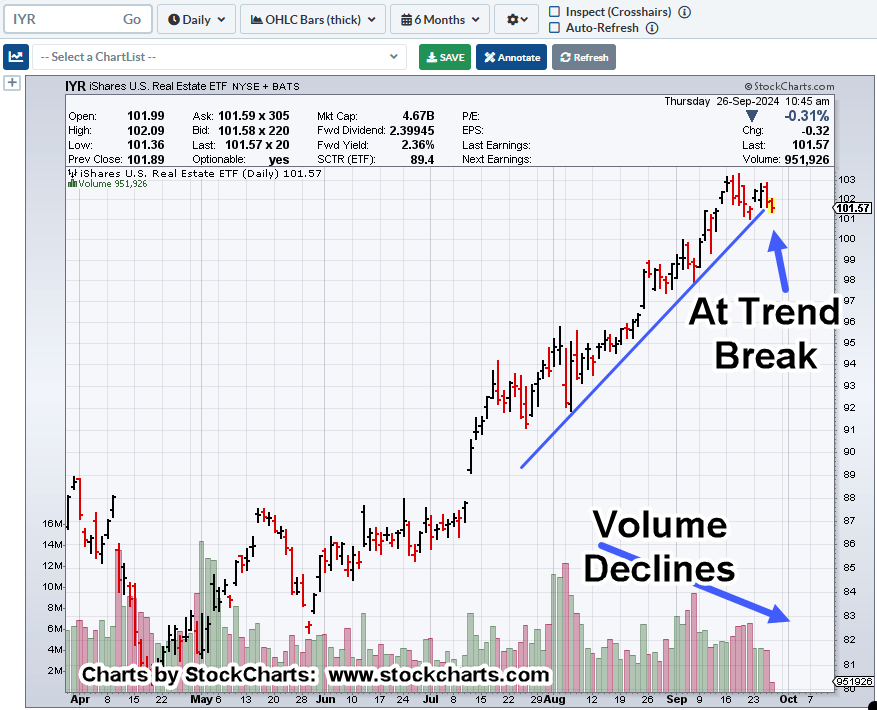
Real Estate IYR, Daily
Depending how price action progresses, we’ll go into more detail on the technical condition.
Today printed a new daily low and we have an MACD (bearish) crossover still in effect.
Trade action was to go short via DRV with a representative stop (for DRV) one tick above the IYR high: 95.96 (not advice, not a recommendation).
Admittedly, it’s a tight stop and that’s the point.
If IYR turns and starts to exhibit buoyancy, we don’t want to hang around.
Note: Posts on this site are for education purposes only. They provide one firm’s insight on the markets. Not investment advice. See additional disclaimer here.
Every day, the tape prints one more clue to the next probable direction.
The next probable direction.
Part of an experienced speculator’s pre-market prep is to know from the prior session, the ‘correct’ answer for the current session.
That is, if a set-up has materialized, then subsequent price action will have a specific or variation of a specific pattern.
If the pattern posts on the tape, we have the ‘right’ answer. If not, probabilities are saying ‘no’ at this point.
Of course, the hard part and according to Wyckoff, it laterally takes many years of observing and working with price action to know what to expect.
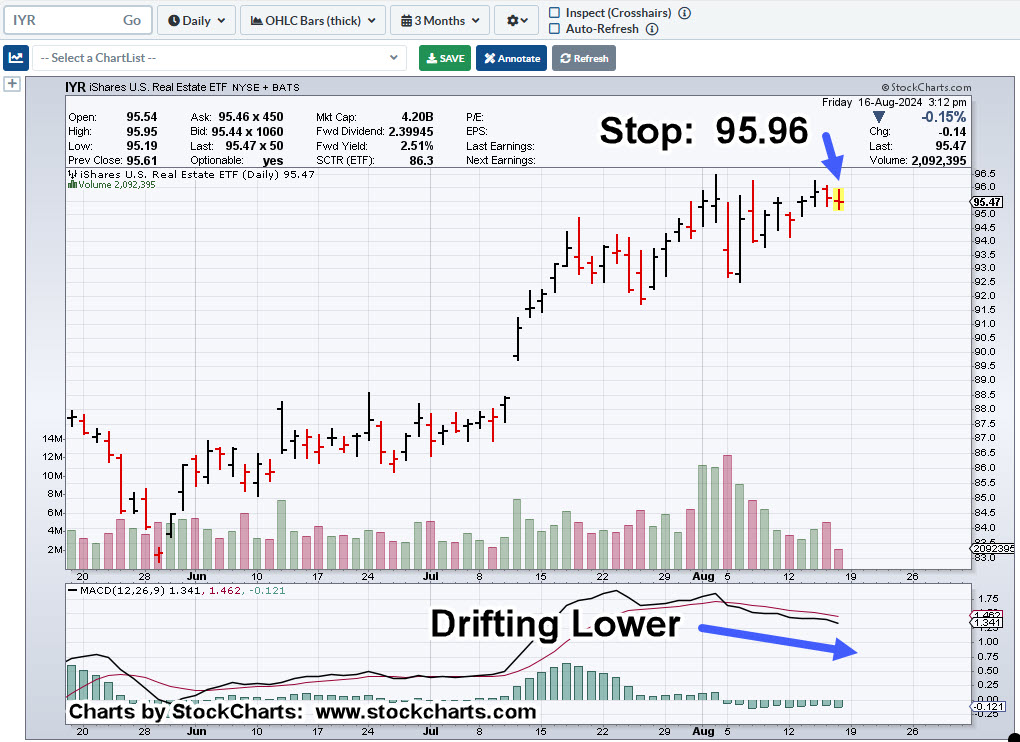
Real Estate, ‘Wrong’
This morning’s session in real estate, IYR did not post the ‘right’ answer from a short standpoint. A lower open and lower print was the expectation.
Therefore, DRV-24-02, was exited with just over a 2%, loss (not advice, not a recommendation).
However, oil and gas XOP, gave the ‘right’ answer.
Oil & Gas XOP, Daily
The circled price action is what we’re looking for (not advice, not a recommendation).
There’s a lot going on with this chart.
If XOP continues lower and short, DRIP-24-01, is not stopped out or exited, we’ll re-visit this action with further updates (not advice, not a recommendation).
Note: Posts on this site are for education purposes only. They provide one firm’s insight on the markets. Not investment advice. See additional disclaimer herexop
Note: Posts on this site are for education purposes only. They provide one firm’s insight on the markets. Not investment advice. See additional disclaimer here.
If there’s one market attracting huge numbers of grifters, carpetbaggers, peddlers, and all-around crazies, it’s precious metals.
I’ve been hearing from this crowd, ‘the government’s going to collapse, the dollar’s going to collapse’, since the early 1980s.
As said many times before, I like precious metals as much as the next guy.
However, from a strategy standpoint, with each passing day, we see it’s the food supply (here, and here) that comes first (not advice, not a recommendation).
What’s currently taking place is so much more complicated (in my opinion) than just ‘stacking’.
Let’s not forget the flood of ‘fake’ or ‘diluted‘ precious metals and other chicanery; like having your coin-shop bank account closed for no apparent reason.
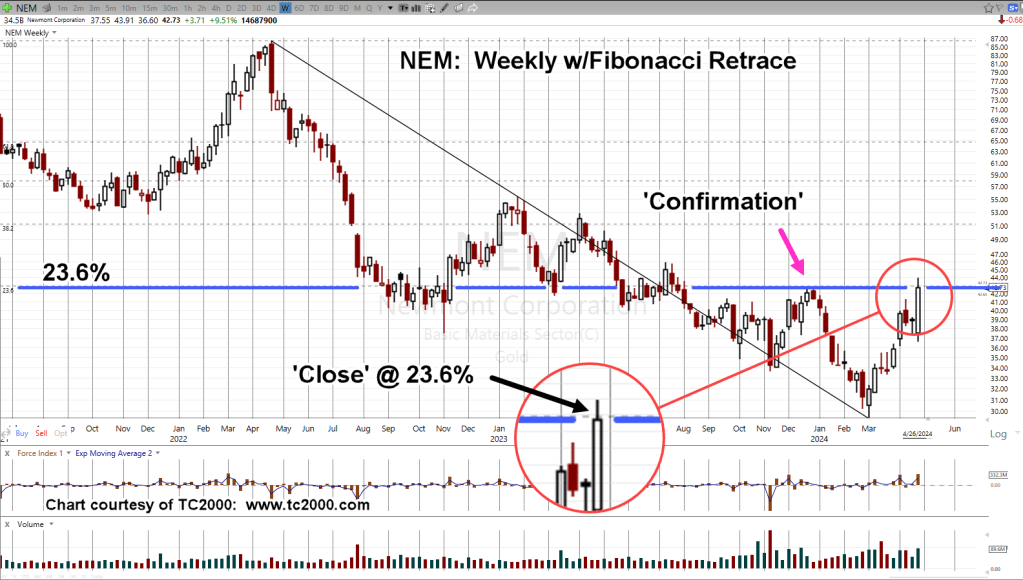
Well, we have to keep the loonies on the path which brings us to our case in point, Newmont Mining, NEM.
Newmont, Good News is Bad News
Gold price has moved higher over the past four to five months and expectedly, that’s been noted in Newmont’s latest Quarterly release, link here.
NEM, stock price at ‘nine-month highs’, what’s not to like?
It’s when we look at the chart, we see a different story.
Newmont Mining, NEM, Weekly
After all the ‘good news’, NEM has only retraced an anemic 23.6%, of its overall downside move.
Note the close on Friday was right at the 23.6% level, giving it even more significance.
This level has also become an ‘axis line’ as exhibited by price action going back to August of 2022.
By The Numbers
When looking through the major sectors, retrace (and reversal) from 23.6%, is becoming more frequent.
Two other indices posting and reversing from that level (measured from recent highs), are biotech XBI, and real estate, IYR.
NEM, What’s Next?
Thursday, 4/25, was a wide bar with heavy volume.
We’ve stopped at the retrace, which is also resistance, confirmed by price action in late December. ’23.
A reasonable expectation is NEM, retraces, testing the wide bar and volume before continuing to the downside or moving back higher to a breakout (not advice, not a recommendation).
Note: Posts on this site are for education purposes only. They provide one firm’s insight on the markets. Not investment advice. See additional disclaimer here.
Note: Posts on this site are for education purposes only. They provide one firm’s insight on the markets. Not investment advice. See additional disclaimer here.
The prior session low was penetrated as well as the high with an overall lower close.
All of which brings us to the chart.
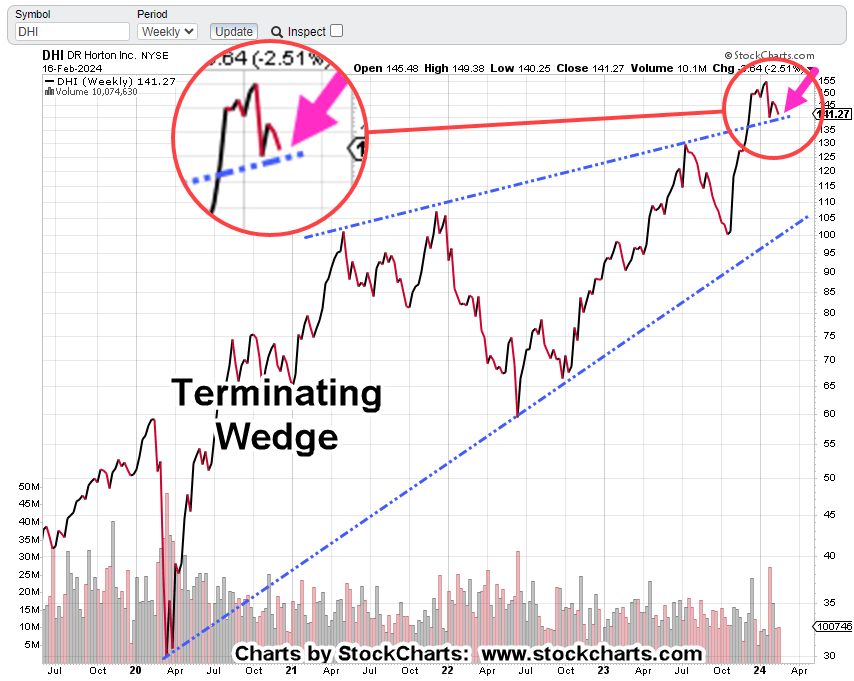
D.R. Horton, DHI, Weekly
Looking at the chart, it’s self-explanatory.
We’re in a terminating wedge that’s in a ‘throw-over’.
If price action gets below the upper wedge boundary, it’s a confirmation. That in turn, would suggest much lower prices ahead (not advice, not a recommendation).
Note the massive down-thrust. We have to go all the way back to the ‘event’, to see anything similar.
Note: Posts on this site are for education purposes only. They provide one firm’s insight on the markets. Not investment advice. See additional disclaimer here.
We’ve all heard, it’s 80% planning and 20% trading.
So it is, with D.R. Horton (DHI).
As a reminder, this site addresses strategic positioning first, then tactics, and then focus. See the About section for more.
Strategy Review
Unless the charts say otherwise, rates are going higher, not lower. Gold and silver will likely go lower first, before going higher, supply destruction and resulting price increases will continue (not advice, not a recommendation).
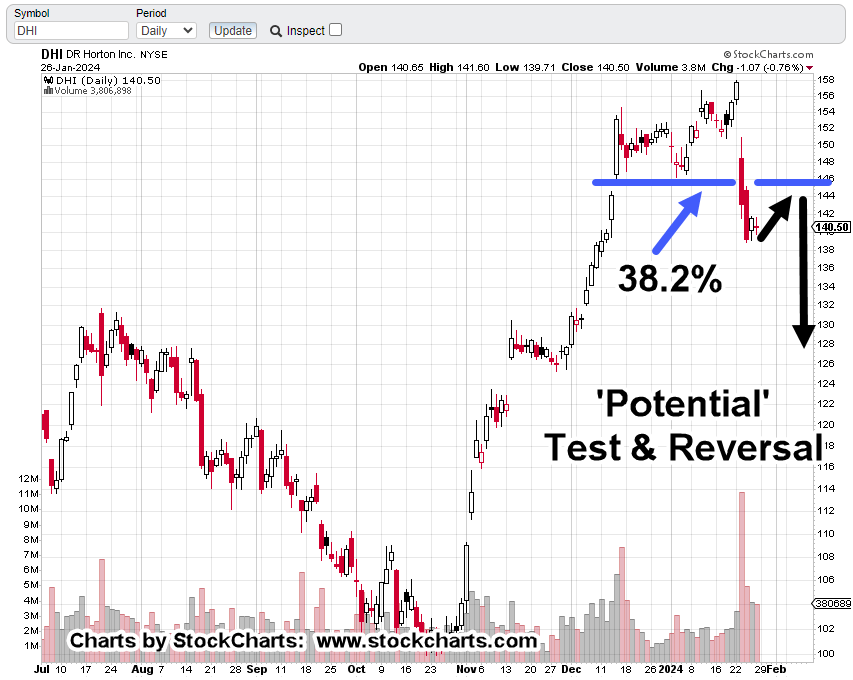
D.R. Horton: Possible Retrace
One of two scenarios are likely.
DHI could continue its decline, straightaway. Monday’s open could be gap-down, posting down, no looking back.
The next scenario, a retrace to test underside of resistance. As the chart below shows, that underside is right at 38.2%.
DHI, Daily
The chart presents ‘potential’ only. If the market is well behaved, a retrace to test is a reasonable expectation.
If there’s a retrace, Fibonacci Day 8, from the 1/22/24, high is this coming Wednesday, the 31st.
That day just so happens to correlate with the Fed interest rate announcement due out at 2:00 p.m., EST.
Note: Posts on this site are for education purposes only. They provide one firm’s insight on the markets. Not investment advice. See additional disclaimer here.