Looking for, New Daily Low

The Russell 2000 has been recovering (along with the rest of the major indices) from the lows posted on April 7th, and 9th, this year.
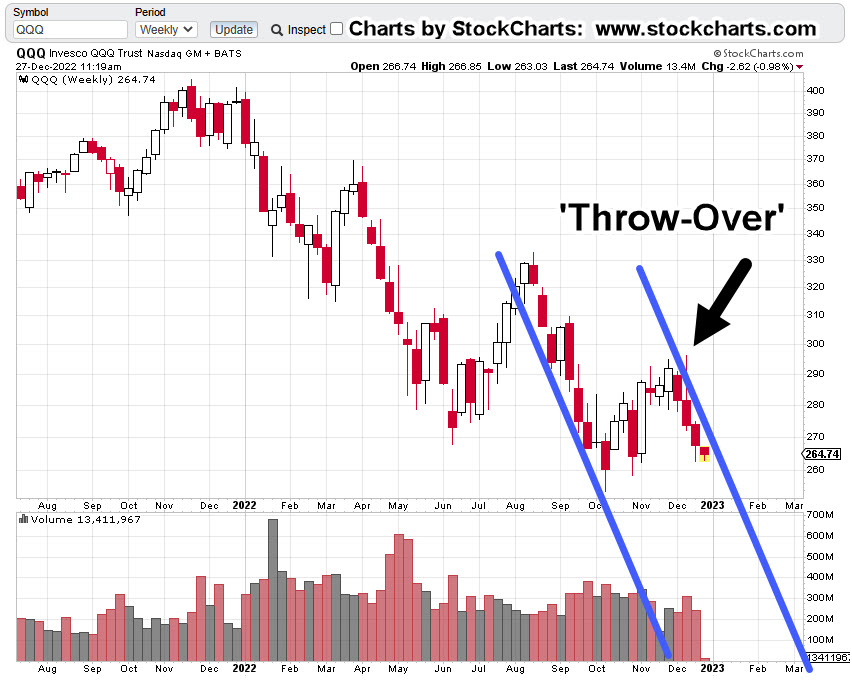
What the index has not done, unlike the Qs, and the S&P is post new-all-time highs.
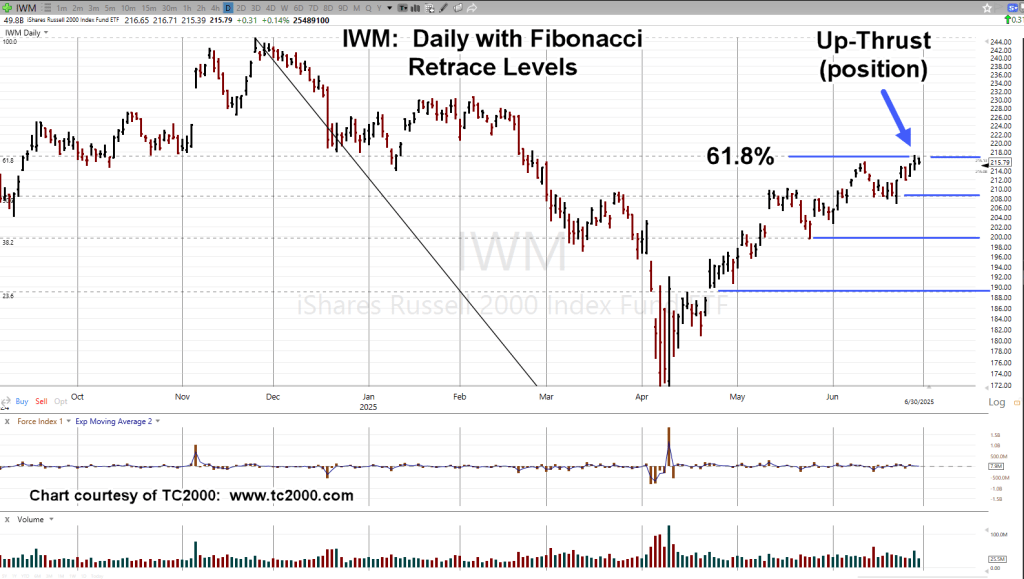
At this juncture, tracking fund IWM, is at a Fibonacci 61.8%, retrace, and giving just a hint, it might be finished with further upside.
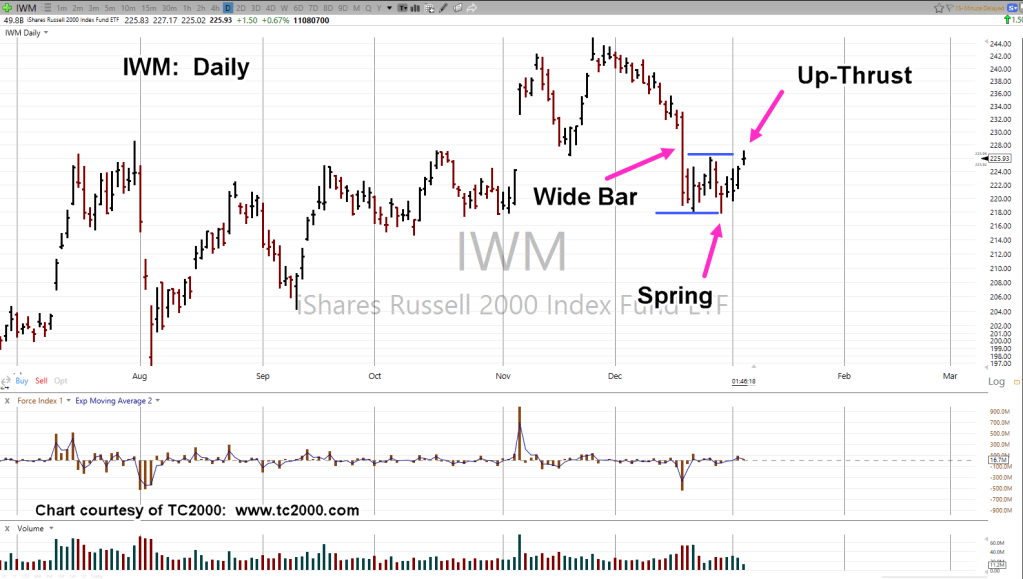
Russell 2000 ETF, IWM, Daily
As the chart notes, we’re in up-thrust ‘position’; meaning, there’s no new daily low to help confirm a potential reversal.
As presented many times in previous posts:
‘In the markets, you’re either early, or late’.
Upside risk (on a short) is set at last Friday’s IWM high; risk is low (but not zero).
With that said, a short position was opened (after-hours session, yesterday) in the IWM, via leveraged inverse fund TZA, trade TZA-25-03 (not advice, not a recommendation).
Note: There was no ‘new daily low’ in the IWM tracking fund to ‘confirm’.
However, in the pre-market, IWM is trading lower at 214.72, and threating to post a new daily low at 214.13.
Open Positions
At this juncture, 8:50 a.m., EST, open positions are as follows (not advice, not a recommendation).
Short Wal-Mart: WMT-25-03, Stop @ 98.16
Short Tractor Supply Co.: TSCO-25-01, Stop @ 52.93
Short IWM: TZA-25-03: Stop @ 11.68
Stay Tuned
Charts by StockCharts
Note: Posts on this site are for education purposes only. They provide one firm’s insight on the markets. Not investment advice. See additional disclaimer here.
The Danger Point®, trade mark: No. 6,505,279