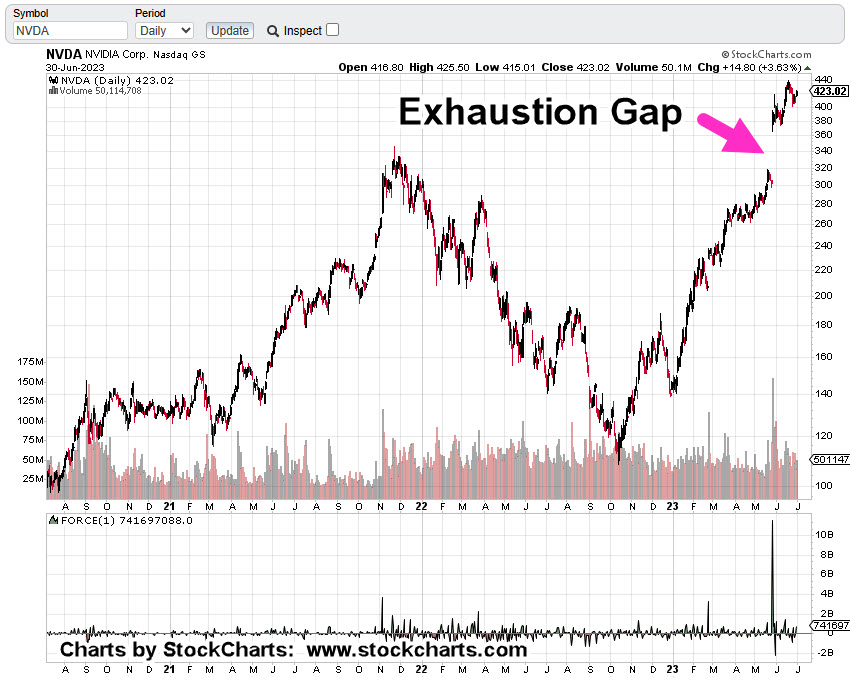
The ChatGPT craze lasted just long enough to ramp Nvidia and the SOXX, to stratospheric levels.
In the coming weeks and months, we’re likely to see who ‘cashed-in’ (a la Elon Musk) and for how much.
When a bull market nears the end of its lifecycle, it tends to thin-out.
As the smaller cap stocks fall away and underperform, they’re sold and that capital’s funneled into the ‘last man standing’; in this case, Nvidia (NVDA).
Broadcom (AVGO) is there as well, but it’s a distant second at 1/3rd, the market cap of NVDA.
Short Positioning
We’re short this sector via SOXS (not advice, not a recommendation) with entries shown in the prior update.
There was a third entry on 7/6 (not shown), but it’s minimal size when compared to the others.
Now, on to the charts
Semiconductor Leveraged Inverse Fund, SOXS
The following chart has the current hard-stop progression and soft-stop (trader discretion) locations.
Moving in closer with the zoom version.
The ‘AI’ bulls are in their brain stem (un-thinking), enabled in their fantasy by articles like this one and this one.
Of course, there’s more like here and here but we get the picture.
Taiwan Semi (TSM) Earnings Date
At the time of this update, TSM earnings date was an estimate, now confirmed as July 20th, before the open.
Note: Posts on this site are for education purposes only. They provide one firm’s insight on the markets. Not investment advice. See additional disclaimer here.
The top in the SOXX, was correctly identified, here.
The potential completion of the downside test and reversal was discussed, here.
After that last post, the SOXX limped higher for one day, before reversing, today.
In fact, today’s session lows took out the daily lows of the prior two sessions.
This update will be brief.
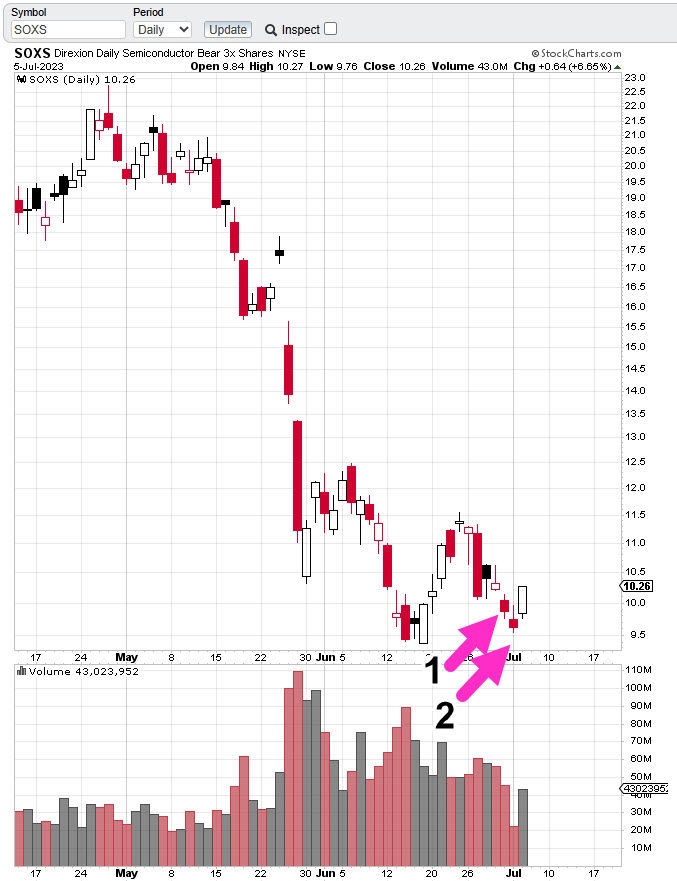
A short position (via SOXS) was initiated on Friday June 30th, then increased by 20%, this past Monday, July 3rd (not advice, not a recommendation).
Semiconductor Leveraged Inverse Fund SOXS, Daily
Entries are shown as Arrow No. 1 and No. 2
An original soft stop (trader discretion) and hard stop were given of 9.75, and 9.48, respectively.
Price action on Monday pushed through the soft stop and trader discretion was to maintain the position.
As a result of today’s action, the hard stop has been moved up to SOXS 9.54, with a soft stop at today’s SOXS low of 9.76 (not advice, not a recommendation).
Note: Posts on this site are for education purposes only. They provide one firm’s insight on the markets. Not investment advice. See additional disclaimer here.
Note: Posts on this site are for education purposes only. They provide one firm’s insight on the markets. Not investment advice. See additional disclaimer here.
From a strategic standpoint, this past Friday was the end of the Quarter and possibly the lowest risk spot to short the semis (not advice, not a recommendation).
‘Low risk’, does not mean, ‘no risk’.
We’ll look at the chart below for the SOXX, but first some housekeeping on the Junior Miners, GDXJ.
As stated in the last update, if there was more GDXJ, upside, shorts (via JDST) would be exited. That’s what happened with an overall gain of + 3.57%, on the series (beginning 6/16/23).
Now, on to the next circus … Artificial Intelligence; more specifically, NVDA and its cohort, the SOXX.
Where’s The Money?
With the quarter over, money managers have dutifully shown they’re like everyone else, ‘investing’ in AI.
That’s out of the way, so let’s move on to the specifics:
Referring back to the excellent investigation done by The Maverick, in his view, the $11 Billion, is “Fantasy”.
The tricky part from a chart standpoint, is to identify when or if that fantasy is going to be exposed.
Semiconductor SOXX, Weekly (Inverted)
We’ve taken the weekly chart of SOXX, and inverted it as if going long the leveraged inverse SOXS (not advice, not a recommendation).
Downside force dissipating with each major thrust.
Last week was an ‘inside week’; price action could not make a new weekly low.
Couple that with end of quarter, potential ‘window dressing’ and this past Friday, may have been the lowest risk point, for shorting via SOXS (not advice, not a recommendation).
Analysis … not Advice
This site cannot and will not give advice.
What it can do, is provide analysis and strategy so that you can make your own determination on the market.
With that said, the ‘heads-up’ for a top in the SOXX, was posted on June 17th, link here.
Since that time, the SOXX reversed down and has now come back to test.
Positioning
On Friday, the SOXX, was shorted by entering long the inverse fund SOXS, at 10.01.
Soft stop (trader discretion) for the position is the session low at 9.75, and hard stop (no excuses exit) at all-time low of 9.48 (not advice, not a recommendation).
The coming weeks may prove interesting. All eyes will be on that ‘$11-Billion’.
Note: Posts on this site are for education purposes only. They provide one firm’s insight on the markets. Not investment advice. See additional disclaimer here.
Beginning at time stamp 6:24, at this link, The Maverick goes through an investigation into NVDA, projections.
‘Something doesn’t add up here ….’
That report was three weeks ago. What’s happened, lately?
As of the close this past Friday, NVDA, the largest in the SOXX, was at $1.1-Trillion, market cap. A distant second, is Taiwan Semi (TSM) at $545.5-Bln.
Below, we have a confluence of events for the SOXX.
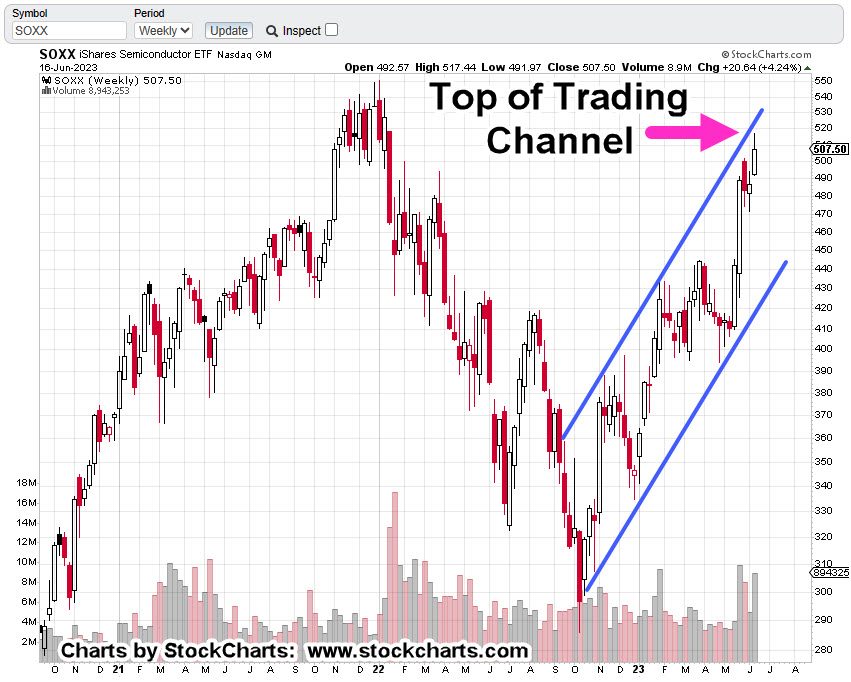
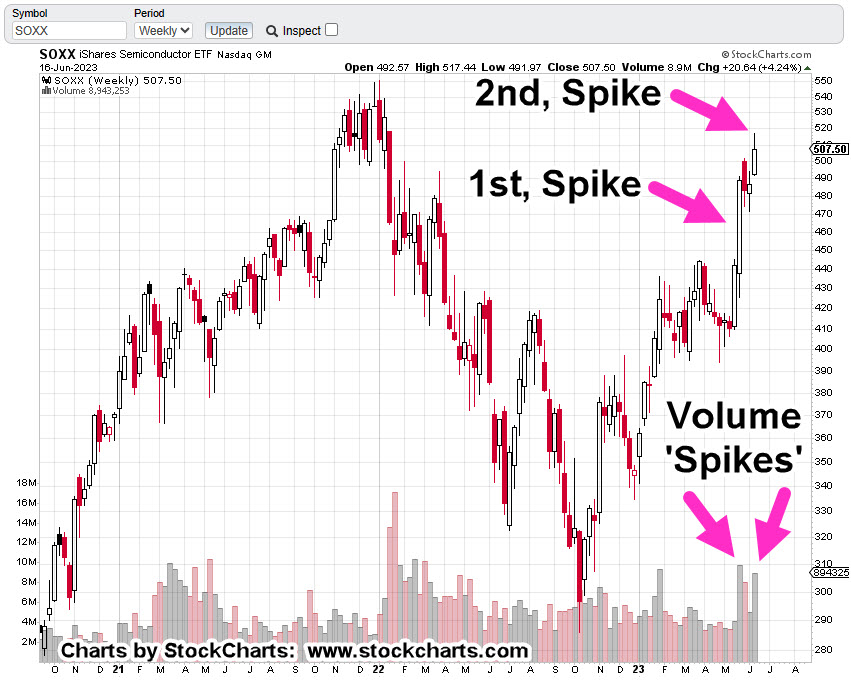
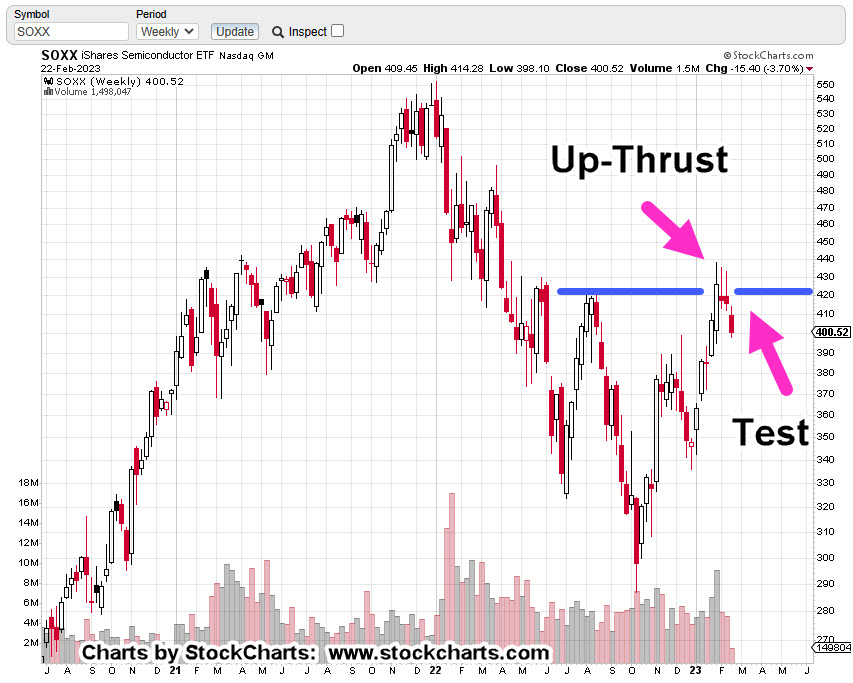
Semiconductor (ETF), SOXX, Weekly Candle
We’re at the top of a trading channel.
We’re in Wyckoff ‘Up-Thrust’ (reversal) position.
A lot of volume expended with less (net) upward progress than previous volume spike; ‘effort vs. reward’.
Getting down to the daily, we see a terminating wedge that’s coupled with reduced volume.
Semiconductor Index SOXX, Daily Candle
So, what does that mean?
The ‘probabilities’ for more upside are, or have been, reduced significantly (not advice, not a recommendation).
Note: Posts on this site are for education purposes only. They provide one firm’s insight on the markets. Not investment advice. See additional disclaimer here.
Note: Posts on this site are for education purposes only. They provide one firm’s insight on the markets. Not investment advice. See additional disclaimer here.
Intel’s a dog … and has been for a very long time.
How do we know that? The price action itself, tells us.
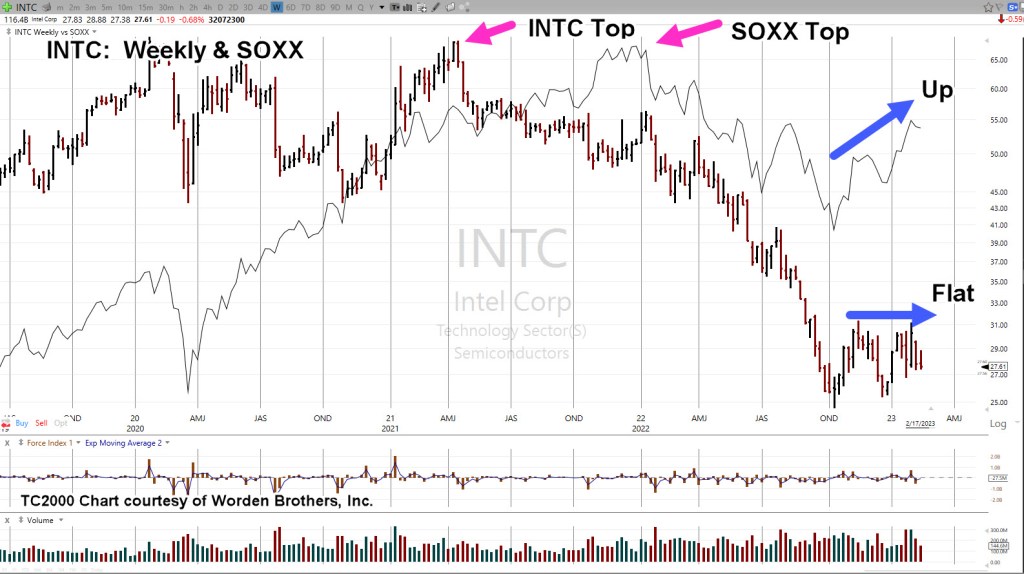
Looking at the weekly chart of INTC, overlaid with the SOXX (thin black line), it’s clear, things literally went south for INTC, right around April, of 2021.
Intel reversed while the sector, the SOXX continued higher.
It’s what happened next, that’s important.
Intel INTC, With SOXX, Weekly
Note how the SOXX has rebounded since mid-October last year while Intel has remained flat.
Even with all the market manipulation to keep the major indices trending higher, having the public thinking ‘the consumer is strong’, INTC has languished.
This lack of upward price action in a rising market, indicates significant weakness.
Has Intel reached a bottom? This is the ‘dip’, isn’t it?
As always, anything can happen and INTC, could launch higher from here. However, it’s not likely.
It’s a juggernaut and at the moment, heading lower.
All of which brings us to the set-up: Options trade to the short side.
Intel INTC, Daily
For a viable Put trade, at least two criteria need to be met (with downtrend already established) and those are: Option time bleed, and what’s called ‘price instability’ or a ‘test’.
The daily close of INTC, shows a prior set-up (‘Test’) and now, at the far right of the chart, forecasted action.
A possible time for the ‘test’ if it occurs would be this coming Wednesday as that makes it ‘Day 13’ from the high on February 3rd.
That day would also coincide with the Fed minutes being released at 2:00 p.m., EST.
Note: When Fibonacci time counts are involved, it was determined years ago (by my firm), when the U.S. market is closed for a holiday and the rest of the world markets are open, it can (and sometimes does) count as a Fibonacci trading day.
Therefore, with world markets open this Monday, and the U.S. closed, it may still count as a Fibonacci trading day.
That in turn, could make this Tuesday ‘Day 13’ (not advice, not a recommendation).
Note: Posts on this site are for education purposes only. They provide one firm’s insight on the markets. Not investment advice. See additional disclaimer here.
The majority of the indices are at their right-side channel lines.
We’ll cover semiconductor SOXX, and QQQs, below. However, biotech IBB, and SPBIO, are in similar positions.
From a calendar and data standpoint, there’ll be plenty that could be used as an ‘excuse’ for market moves but let’s ignore the (intended) distractions and take a look at what the market is saying about itself.
First up, is the semiconductor index, the SOXX.
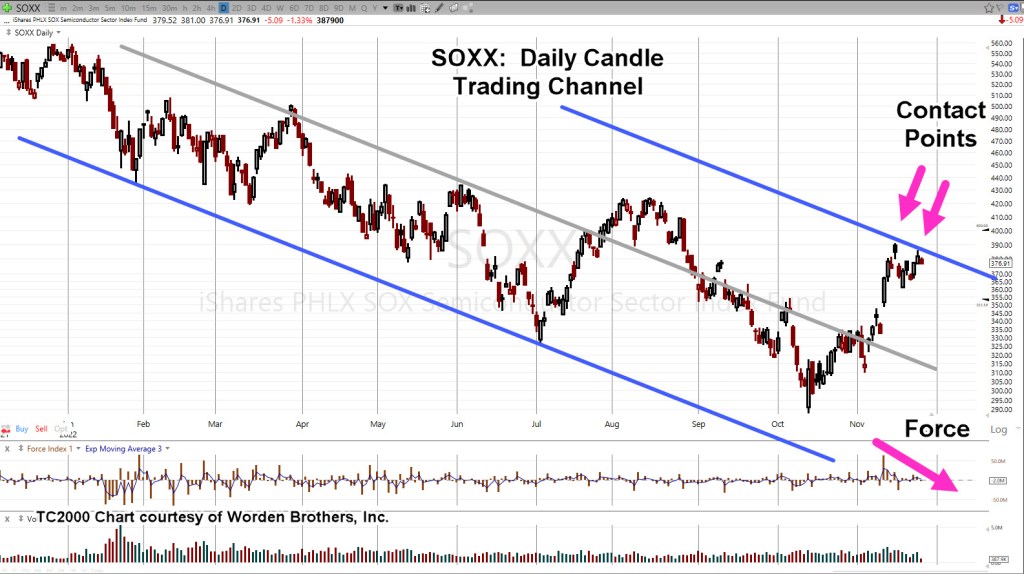
Semiconductor’s, SOXX, Daily
The chart has Fibonacci retrace levels shown. Price action has retraced to 38.2% and stalled.
But wait, there’s more.
Putting in a trading channel, we could be at a reversal point.
Note the upward thrust energy (‘Force’) has dissipated.
the NASDAQ is in a similar situation but weaker from a retrace standpoint.
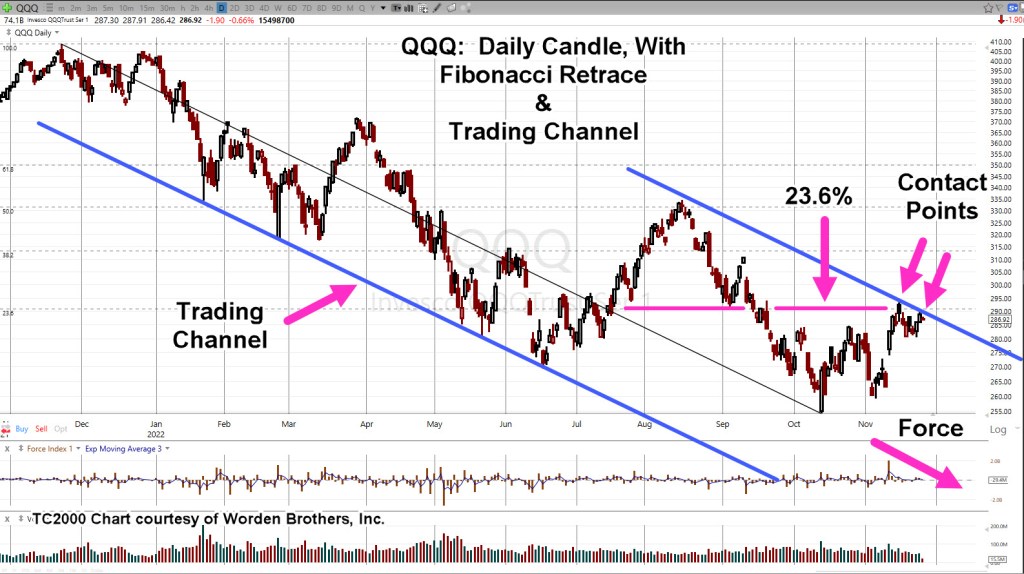
NASDAQ, QQQ, Daily
Looking at the monthly chart for the Q’s (not shown), it’s been a Fibonacci 13-months since all-time highs.
Force dissipation and ‘Contact Points’ are near identical to the SOXX.
Summary
Biotech IBB and SPBIO, are in similar positions. In fact, the overall markets appear poised for downside reversal.
As discussed in the last update, the bond market could be signaling danger ahead with its sharp upward reversal; now (potentially) entering its sixth week.
Note: Posts on this site are for education purposes only. They provide one firm’s insight on the markets. Not investment advice. See additional disclaimer here.
The last update, posted late in the session, said with the upward bias provided by the sizable Op-Ex event, we can look for the weakest (or one of the weakest) sectors.
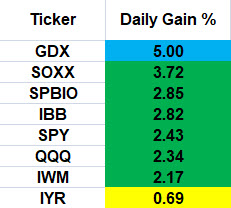
The chart below summarizes yesterday’s action:
Friday 10/21/22, Single Day Gains
Gold miners GDX, is the outlier at the top and real estate IYR, the outlier at the bottom.
Before anybody gets excited about ‘hyperinflation’, just a reminder; silver SLV’s, action has retraced to a weak 38.2% (chart not shown), as it was forecasted to do from last week’s update:
“Silver (SLV) is currently at support levels; therefore, some upward action (staying below SLV: 18.5) is normal behavior.”
Price action is the final arbiter; we’ll see what happens next.
Back to real estate.
Professional Wisdom: ‘The Crash’
We’re going to use the experience and insight provided by Scott Walters concerning the potential for real estate; that is, we’re in a world-wide event the scale of which, no one alive (and possibly, ever) has seen before.
The Economic Ninja has just seconded that opinion (time stamp 3:45) with his quote:
“Right now, we are in the greatest collapse since The Great Depression; and I believe it will be as severe, if not worse, sharper, faster, than what people experienced in 1929”.
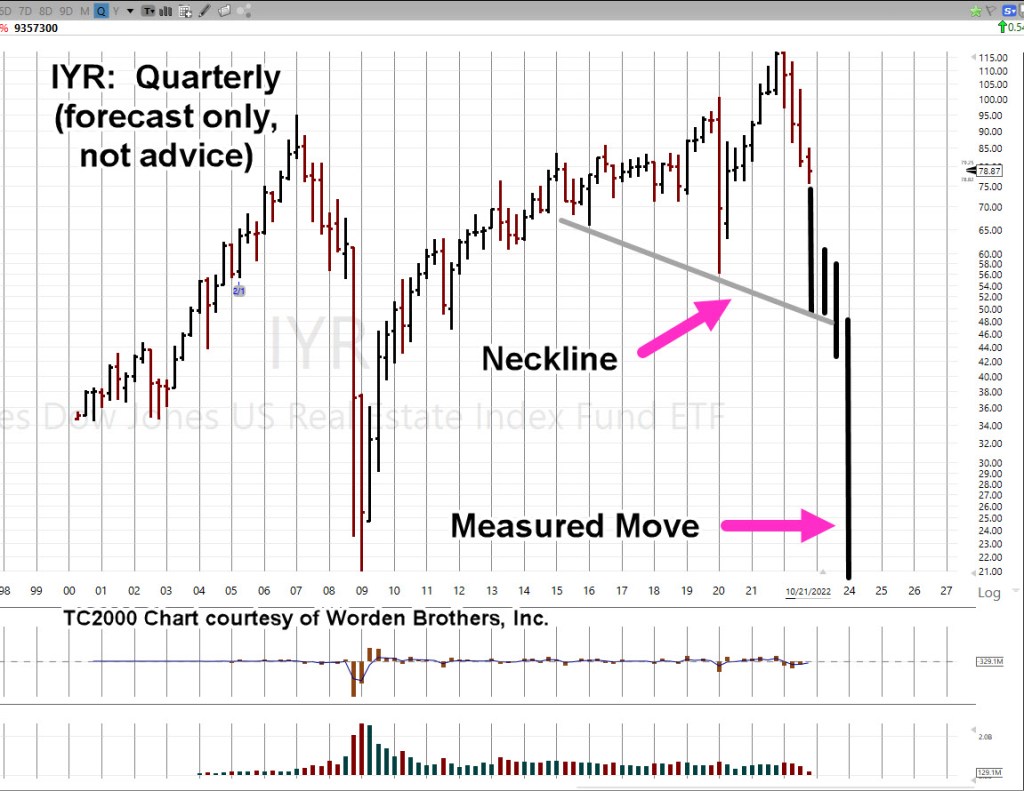
So, what would that ‘collapse’ look like on a chart of real estate, IYR?
Ah, yes. That’s the hard part.
To take useful wisdom like that above, and somehow map it into potential market behavior.
For that, we’re going to use the Quarterly chart of IYR.
Real Estate IYR, Quarterly
There are still two months and one week left to go in the 4th, Quarter.
We’re at a confluence of price action as we’ll cover in the Hourly chart farther down; first, what’s the potential?
Here is one artist’s rendition (not advice, not a recommendation).
That puts it into perspective.
We may know at the very next open, if we’re pivoting higher or continuing the decline.
Butterfly In The Amazon
Of course, the market’s not going to tell anyone its next move. We have to decipher that (read the tape) ourselves.
Sometimes, as Wyckoff said a century ago … ‘It’s as if the weight of a feather is all that’s needed, to push the market further or to reverse.’
So, let’s look at that feather (the butterfly) on the hourly chart.
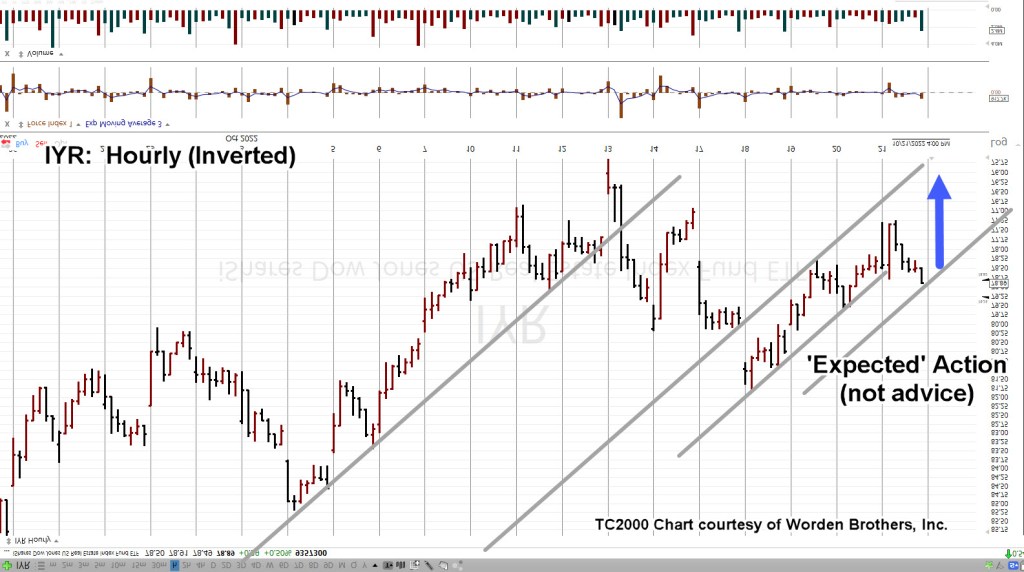
Since we’re positioned short (DRV-22-05), the chart’s inverted to mimic leveraged inverse fund DRV.
Real Estate IYR, Hourly (Inverted)
The important part is we see a repeating pattern of trendlines.
Moving in closer, we have this. The blue arrow is ‘expected’ action based on the analysis up to this point (not advice, not a recommendation).
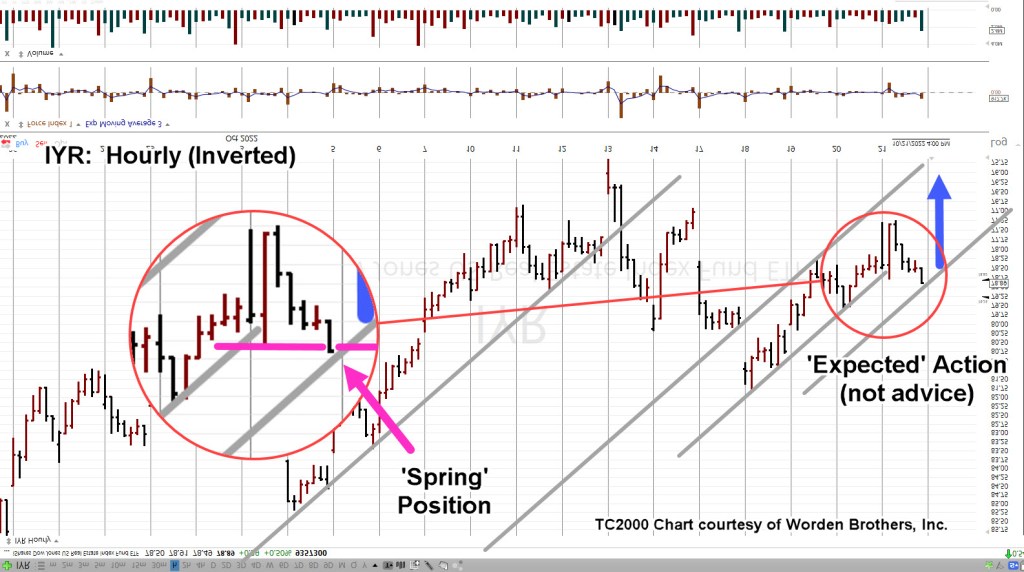
Moving even closer, the zoom shows IYR, finished the day in Wyckoff spring position; having pushed past minor support (resistance on non-inverted).
Summary
If IYR opens lower or gap-lower, we’ll have to wait and see if it posts a new daily low (below IYR ,77.24).
If that happens, we have some confirmation lower prices are ahead and can then set a definitive stop for DRV-22-05.
Obviously, a higher open (pushing past IYR 78.91), negates the trade.
Note: Posts on this site are for education purposes only. They provide one firm’s insight on the markets. Not investment advice. See additional disclaimer here.
Huge truth bombs from a just released Stew Peters broadcast, linked here.
At time stamp 15:25, one of the major truths is Taiwan; specifically, Taiwan Semiconductor, TSM.
Why Taiwan?
Why focus on Taiwan Semi and its connection to the Emerging Markets, EEM, ETF?
We’re focused on it because that’s what the tape itself is telling us to do. The EEM, has already been in a sustained downtrend since mid-February, last year.
It’s been three successive (chart) quarters of lower lows and lower highs.
Looking at semiconductors in general, out of the top ten market cap equities in the SOXX, only TSM, is at or below its 23.6% retrace level. All others have rebounded much higher.
As Wyckoff said a hundred years ago … ‘somebody always knows something.’
Meaning, those really in charge (time stamp 2:53, above) already know the plan; their actions show up on the tape.
We’ll look at those tape actions with TSM below
Taiwan Semi TSM, Daily Bar
Moving closer in on the daily, we have the following.
It’s clear, at this juncture, price action has stalled.
Two sessions ago (Wednesday, 23rd) there was an outside down (reversal) bar.
This session and yesterday’s, have been inside action so far.
There has been no new high or low, posted.
Although today’s action posted below yesterday’s low, it has not posted (currently, at mid-session) below the reversal low.
Summary
Anything can happen.
Price action, TSM could launch upward past the resistance and continue to a 38.2%, retrace.
At this point, it seems to be low probability; all the good news (i.e., the short squeeze), may be out.
We’re heading into the weekend and we’ve seen over and again, that’s when things go sideways.
As Livermore said, ‘surprises tend to happen in the direction of trend’.
TSM, is and has been, testing the underside of its breakdown; it now appears poised to continue lower.
Note: Posts on this site are for education purposes only. They provide one firm’s insight on the markets. Not investment advice. See additional disclaimer here.