Note: Posts on this site are for education purposes only. They provide one firm’s insight on the markets. Not investment advice. See additional disclaimer here.
Since Wyckoff analysis doesn’t care about the press, we’ll use it to discern the (potential) truth.
Let’s see how it did in the recent past. The Nat-Gas (UNG) low, was identified to-the-day,link here.
From that post, was this:
“Downward thrust in Nat-Gas UNG, appears to be exhausting itself after a 20-month, bear market.Risk is never zero, but currently appears to be at a low … “
So, it was. Afterwards, UNG bounced near, but never touched that low.
Twelve trading days later (Fibonacci 13 days, from low), it reversed decisively to the upside.
The Same, But Not
On the medium, to long-term, CORN action is the same as biotech (XBI), but opposite.
Instead of an up-thrust two-years in the making, we may have a spring set-up, taking just as long if not longer.
Note: Posts on this site are for education purposes only. They provide one firm’s insight on the markets. Not investment advice. See additional disclaimer here.
From the outset, the premise for biotech XBI, was this:
We’re in a huge up-thrust, several years in the making (not advice, not a recommendation).
With a set-up that big, downside potential was projected to be just as big, link here.
Then came the hard part, validating the premise and getting into position.
Nural Plasticity
So, it’s been on again, off again; a total of seven short trades; LABD-24-06 – LABD-24-12, with an eighth, LABD-24-13 opened, as of today.
The entire (closed) series has been profitable.
However, during that time, assessment of (major) downside potential shifted from confidence to caution, and now back to confidence.
‘Sticking to one’s guns’, no matter what the market (the tape) is saying, is a sign of real trouble.
The market itself directed the entering/exiting.
With that, let’s move on.
The ‘New’ Paradigm
Reviewing the host of ‘experts’ in the press and YouTube alike, (except for UE), everybody has their reason on why nothing (bad) will happen until after the ‘election’.
The last go-round should have broken that paradigm completely; but no, we’re still hanging on.
The ‘new’ paradigm is probably, ‘no’ paradigm. 🙂
From a Wyckoff perspective, the financial press is to be ignored except for when data releases are scheduled.
What’s in the release is not important; it’s the time and date itself, warning of potential volatility.
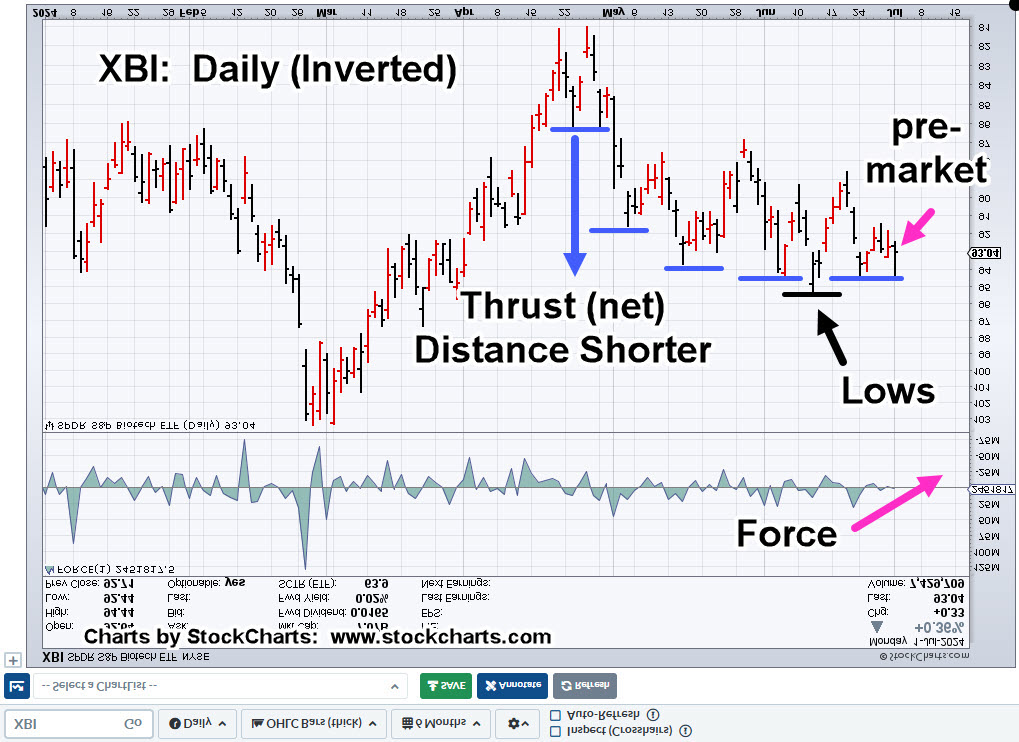
Biotech XBI, Daily (inverted)
Once again, inverting the chart to show the short-side (LABD) potential (not advice, not a recommendation).
Note: The dashed blue lines, an extension of the support level shows we’re also in a potential spring set-up at one higher timeframe, the weekly; more background, link here.
Positioning
As noted above, a new short position was opened via LABD, during this session (not advice, not a recommendation).
Typically, discussion of open trades within the trading community is (or should be) taboo. As Elder said years ago, there’s the real risk of ‘ego’ causing errors in discernment.
With that said, I might exit this trade at any time, without notice, without explanation.
Veteran traders will agree with that statement; when something’s ‘off’ with a trade (only known to them), it’s time to get out.
Nonetheless, a hard stop for today’s position would be yesterday’s LABD, low of 6.97 (not advice, not a recommendation).
Note: Posts on this site are for education purposes only. They provide one firm’s insight on the markets. Not investment advice. See additional disclaimer here.
Note: Posts on this site are for education purposes only. They provide one firm’s insight on the markets. Not investment advice. See additional disclaimer here.
Note: Posts on this site are for education purposes only. They provide one firm’s insight on the markets. Not investment advice. See additional disclaimer here.
No one knows if this is ‘The top’, or just ‘A top’, until it’s all over (not advice, not a recommendation).
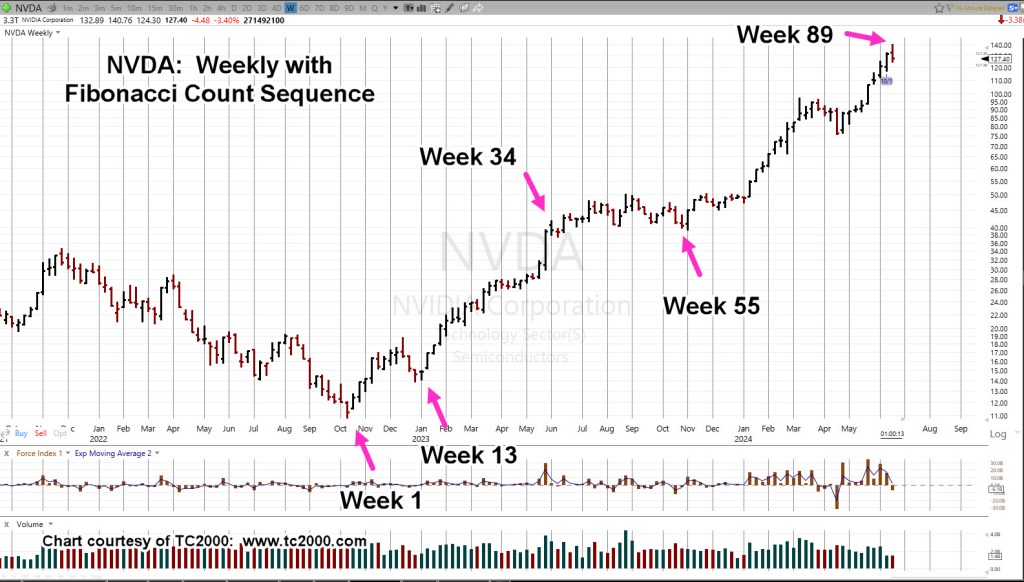
This update for Nvidia, said we’re nearing Fibonacci Week 89 (from the October ’22, lows); look for evidence of a reversal.
With three-hours left in the session, NVDA is on track (along with the SOXX) to posting a weekly reversal bar.
Nvidia NVDA, Weekly
The chart updated to show we’re at ‘Week 89’.
The fact (minus 3-hours) we’re getting a reversal bar on ‘Week 89’, is potential validation of the Fibonacci count.
The market itself is telling us where to look.
With the prior update letting us know the air is going out of support for continued A.I., today’s action may be a significant reversal (not advice, not a recommendation).
Update: 2:07 p.m., EST
Housekeeping Note:
While under no obligation to discuss trades, nonetheless, for those following the biotech short (LABD-24-12), that trade has been exited (for now) with profit (not advice, not a recommendation).
Note: Posts on this site are for education purposes only. They provide one firm’s insight on the markets. Not investment advice. See additional disclaimer here.
For a clue to the (potential) answer, we can look at what’s happening to Pfizer, link here and here.
However, let’s not get ourselves wrapped around the axle on events, forecast years ago.
Rather, let’s go straight to the truth, the price action and see what it’s telling us.
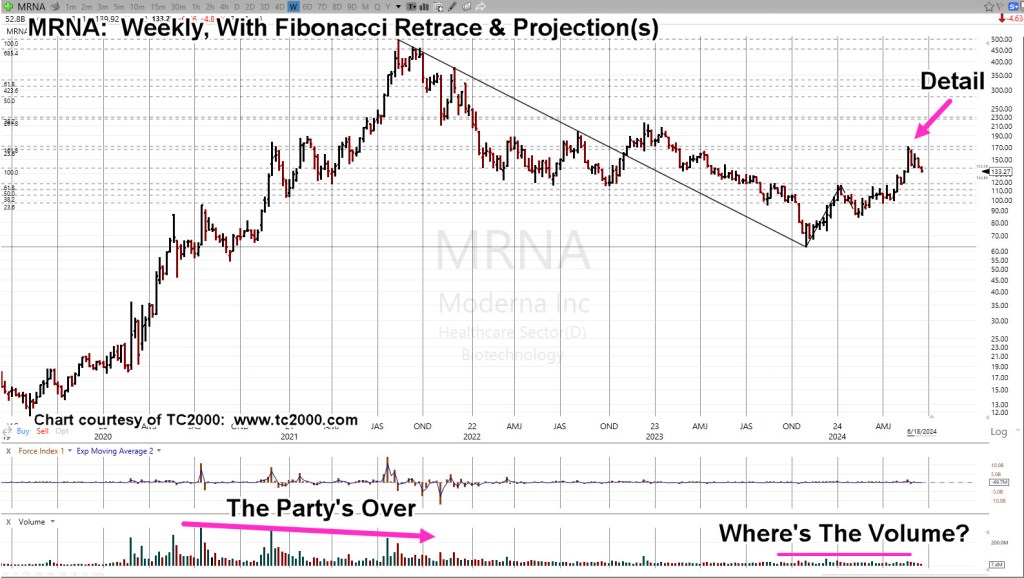
Moderna MRNA, Weekly
The entire move from low to highs is shown. Included on the chart, are two Fibonacci indicators.
One is the standard ‘retrace’ indicator; the other, is a ‘projection’ indicator.
The ‘projection’ is based off the ‘a-b-c’ move from the lows of November 2nd, 2023, to the highs on May 24, 2024.
The retrace and projections are hard to see, so the ‘Detail‘, arrow is where we’re headed next on the daily.
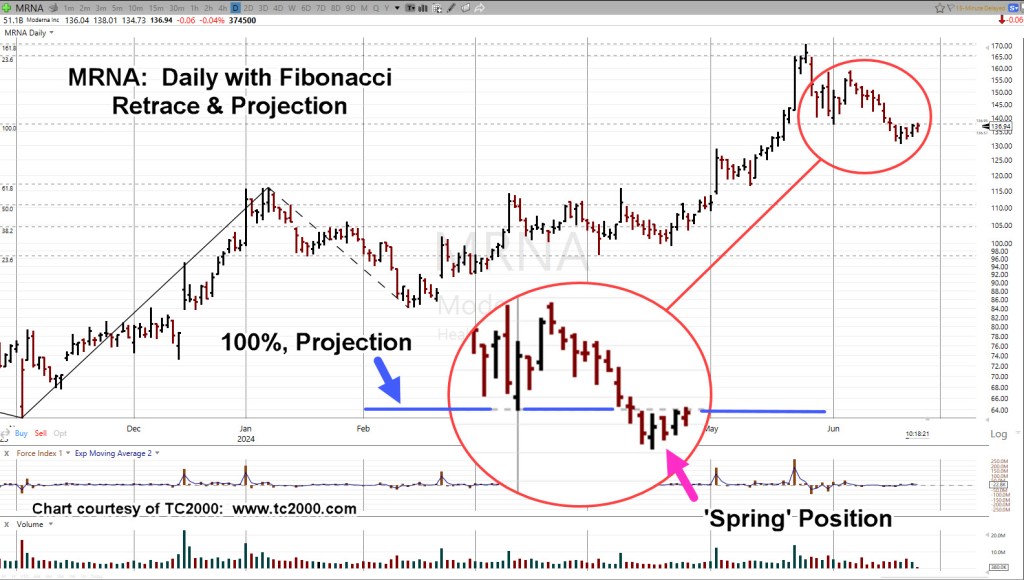
Moderna MRNA, Daily
If there ever was a chart to once-and-for-all, refute, dismiss, trash, the whole ‘Fundamentals’ argument, that earnings, interest rates or some other ‘Voodoo economics’, moves prices, this is it:
MRNA, price action hit the 23.6% retrace level (exactly) for two days before moving on to hit the 161.8%, projection (exactly) before reversing.
Note the ‘100%‘ level as well; price action confirmed this area (exactly) three times! Once on the way up and two times on the way down (third time, not shown).
A century ago, Livermore said, ‘It’s all about the numbers’.
Strategy, First
Just as Livermore was primary a strategist, so is this site’s method of analyzing the markets, i.e., Strategy, Tactics, Focus, in that order (not advice, not a recommendation).
The news has been replete with reports like this one and this one.
Another panic ahead?
Sounds like it but at least in the case of Moderna, the chart itself says (effectively):
‘There’s no money in it’.
That means, another wave like we saw several years ago, is not the most likely future event (not advice, not a recommendation).
Note: Posts on this site are for education purposes only. They provide one firm’s insight on the markets. Not investment advice. See additional disclaimer here.
The day started out with a bang; market’s up sharply on CPI print.
One could think, months of biotech (short) analysis, has been blown apart with this morning’s sharp move (not advice, not a recommendation).
Remember, this update said watch out for ‘French’ guys:
“However, just like the video snippet in the link above, what looks to be a dramatic conclusion to weeks if not months of work, could be completely derailed by a bunch of ‘French’ guys hanging out in a British castle.”
Well, here they are. 🙂
From a trading, positioning perspective, is it really that bad, what’s going on?
For that answer, we’re going straight to the hourly chart of 3X Inverse Leveraged Fund LABD.
Biotech 3X Leveraged Inverse LABD, Hourly
Early morning price action penetrated the stop level given in this update.
However, as can be seen, price action behavior of LABD was different than (inverse fund) SOXS, under similar conditions; it did not keep going lower but stopped dead.
It’s clear, action at this point, is pulling away from the lows.
Rate Cuts Not
Way back in January of 2023, this site proposed the ‘rate cut’ discussion was nothing more than a ruse; keeping everybody (the press, especially) busy acting like Pavlov’s Dogs, while the big rug-pull was being set-up.
With that in mind, here’s the real story of what’s going on (not advice, not a recommendation).
Positioning
In a little bit of a market ‘cheat’, LABD is currently trading above the prior stop level.
At the risk of making a gross trading error, the short position in biotech (via LABD) is being maintained (not advice, definitely not a recommendation).
However, even as this post is being created (3:15 p.m., EST), biotech XBI continues to erode back into the trading range with LABD, continuing to rise.
Note: Posts on this site are for education purposes only. They provide one firm’s insight on the markets. Not investment advice. See additional disclaimer here.
‘If, on the next pull-back, volume contracts, the spring has been tested …’; David Weis
On the chart, that’s what we have.
Today also looks to be an apparent 50%, retrace on Fibonacci Day 3, from the June 6th, reversal.
Taking it all together, the next session(s) could be very interesting.
Biotech XBI, Daily (inverted)
Is it textbook?
We have a spring set-up penetration (resistance non-inverted), a swift move upward and now, a test back to 50% (level not shown), on contracting volume.
If the test is complete, the obvious expectation is for a higher open (lower non-inverted) at the next session (not advice, not a recommendation)
Rule of Alternation
Using this update and the discussion of ‘alternation’, we can already see price action is more volatile and so far, has ‘simple’ form.
Note: Posts on this site are for education purposes only. They provide one firm’s insight on the markets. Not investment advice. See additional disclaimer here.
There are plenty of horror stories selling options. A typical example, is this one.
However, when buying options (to open), as Dr. Elder has said, you have to jump through ‘three hoops at once‘; get it right on the stock, direction, and time.
He goes on to say, working the options market is counter intuitive. Traders naturally gravitate to long-dated, in-the-money options so the trade has time ‘work out’.
His method’s the opposite; short-dated, out-of-the-money.
So, what exactly does that look like?
The XBI, Short-Dated, Put
The situation on biotech, its reversal, first covered here, is a well-known topic on this site.
Using that information, especially this update and this one, probabilities were high for downside the next session.
With that, we have the following.
Biotech XBI, 1-minute
Time stamp on the entry from the broker states: 15:35:10, shown on the chart.
Time stamp on the exit is: 09:31:43, also shown.
Note: Entry was executed as the price of XBI was rising (for nine-minutes), with option value declining.
That rise does not look like much but we’re one day before expiration; option value is fluctuating significantly.
Perfection vs. Effectiveness
After the entry, we see later, there’s a 1-minute ‘blip’ higher before that blip was reversed.
Waiting for entry could have been better from a lower price standpoint.
That blip could have easily gone the other way, option value rising rapidly, low-risk (entry) opportunity gone.
Looking at the chart, one could say that ‘it’s not perfect’ and that’s true.
However, for being in the market just 29-trading minutes, gain of +160%, one could say, it was highly effective.
Note: Posts on this site are for education purposes only. They provide one firm’s insight on the markets. Not investment advice. See additional disclaimer here.